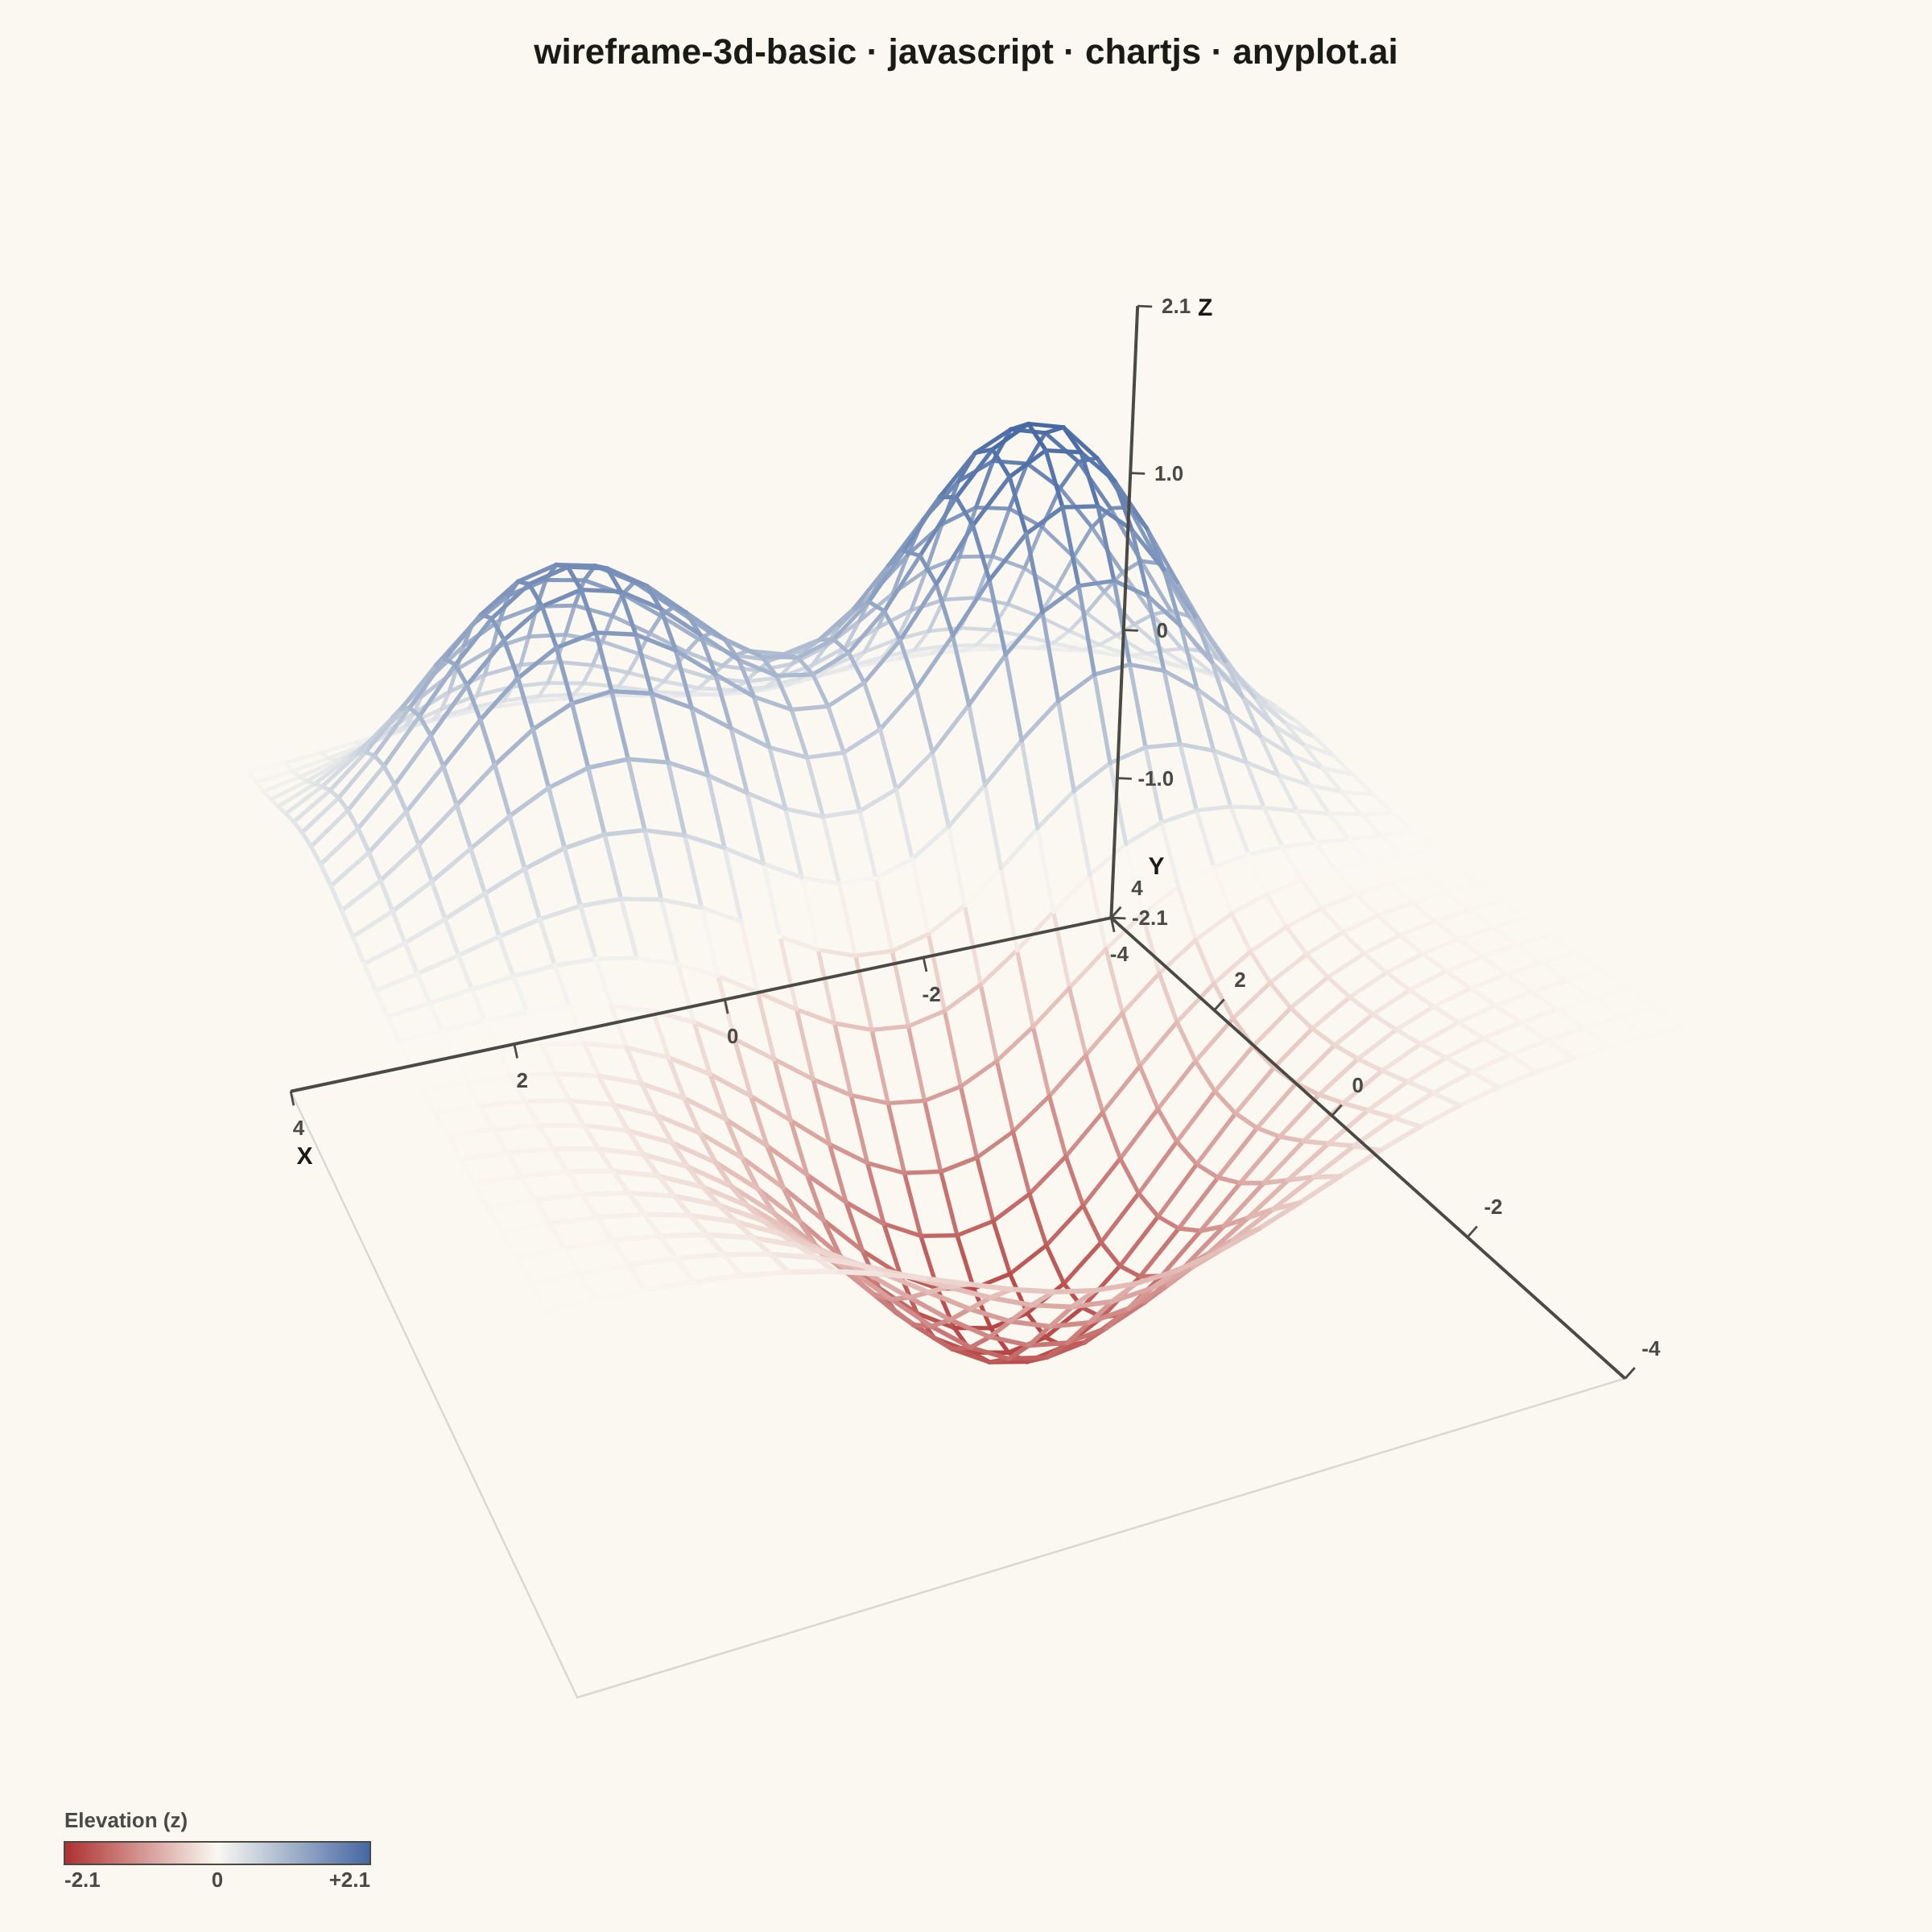
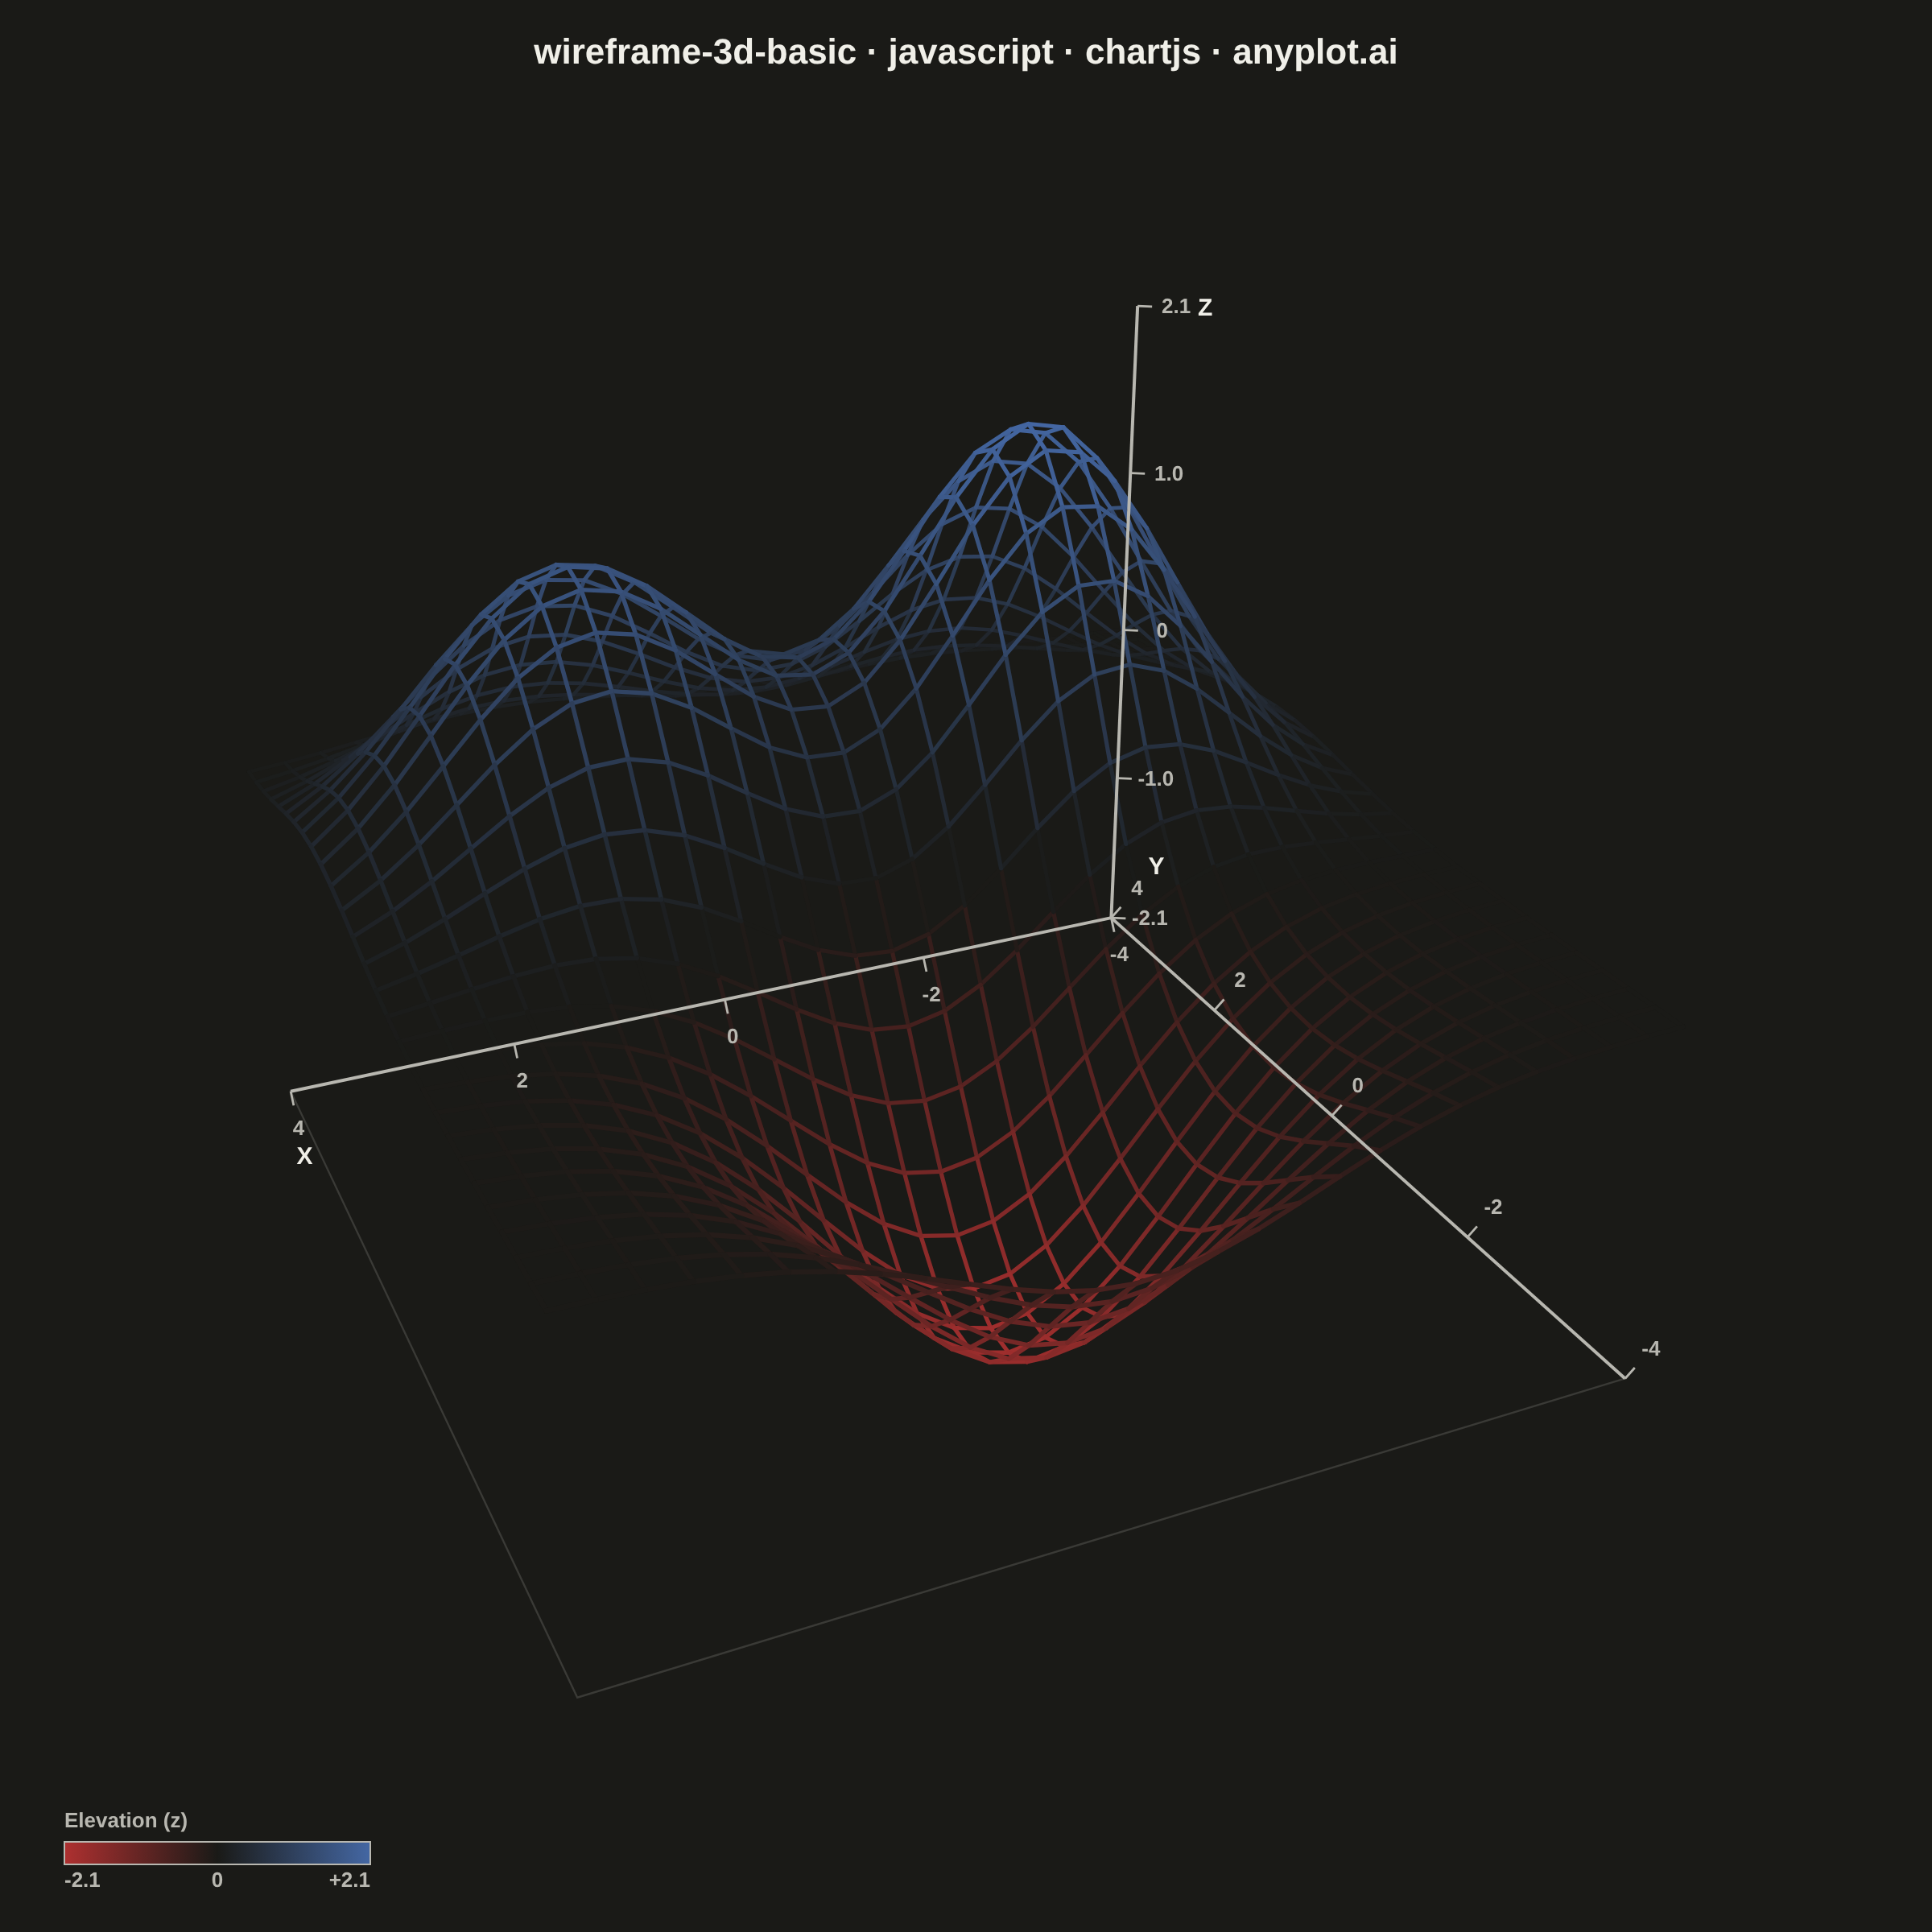
A 3D wireframe plot displays a mathematical surface as a mesh of lines connecting grid points in three-dimensional space. Unlike solid surface plots, wireframes render only the edges between grid points, creating a see-through visualization that reveals the underlying structure and allows viewing parts of the surface that would otherwise be hidden. This makes wireframes ideal for understanding the topology and shape of 3D functions.
// anyplot.ai
// wireframe-3d-basic: Basic 3D Wireframe Plot
// Library: chartjs 4.4.7 | JavaScript 22.23.1
// Quality: 88/100 | Created: 2026-08-04
//# anyplot-orientation: square

const t = window.ANYPLOT_TOKENS;
const INK = t.ink;
const INK_SOFT = t.inkSoft;
const GRID = t.grid;

// --- Data: two-hill / one-valley terrain z = f(x, y) ------------------------
// A sum of Gaussian bumps (two positive peaks, one negative dip) gives a
// terrain-like surface with a meaningful z = 0 baseline — a good fit for the
// "exploring terrain / topographical data" application from the spec.
const GRID_N = 28; // grid points per axis (spec recommends 20x20 - 50x50)
const X_MIN = -4, X_MAX = 4, Y_MIN = -4, Y_MAX = 4;

const bump = (x, y, cx, cy, sx, sy, amp) =>
  amp * Math.exp(-(((x - cx) ** 2) / (2 * sx * sx) + ((y - cy) ** 2) / (2 * sy * sy)));

const heightFn = (x, y) =>
  bump(x, y, -1.7, 1.3, 1.05, 1.05, 2.1) +
  bump(x, y, 1.9, 1.6, 1.15, 1.15, 1.6) -
  bump(x, y, 0.1, -2.1, 1.3, 1.3, 1.9);

const xs = Array.from({ length: GRID_N }, (_, i) => X_MIN + ((X_MAX - X_MIN) * i) / (GRID_N - 1));
const ys = Array.from({ length: GRID_N }, (_, j) => Y_MIN + ((Y_MAX - Y_MIN) * j) / (GRID_N - 1));
const Z = ys.map((y) => xs.map((x) => heightFn(x, y)));

let zMin = Infinity, zMax = -Infinity;
for (const row of Z) for (const v of row) { if (v < zMin) zMin = v; if (v > zMax) zMax = v; }
const zAbsMax = Math.max(Math.abs(zMin), Math.abs(zMax));

// --- Normalize data into a symmetric cube for a stable projection -----------
const xHalf = (X_MAX - X_MIN) / 2, xMid = (X_MAX + X_MIN) / 2;
const yHalf = (Y_MAX - Y_MIN) / 2, yMid = (Y_MAX + Y_MIN) / 2;
const Z_SCALE = 0.78; // vertical exaggeration relative to the xy half-extent
const norm = (x, y, z) => [(x - xMid) / xHalf, (y - yMid) / yHalf, (z / zAbsMax) * Z_SCALE];

// --- Camera: elevation/azimuth view + true perspective projection -----------
// Standard axonometric-camera technique: build a right/up/forward basis from
// elevation + azimuth, then divide by depth-along-view for perspective.
const ELEV_DEG = 28, AZIM_DEG = -66; // close to the spec's suggested viewing angle
const elev = (ELEV_DEG * Math.PI) / 180;
const azim = (AZIM_DEG * Math.PI) / 180;
const camDir = [Math.cos(elev) * Math.cos(azim), Math.cos(elev) * Math.sin(azim), Math.sin(elev)];
const worldUp = [0, 0, 1];
const cross = (a, b) => [a[1] * b[2] - a[2] * b[1], a[2] * b[0] - a[0] * b[2], a[0] * b[1] - a[1] * b[0]];
const normalize = (a) => { const l = Math.hypot(a[0], a[1], a[2]); return [a[0] / l, a[1] / l, a[2] / l]; };
const right = normalize(cross(camDir, worldUp));
const camUp = cross(right, camDir);

const CAM_DIST = 5.0, FOCAL = 5.0;
const projectNorm = (nx, ny, nz) => {
  const px = nx * right[0] + ny * right[1] + nz * right[2];
  const py = nx * camUp[0] + ny * camUp[1] + nz * camUp[2];
  const pd = nx * camDir[0] + ny * camDir[1] + nz * camDir[2];
  const depth = CAM_DIST - pd;
  const scale = FOCAL / depth;
  return { x: px * scale, y: py * scale, depth, scale };
};
const project = (x, y, z) => projectNorm(...norm(x, y, z));

// --- Height -> Imprint diverging colour (meaningful midpoint at z = 0) ------
const hexToRgb = (h) => [1, 3, 5].map((i) => parseInt(h.slice(i, i + 2), 16));
const divLo = hexToRgb(t.div[0]), divMid = hexToRgb(t.div[1]), divHi = hexToRgb(t.div[2]);
const lerpRgb = (a, b, f) => a.map((v, i) => Math.round(v + (b[i] - v) * f));
const clamp = (v, lo, hi) => Math.min(hi, Math.max(lo, v));
const heightColor = (z) => {
  const f = zAbsMax > 0 ? clamp(z / zAbsMax, -1, 1) : 0;
  const c = f < 0 ? lerpRgb(divLo, divMid, f + 1) : lerpRgb(divMid, divHi, f);
  return `rgb(${c[0]},${c[1]},${c[2]})`;
};

// --- Build wireframe segments (row lines + column lines), depth-sortable ----
const BASE_LINE_W = 2.6;
const segments = [];
const addSegment = (x1, y1, z1, x2, y2, z2) => {
  const p1 = project(x1, y1, z1), p2 = project(x2, y2, z2);
  segments.push({
    x1: p1.x, y1: p1.y, x2: p2.x, y2: p2.y,
    depth: (p1.depth + p2.depth) / 2,
    color: heightColor((z1 + z2) / 2),
    width: BASE_LINE_W * clamp((p1.scale + p2.scale) / 2, 0.82, 1.4),
  });
};
for (let j = 0; j < GRID_N; j++) {
  for (let i = 0; i < GRID_N - 1; i++) addSegment(xs[i], ys[j], Z[j][i], xs[i + 1], ys[j], Z[j][i + 1]);
}
for (let i = 0; i < GRID_N; i++) {
  for (let j = 0; j < GRID_N - 1; j++) addSegment(xs[i], ys[j], Z[j][i], xs[i], ys[j + 1], Z[j + 1][i]);
}
segments.sort((a, b) => b.depth - a.depth); // painter's algorithm: farthest first

// --- Axis box: pick the farthest corner so axes sit behind the mesh ---------
let axisCorner = null, bestDepth = -Infinity;
for (const sx of [-1, 1]) for (const sy of [-1, 1]) for (const sz of [-1, 1]) {
  const d = projectNorm(sx, sy, sz * Z_SCALE).depth;
  if (d > bestDepth) { bestDepth = d; axisCorner = [sx, sy, sz]; }
}
const [cSignX, cSignY, cSignZ] = axisCorner;
const xAtCorner = cSignX > 0 ? X_MAX : X_MIN;
const yAtCorner = cSignY > 0 ? Y_MAX : Y_MIN;
const zAtCorner = cSignZ > 0 ? zAbsMax : -zAbsMax;

const axisEdges = [
  { from: [X_MIN, yAtCorner, zAtCorner], to: [X_MAX, yAtCorner, zAtCorner], ticks: [-4, -2, 0, 2, 4], label: "X", fmt: (v) => `${v}` },
  { from: [xAtCorner, Y_MIN, zAtCorner], to: [xAtCorner, Y_MAX, zAtCorner], ticks: [-4, -2, 0, 2, 4], label: "Y", fmt: (v) => `${v}` },
  { from: [xAtCorner, yAtCorner, -zAbsMax], to: [xAtCorner, yAtCorner, zAbsMax], ticks: [-1, -0.5, 0, 0.5, 1].map((f) => +(f * zAbsMax).toFixed(2)), label: "Z", fmt: (v) => (Math.abs(v) < 1e-9 ? "0" : v.toFixed(1)) },
];

// --- Floor reference plane (subtle, grounds the terrain in space) -----------
const floorCorners = [
  [X_MIN, Y_MIN, -zAbsMax], [X_MAX, Y_MIN, -zAbsMax],
  [X_MAX, Y_MAX, -zAbsMax], [X_MIN, Y_MAX, -zAbsMax],
].map(([x, y, z]) => project(x, y, z));

// --- Fit chart scales to the projected content (no clipping, no guessing) ---
let minX = Infinity, maxX = -Infinity, minY = Infinity, maxY = -Infinity;
const consider = (p) => { if (p.x < minX) minX = p.x; if (p.x > maxX) maxX = p.x; if (p.y < minY) minY = p.y; if (p.y > maxY) maxY = p.y; };
segments.forEach((s) => { consider({ x: s.x1, y: s.y1 }); consider({ x: s.x2, y: s.y2 }); });
axisEdges.forEach((e) => { consider(project(...e.from)); consider(project(...e.to)); });
floorCorners.forEach(consider);

const MARGIN = 0.3; // room for tick labels + axis titles outside the box
let halfX = ((maxX - minX) / 2) * (1 + MARGIN);
let halfY = ((maxY - minY) / 2) * (1 + MARGIN);
const midX = (minX + maxX) / 2, midY = (minY + maxY) / 2;
// Square mount (1200x1200 CSS) — this camera angle projects the cube into a
// roughly square bounding box, so a square canvas (vs. the 16:9 default)
// keeps x/y data units undistorted while letting the wireframe actually fill
// the frame instead of leaving huge empty bands on a landscape canvas.
const TARGET_ASPECT = 1.0;
if (halfX / halfY < TARGET_ASPECT) halfX = halfY * TARGET_ASPECT; else halfY = halfX / TARGET_ASPECT;

// --- Mount --------------------------------------------------------------
const canvas = document.createElement("canvas");
document.getElementById("container").appendChild(canvas);

// --- Plugin: floor, depth-sorted wireframe, axis box + ticks, colour key ----
const wireframePlugin = {
  id: "wireframe3d",
  beforeDatasetsDraw(chart) {
    const { ctx, scales: { x, y } } = chart;
    const toPx = (X, Y) => [x.getPixelForValue(X), y.getPixelForValue(Y)];

    // Floor outline.
    ctx.save();
    ctx.strokeStyle = GRID;
    ctx.lineWidth = 1.2;
    ctx.beginPath();
    floorCorners.forEach((p, k) => {
      const [px, py] = toPx(p.x, p.y);
      k === 0 ? ctx.moveTo(px, py) : ctx.lineTo(px, py);
    });
    ctx.closePath();
    ctx.stroke();
    ctx.restore();

    // Wireframe mesh, back-to-front.
    ctx.save();
    ctx.lineCap = "round";
    ctx.lineJoin = "round";
    for (const s of segments) {
      const [ax, ay] = toPx(s.x1, s.y1);
      const [bx, by] = toPx(s.x2, s.y2);
      ctx.strokeStyle = s.color;
      ctx.lineWidth = s.width;
      ctx.beginPath();
      ctx.moveTo(ax, ay);
      ctx.lineTo(bx, by);
      ctx.stroke();
    }
    ctx.restore();

    // Axis box edges + ticks + labels.
    ctx.save();
    ctx.strokeStyle = INK_SOFT;
    ctx.fillStyle = INK_SOFT;
    ctx.font = "600 13px -apple-system, Segoe UI, Roboto, sans-serif";
    ctx.textAlign = "center";
    ctx.textBaseline = "middle";
    const originPx = toPx(0, 0); // data origin always projects to screen (0,0)

    for (const edge of axisEdges) {
      const pA = project(...edge.from), pB = project(...edge.to);
      const [ax, ay] = toPx(pA.x, pA.y);
      const [bx, by] = toPx(pB.x, pB.y);
      ctx.lineWidth = 2;
      ctx.beginPath();
      ctx.moveTo(ax, ay);
      ctx.lineTo(bx, by);
      ctx.stroke();

      // Constant tangent direction along the (straight) projected edge.
      const dx = bx - ax, dy = by - ay;
      const len = Math.hypot(dx, dy) || 1;
      let perpX = -dy / len, perpY = dx / len;
      const midx = (ax + bx) / 2, midy = (ay + by) / 2;
      if (perpX * (midx - originPx[0]) + perpY * (midy - originPx[1]) < 0) { perpX = -perpX; perpY = -perpY; }

      // Real-space tick positions interpolated along the edge's dominant axis.
      const tickSpan = edge.ticks[edge.ticks.length - 1] - edge.ticks[0];
      for (let k = 0; k < edge.ticks.length; k++) {
        const f = (edge.ticks[k] - edge.ticks[0]) / tickSpan;
        const px3 = edge.from[0] + (edge.to[0] - edge.from[0]) * f;
        const py3 = edge.from[1] + (edge.to[1] - edge.from[1]) * f;
        const pz3 = edge.from[2] + (edge.to[2] - edge.from[2]) * f;
        const pt = project(px3, py3, pz3);
        const [tx, ty] = toPx(pt.x, pt.y);
        ctx.lineWidth = 1.4;
        ctx.beginPath();
        ctx.moveTo(tx, ty);
        ctx.lineTo(tx + perpX * 9, ty + perpY * 9);
        ctx.stroke();
        ctx.fillText(edge.fmt(edge.ticks[k]), tx + perpX * 24, ty + perpY * 24);
      }

      // Axis title beyond the far end.
      ctx.save();
      ctx.font = "700 15px -apple-system, Segoe UI, Roboto, sans-serif";
      ctx.fillStyle = INK;
      ctx.fillText(edge.label, bx + perpX * 42, by + perpY * 42);
      ctx.restore();
    }
    ctx.restore();
  },

  afterDatasetsDraw(chart) {
    const { ctx, chartArea } = chart;

    // Elevation colour key (bottom-left), fixed to the chart area in pixels.
    ctx.save();
    const keyX = chartArea.left + 24;
    const keyY = chartArea.bottom - 40;
    const keyW = 190, keyH = 14;
    const grad = ctx.createLinearGradient(keyX, 0, keyX + keyW, 0);
    grad.addColorStop(0, t.div[0]);
    grad.addColorStop(0.5, t.div[1]);
    grad.addColorStop(1, t.div[2]);
    ctx.fillStyle = grad;
    ctx.fillRect(keyX, keyY, keyW, keyH);
    ctx.strokeStyle = INK_SOFT;
    ctx.lineWidth = 1;
    ctx.strokeRect(keyX, keyY, keyW, keyH);

    ctx.font = "600 13px -apple-system, Segoe UI, Roboto, sans-serif";
    ctx.fillStyle = INK_SOFT;
    ctx.textBaseline = "bottom";
    ctx.textAlign = "left";
    ctx.fillText("Elevation (z)", keyX, keyY - 6);
    ctx.textAlign = "left";
    ctx.textBaseline = "top";
    ctx.fillText(`${(-zAbsMax).toFixed(1)}`, keyX, keyY + keyH + 4);
    ctx.textAlign = "center";
    ctx.fillText("0", keyX + keyW / 2, keyY + keyH + 4);
    ctx.textAlign = "right";
    ctx.fillText(`+${zAbsMax.toFixed(1)}`, keyX + keyW, keyY + keyH + 4);
    ctx.restore();
  },
};

// --- Chart --------------------------------------------------------------
new Chart(canvas, {
  type: "scatter",
  data: { datasets: [{ data: [], showLine: false, pointRadius: 0 }] },
  options: {
    responsive: true,
    maintainAspectRatio: false,
    animation: false,
    layout: { padding: 16 },
    plugins: {
      title: {
        display: true,
        text: "wireframe-3d-basic · javascript · chartjs · anyplot.ai",
        color: INK,
        font: { size: 22, weight: "600" },
        padding: { top: 4, bottom: 14 },
      },
      legend: { display: false },
      tooltip: { enabled: false },
    },
    scales: {
      x: { type: "linear", min: midX - halfX, max: midX + halfX, display: false },
      y: { type: "linear", min: midY - halfY, max: midY + halfY, display: false },
    },
  },
  plugins: [wireframePlugin],
});
Runnable source as JSON, for any HTTP client: https://api.anyplot.ai/specs/wireframe-3d-basic/chartjs/code. Any spec id and library id listed in llms-full.txt fit the same URL shape; every URL below is complete and callable.
{
  "spec_id": "wireframe-3d-basic",
  "language": "javascript",
  "library": "chartjs",
  "page": "https://anyplot.ai/wireframe-3d-basic/javascript/chartjs",
  "hub": "https://anyplot.ai/wireframe-3d-basic",
  "code_json": "https://api.anyplot.ai/specs/wireframe-3d-basic/chartjs/code",
  "spec_json": "https://api.anyplot.ai/specs/wireframe-3d-basic",
  "render_light_png": "https://storage.googleapis.com/anyplot-images/plots/wireframe-3d-basic/javascript/chartjs/plot-light.png",
  "render_dark_png": "https://storage.googleapis.com/anyplot-images/plots/wireframe-3d-basic/javascript/chartjs/plot-dark.png",
  "interactive_light_html": "https://storage.googleapis.com/anyplot-images/plots/wireframe-3d-basic/javascript/chartjs/plot-light.html",
  "interactive_dark_html": "https://storage.googleapis.com/anyplot-images/plots/wireframe-3d-basic/javascript/chartjs/plot-dark.html",
  "quality_score": 88.0,
  "license": "MIT",
  "guide": "https://anyplot.ai/llms.txt"
}
Part of Basic 3D Wireframe Plot on anyplot.ai.