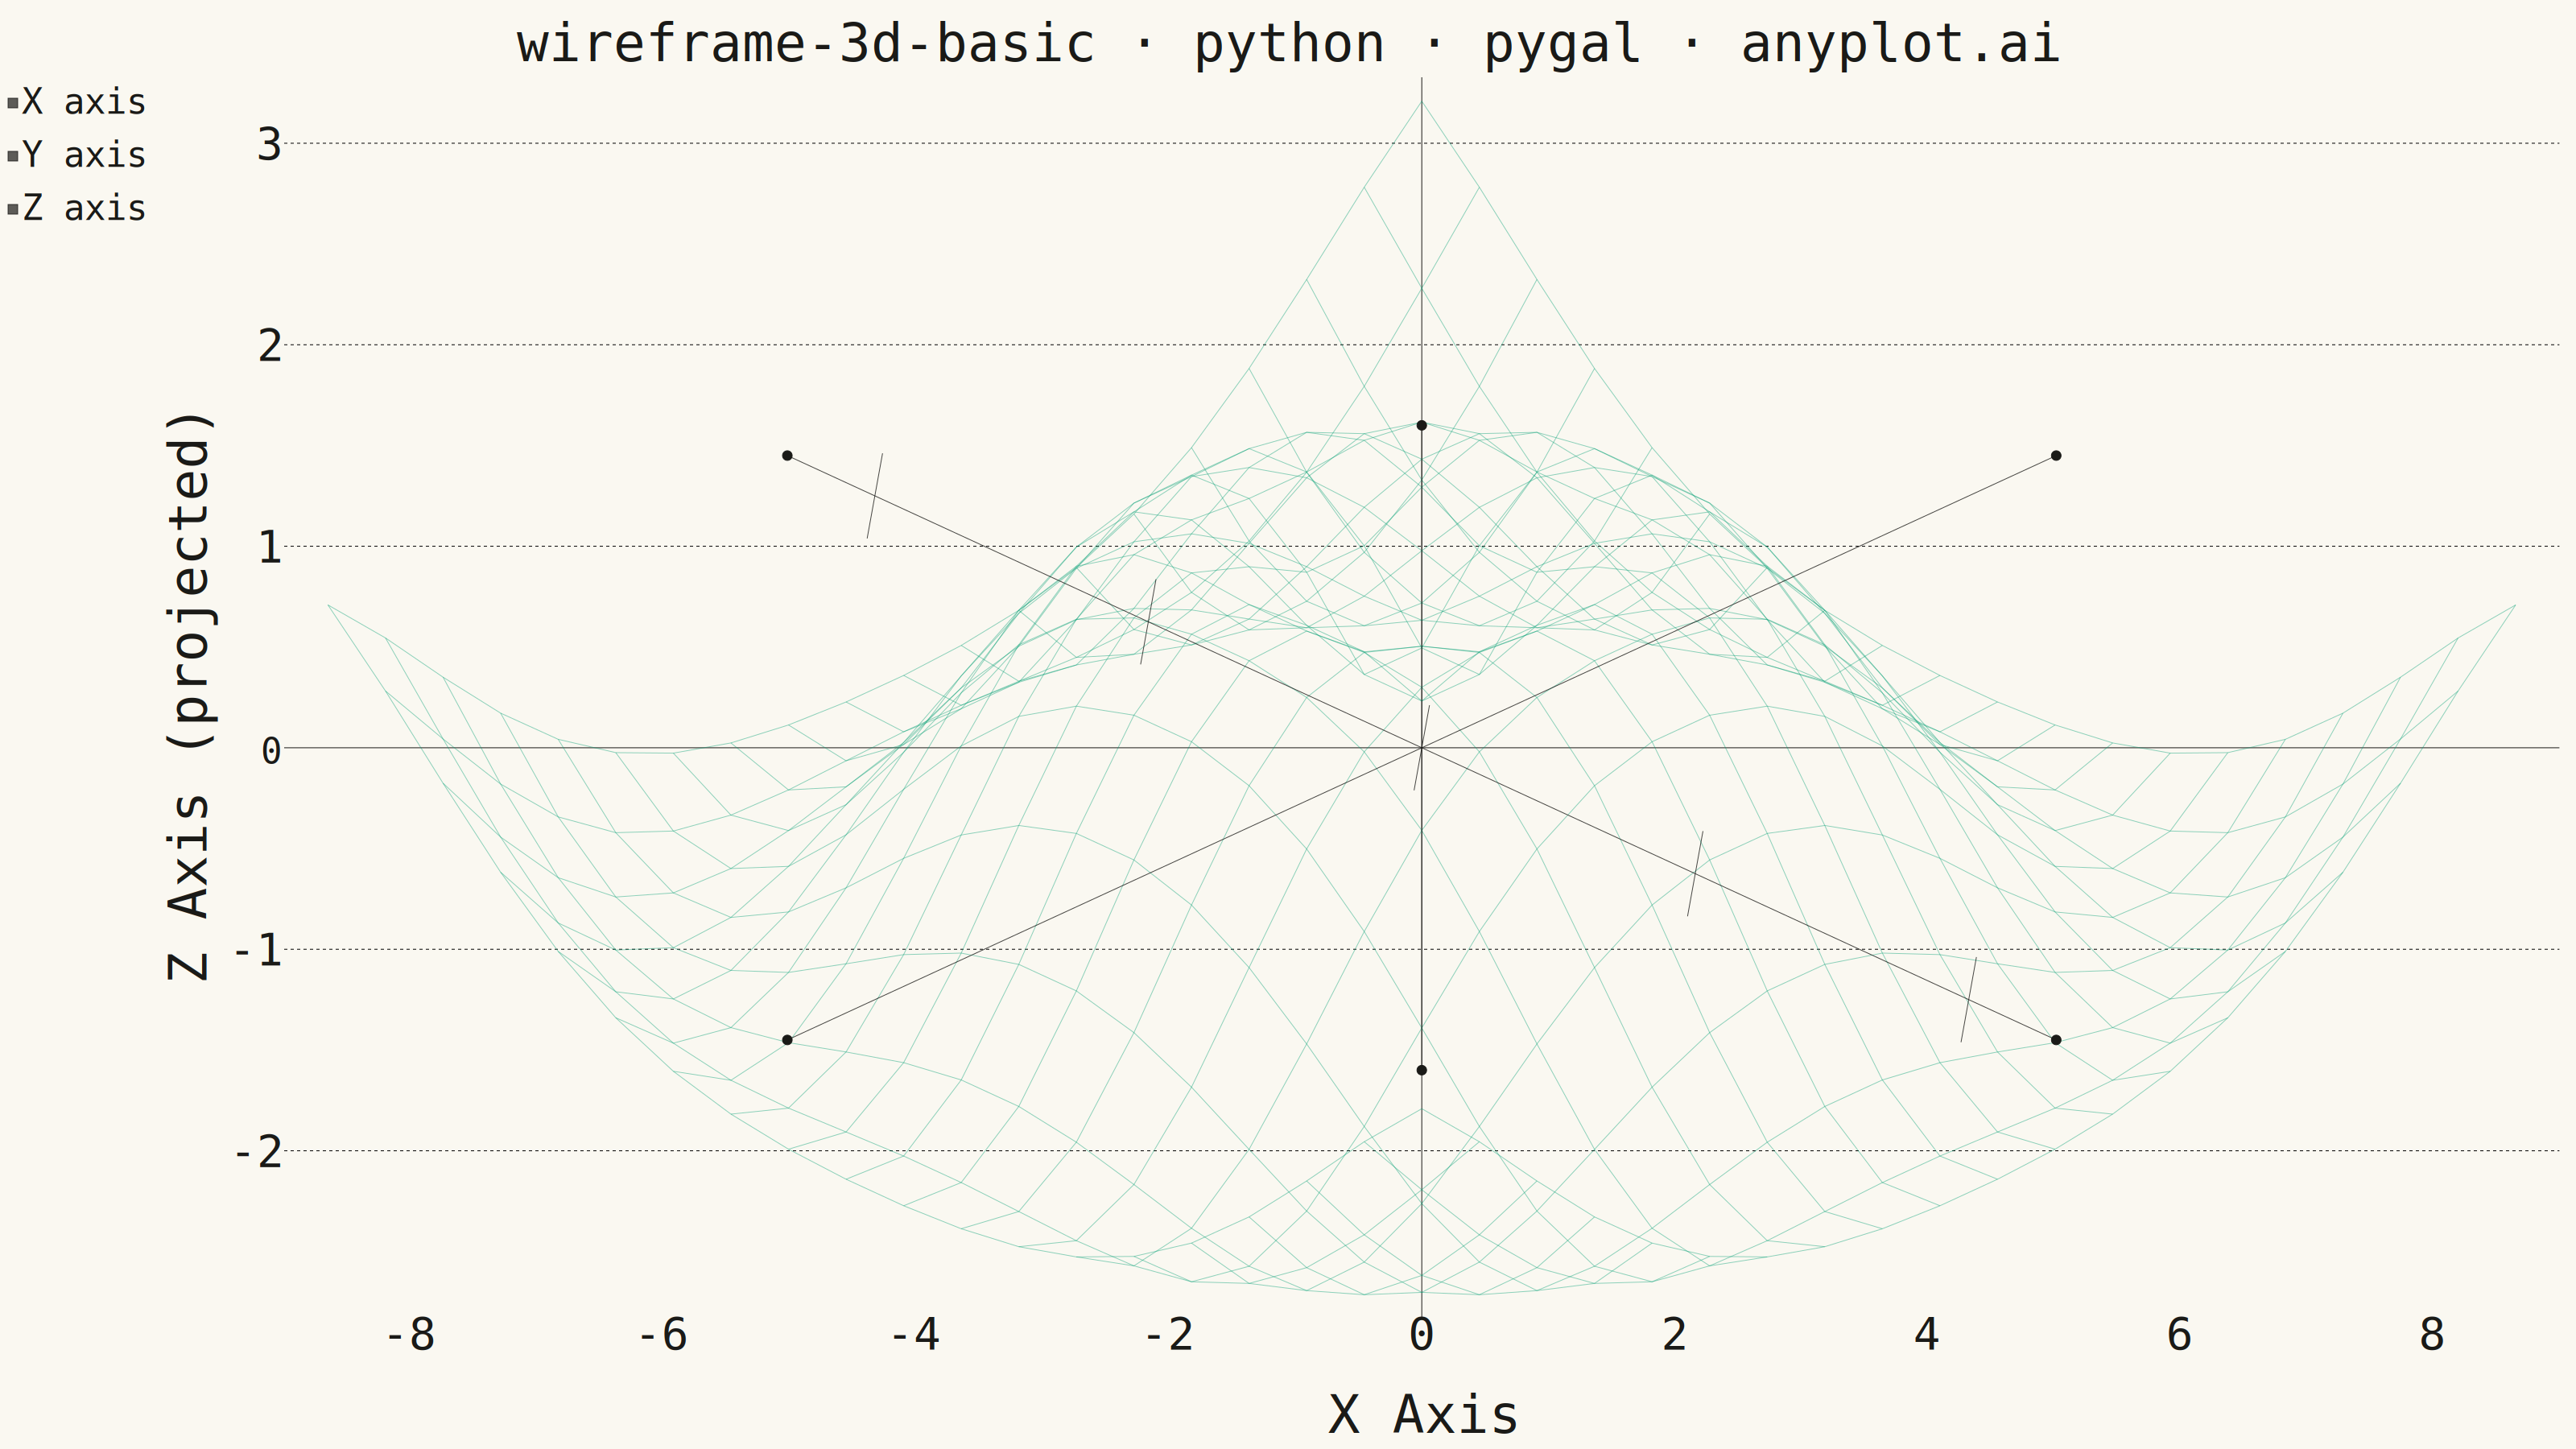
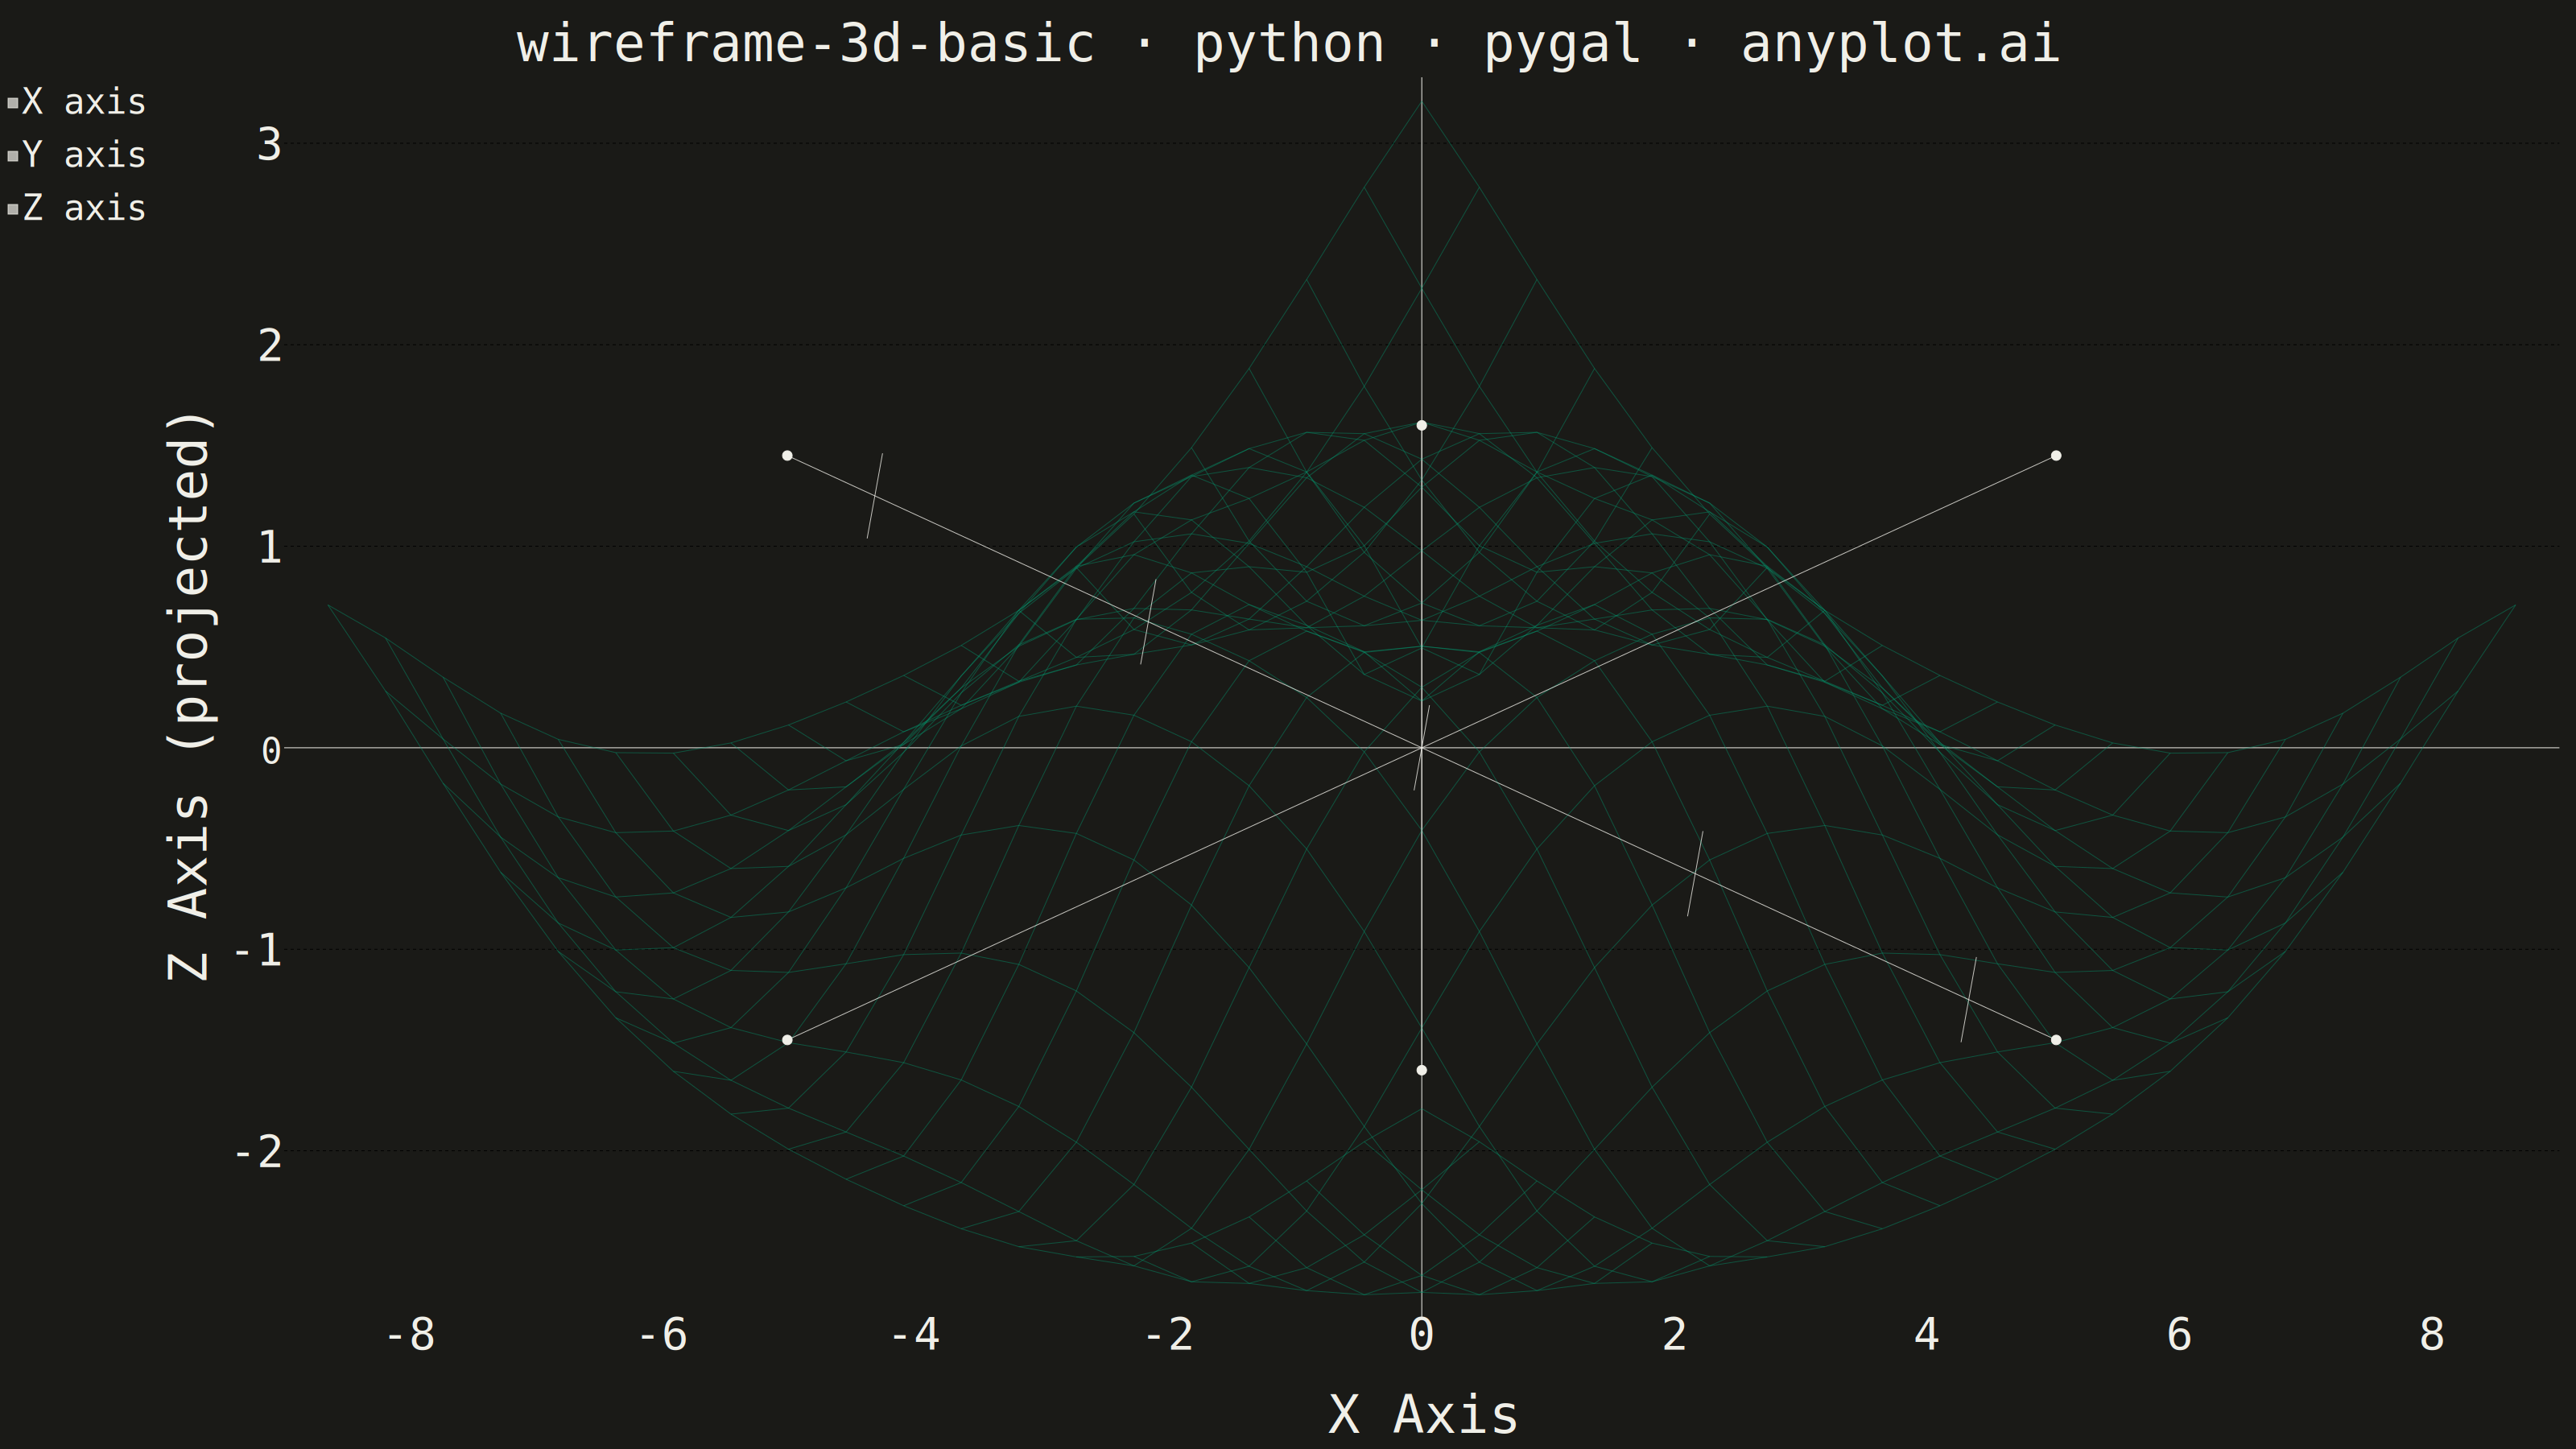
A 3D wireframe plot displays a mathematical surface as a mesh of lines connecting grid points in three-dimensional space. Unlike solid surface plots, wireframes render only the edges between grid points, creating a see-through visualization that reveals the underlying structure and allows viewing parts of the surface that would otherwise be hidden. This makes wireframes ideal for understanding the topology and shape of 3D functions.
""" anyplot.ai
wireframe-3d-basic: Basic 3D Wireframe Plot
Library: pygal 3.1.3 | Python 3.13.14
Quality: 81/100 | Updated: 2026-08-04
"""

import os
import sys


# Remove current directory from path to avoid importing local pygal.py
sys.path = [p for p in sys.path if not (p == "" or p == "." or p.endswith("implementations/python"))]

import numpy as np
import pygal
from pygal.style import Style


THEME = os.getenv("ANYPLOT_THEME", "light")
PAGE_BG = "#FAF8F1" if THEME == "light" else "#1A1A17"
INK = "#1A1A17" if THEME == "light" else "#F0EFE8"
INK_MUTED = "#6B6A63" if THEME == "light" else "#A8A79F"

BRAND = "#009E73"  # Imprint palette position 1 — wireframe surface color
BRAND_FADE = "rgba(0, 158, 115, 0.55)"  # translucent wireframe strokes fake depth ordering

ISO_ANGLE = np.pi / 6
COS_A, SIN_A = np.cos(ISO_ANGLE), np.sin(ISO_ANGLE)


def isometric_project(x, y, z):
    """Project 3D coordinates onto a 2D isometric view."""
    x2d = (x - y) * COS_A
    y2d = z + (x + y) * SIN_A * 0.5
    return x2d, y2d


# Data — kept at the lower end of the spec's 20x20-50x50 range so the
# isometric projection (no hidden-line removal) doesn't overplot into an
# unreadable crosshatch.
grid_size = 20
x = np.linspace(-5, 5, grid_size)
y = np.linspace(-5, 5, grid_size)
X, Y = np.meshgrid(x, y)
Z = np.sin(np.sqrt(X**2 + Y**2))

# One continuous polyline per row/column instead of a segment-per-edge —
# keeps the same mesh but at 2*grid_size series instead of ~grid_size^2*2.
row_lines = [[isometric_project(X[i, j], Y[i, j], Z[i, j]) for j in range(grid_size)] for i in range(grid_size)]
col_lines = [[isometric_project(X[i, j], Y[i, j], Z[i, j]) for i in range(grid_size)] for j in range(grid_size)]

# Small axis gizmo anchored at the world origin, projected the same way as
# the surface, so it stays true to the isometric view instead of a separate
# 2D inset. Its 3 legend entries are the only explicit "X/Y/Z axis" labels
# pygal.XY's two native axis titles can't provide on their own.
axis_extent = 5.8
z_extent = 1.6
x_axis = [isometric_project(-axis_extent, 0, 0), isometric_project(axis_extent, 0, 0)]
y_axis = [isometric_project(0, -axis_extent, 0), isometric_project(0, axis_extent, 0)]
z_axis = [isometric_project(0, 0, -z_extent), isometric_project(0, 0, z_extent)]

# Y axis has no native pygal ticks (unlike X/Z, which get real numeric ticks
# from the chart's own axes), so hand-draw perpendicular tick marks along its
# gizmo line at real world-Y positions.
y_tangent = np.array([-COS_A, SIN_A * 0.5])
y_tangent /= np.linalg.norm(y_tangent)
y_perp = np.array([-y_tangent[1], y_tangent[0]])
tick_half_len = 0.22
y_tick_values = np.linspace(-5, 5, 5)
y_ticks = []
for v in y_tick_values:
    cx, cy = isometric_project(0, v, 0)
    p0 = (cx - y_perp[0] * tick_half_len, cy - y_perp[1] * tick_half_len)
    p1 = (cx + y_perp[0] * tick_half_len, cy + y_perp[1] * tick_half_len)
    y_ticks.append([p0, p1])

# Title fontsize scales with title length (default-style-guide.md "Title fontsize")
title = "wireframe-3d-basic · python · pygal · anyplot.ai"
title_font_size = round(66 * min(1.0, 67 / len(title)))

custom_style = Style(
    background=PAGE_BG,
    plot_background=PAGE_BG,
    foreground=INK,
    foreground_strong=INK,
    foreground_subtle=INK_MUTED,
    colors=(BRAND_FADE,) * (2 * grid_size) + (INK, INK, INK) + (INK,) * len(y_ticks),
    title_font_size=title_font_size,
    label_font_size=56,
    major_label_font_size=44,
    legend_font_size=44,
    value_font_size=36,
)

# Plot
chart = pygal.XY(
    style=custom_style,
    width=3200,
    height=1800,
    title=title,
    x_title="X Axis",
    y_title="Z Axis (projected)",
    show_legend=True,
)

for points in row_lines:
    chart.add(None, points, show_dots=False, stroke_style={"width": 1.6})
for points in col_lines:
    chart.add(None, points, show_dots=False, stroke_style={"width": 1.6})

chart.add("X axis", x_axis, show_dots=True, dots_size=6, stroke_style={"width": 4})
chart.add("Y axis", y_axis, show_dots=True, dots_size=6, stroke_style={"width": 4})
chart.add("Z axis", z_axis, show_dots=True, dots_size=6, stroke_style={"width": 4})

for points in y_ticks:
    chart.add(None, points, show_dots=False, stroke_style={"width": 3})

# Save
chart.render_to_png(f"plot-{THEME}.png")
with open(f"plot-{THEME}.html", "wb") as f:
    f.write(chart.render())
Runnable source as JSON, for any HTTP client: https://api.anyplot.ai/specs/wireframe-3d-basic/pygal/code. Any spec id and library id listed in llms-full.txt fit the same URL shape; every URL below is complete and callable.
{
  "spec_id": "wireframe-3d-basic",
  "language": "python",
  "library": "pygal",
  "page": "https://anyplot.ai/wireframe-3d-basic/python/pygal",
  "hub": "https://anyplot.ai/wireframe-3d-basic",
  "code_json": "https://api.anyplot.ai/specs/wireframe-3d-basic/pygal/code",
  "spec_json": "https://api.anyplot.ai/specs/wireframe-3d-basic",
  "render_light_png": "https://storage.googleapis.com/anyplot-images/plots/wireframe-3d-basic/python/pygal/plot-light.png",
  "render_dark_png": "https://storage.googleapis.com/anyplot-images/plots/wireframe-3d-basic/python/pygal/plot-dark.png",
  "interactive_light_html": "https://storage.googleapis.com/anyplot-images/plots/wireframe-3d-basic/python/pygal/plot-light.html",
  "interactive_dark_html": "https://storage.googleapis.com/anyplot-images/plots/wireframe-3d-basic/python/pygal/plot-dark.html",
  "quality_score": 81.0,
  "license": "MIT",
  "guide": "https://anyplot.ai/llms.txt"
}
Part of Basic 3D Wireframe Plot on anyplot.ai.