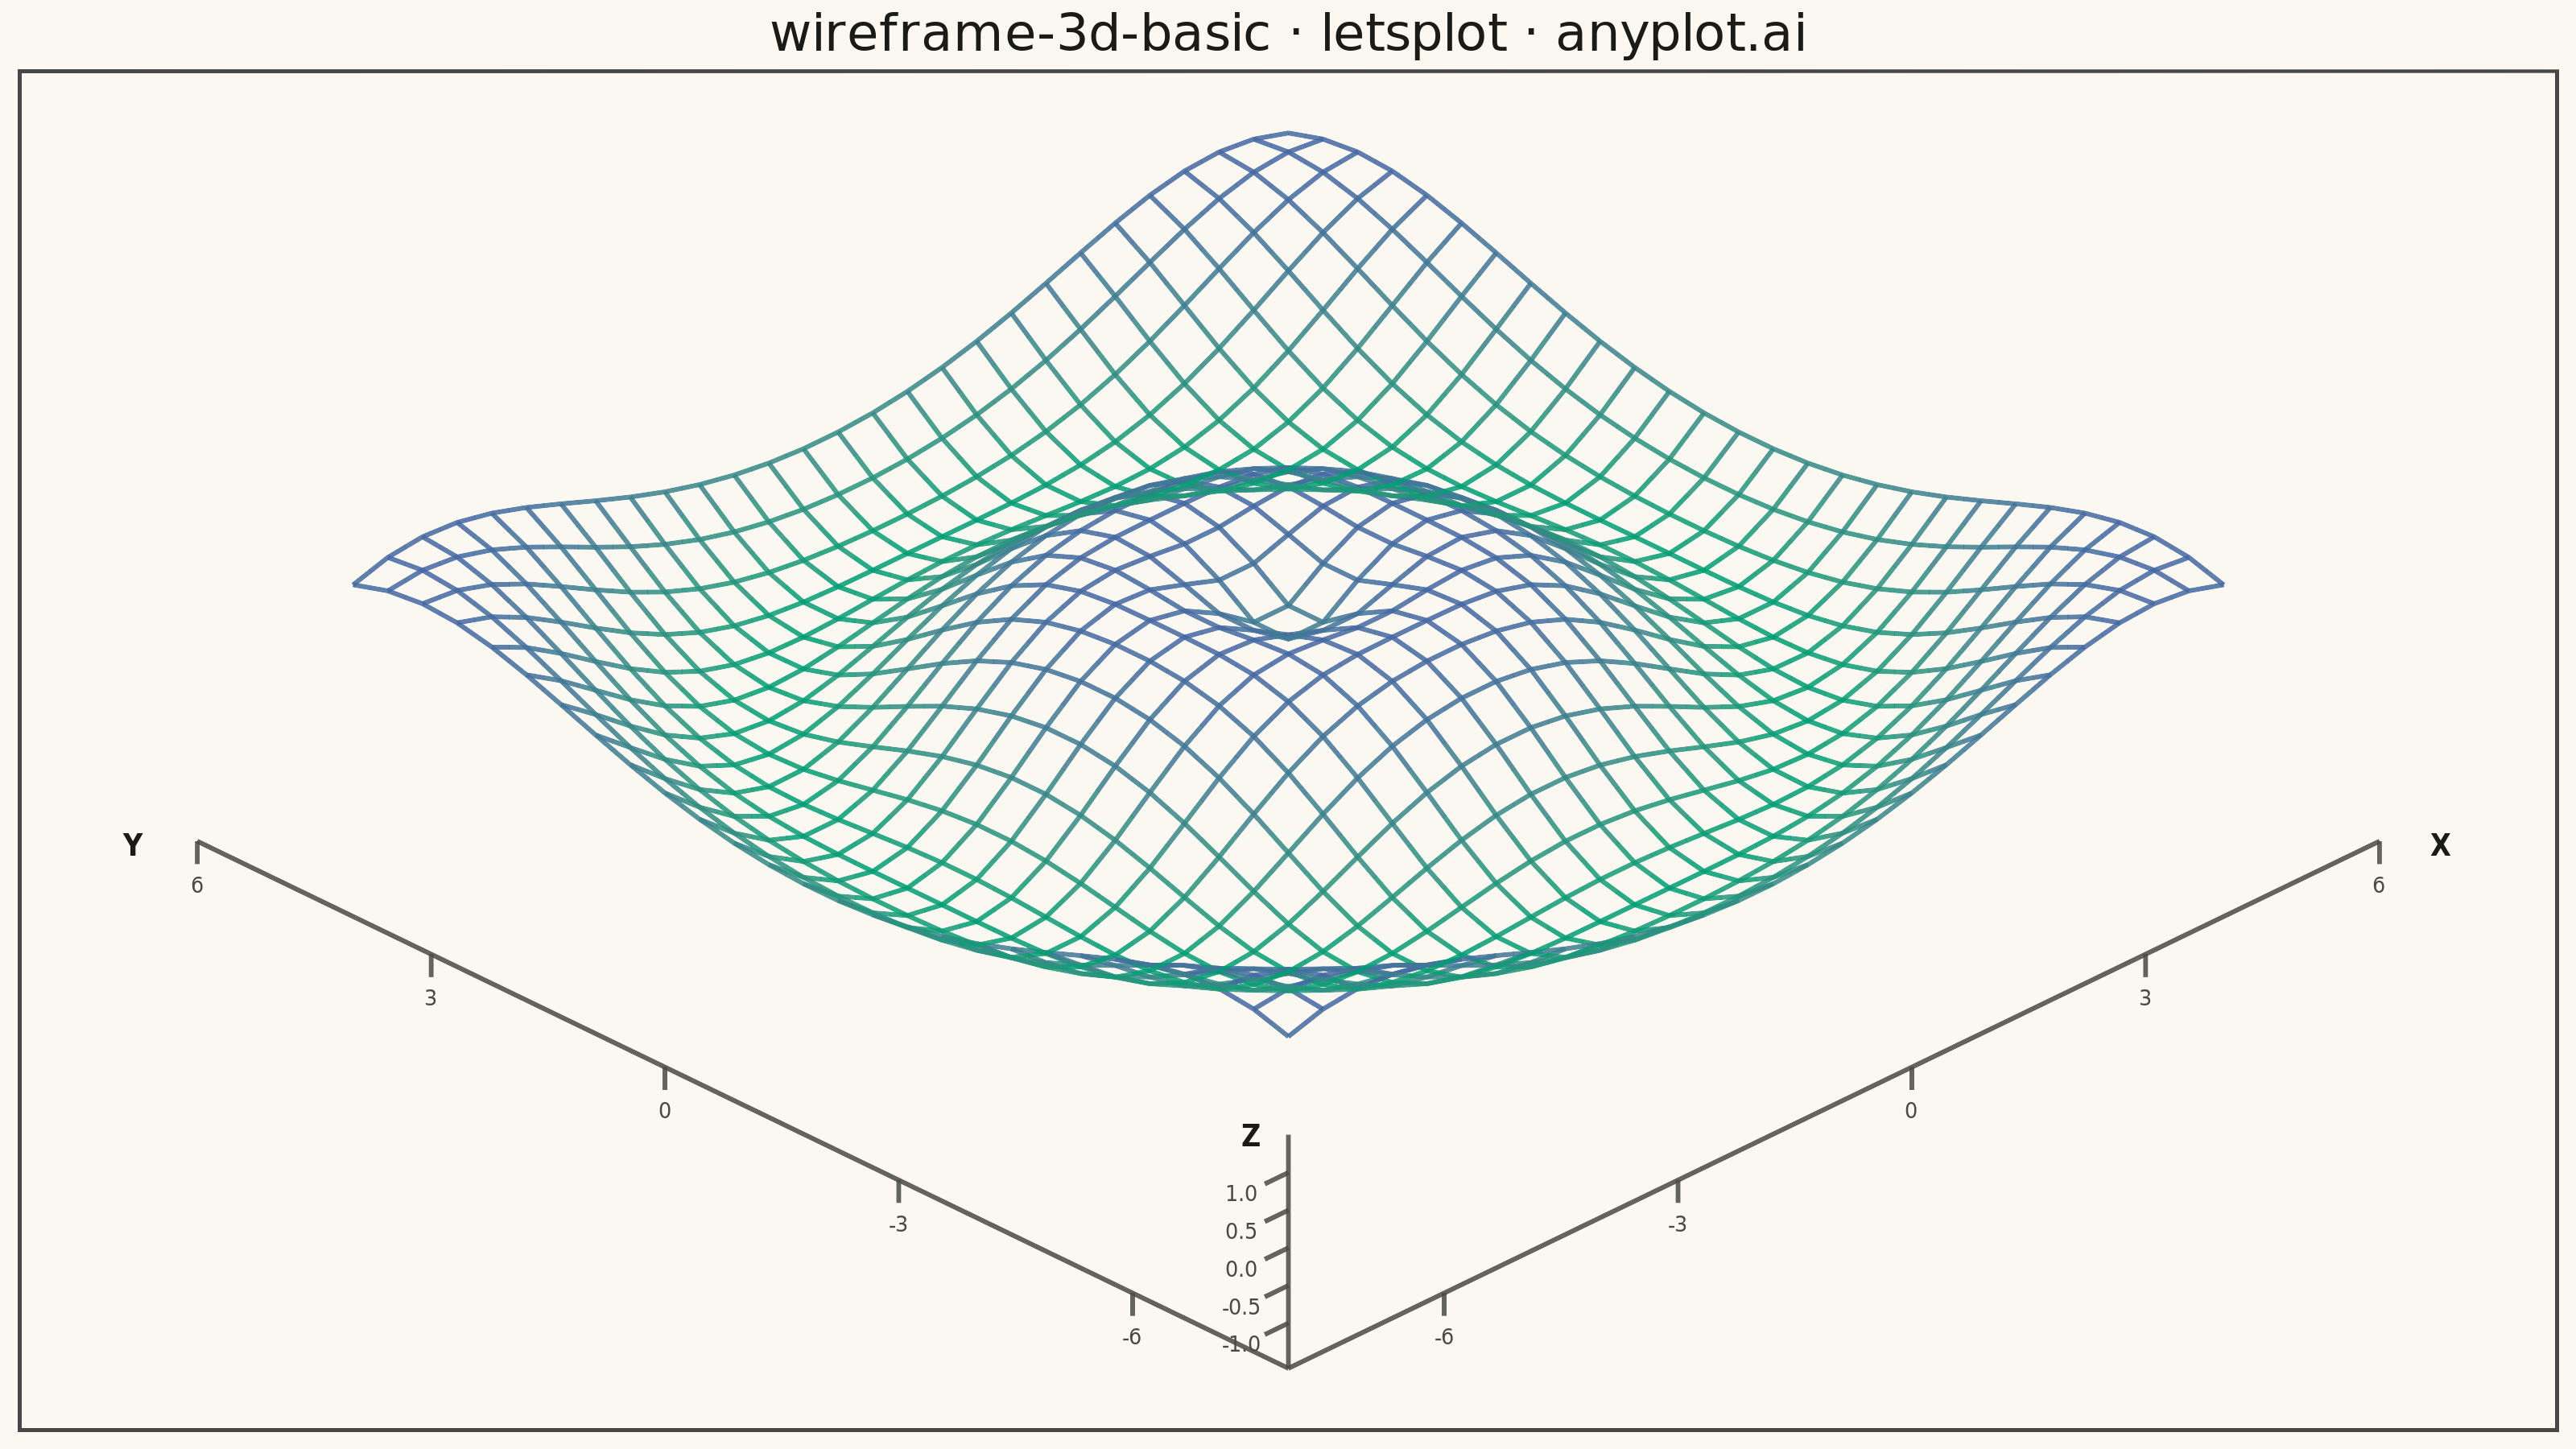
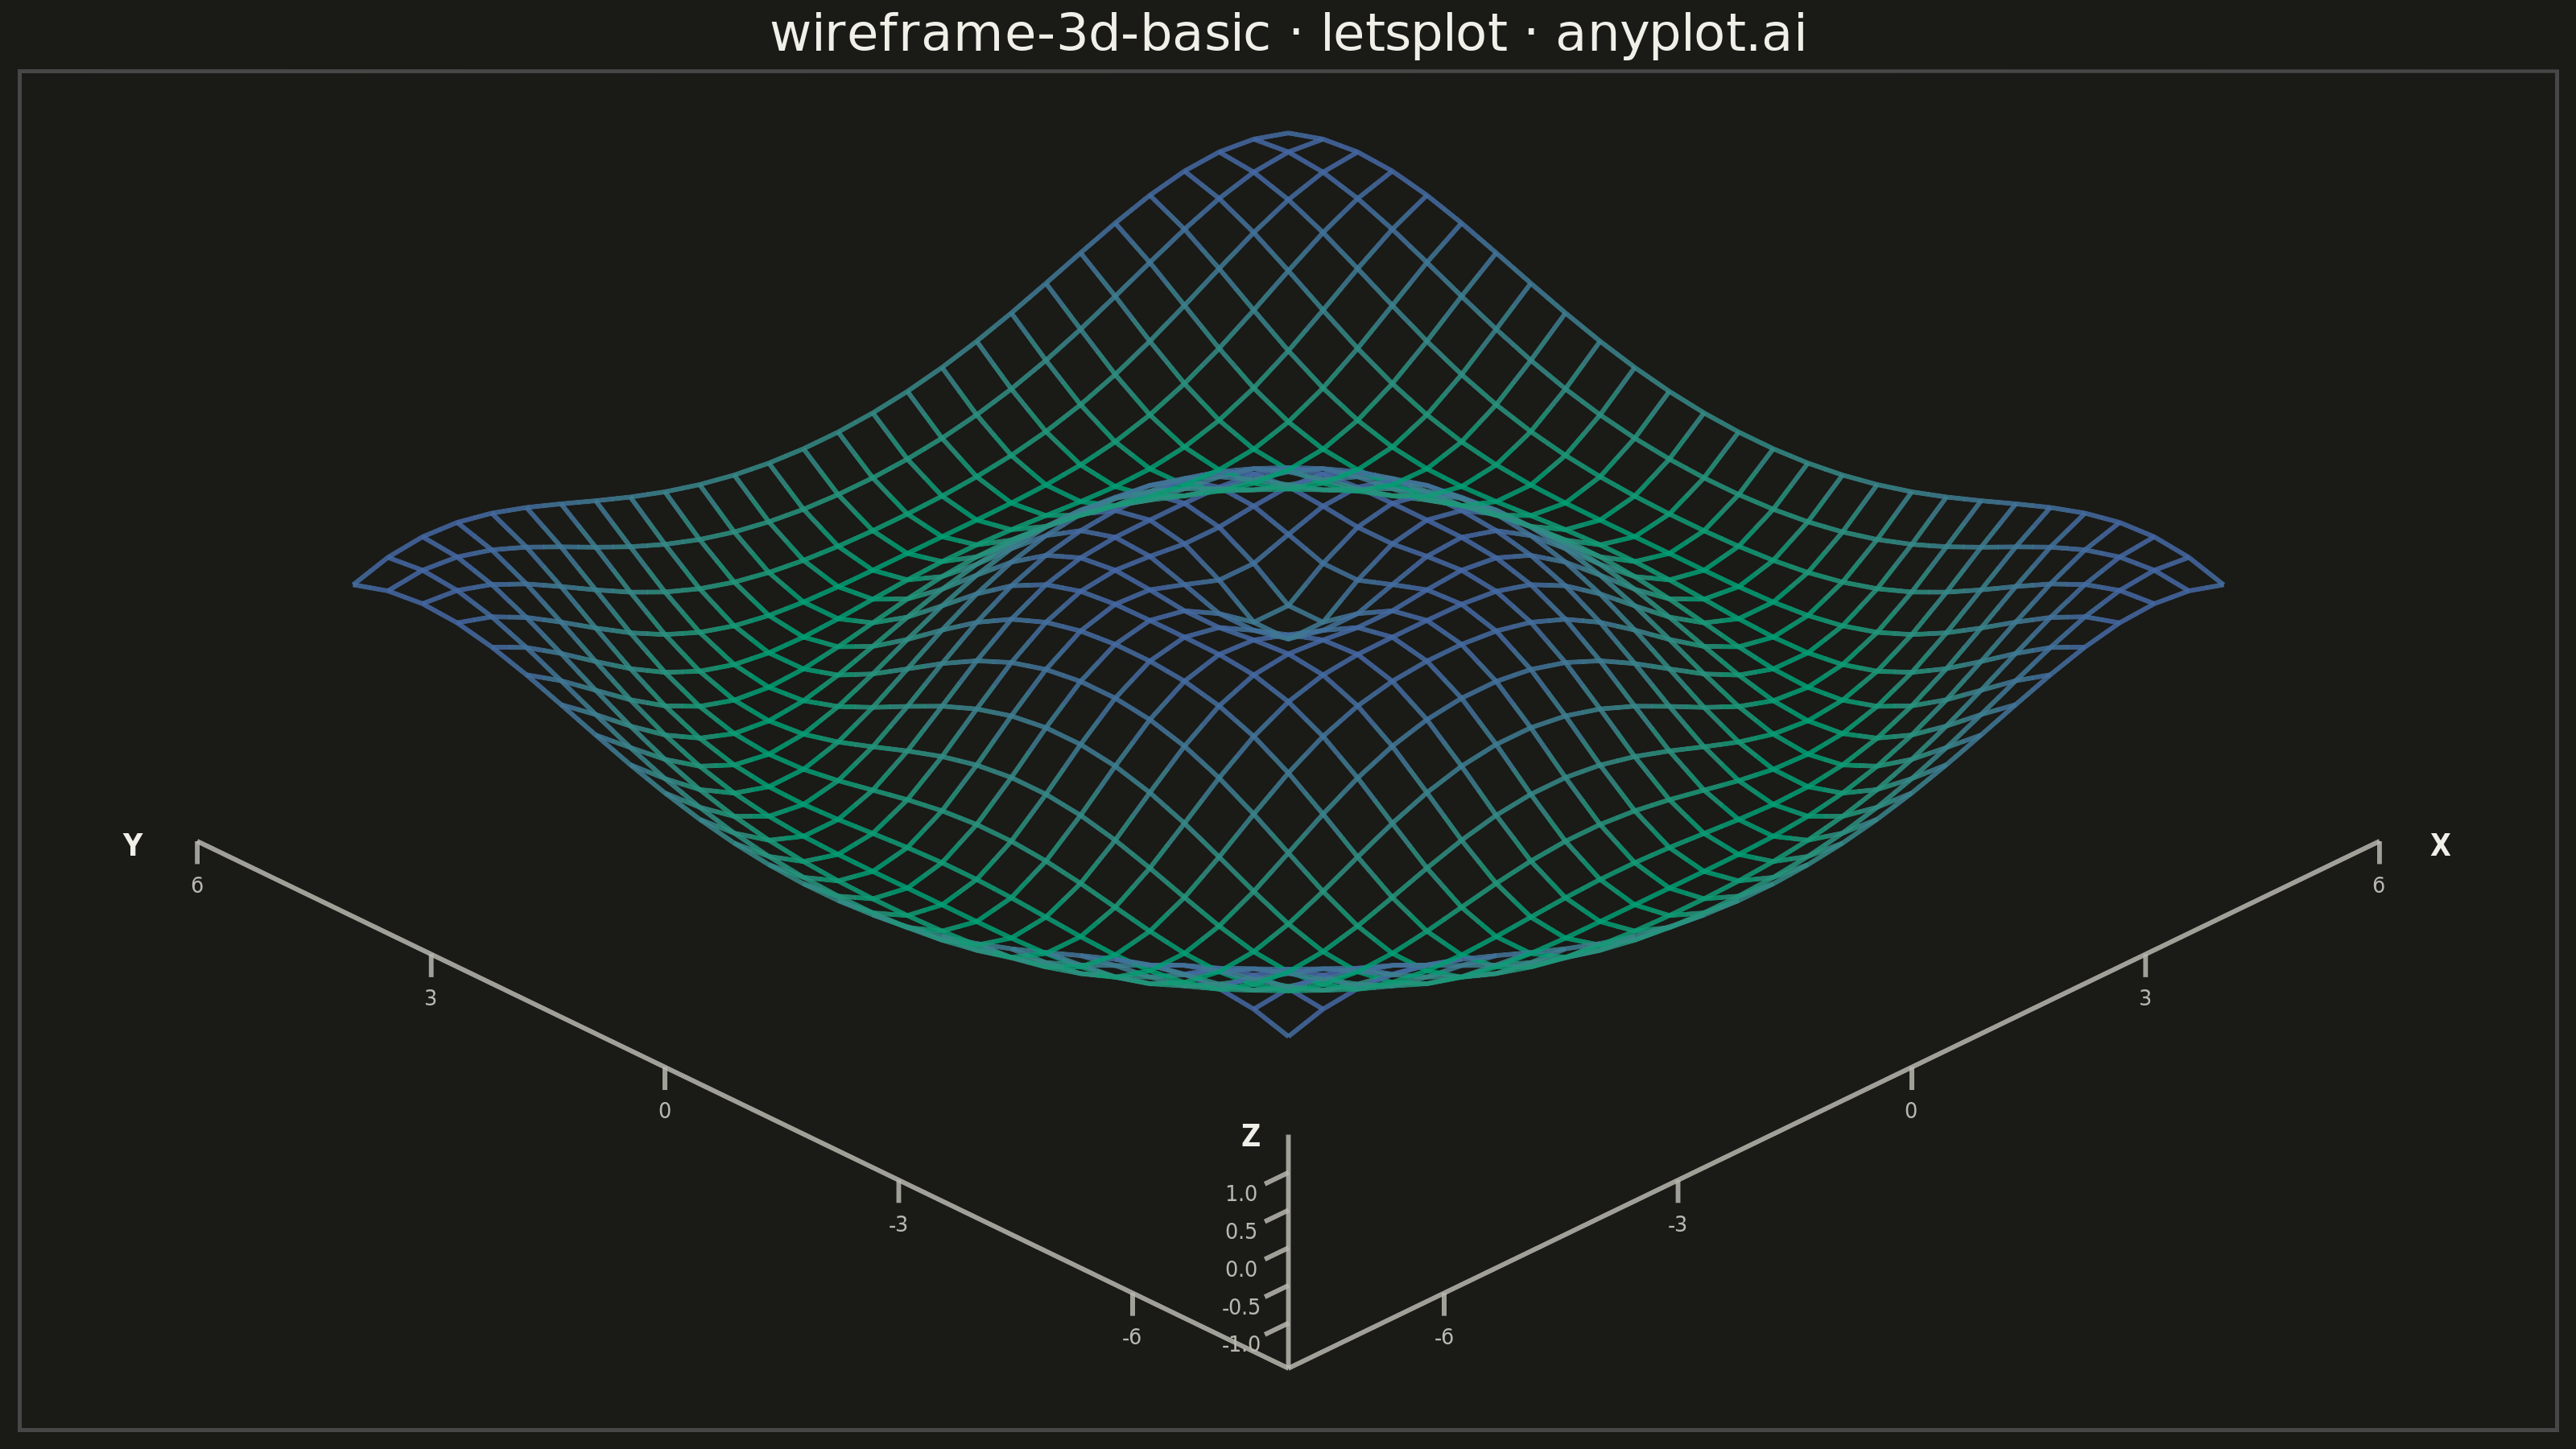
A 3D wireframe plot displays a mathematical surface as a mesh of lines connecting grid points in three-dimensional space. Unlike solid surface plots, wireframes render only the edges between grid points, creating a see-through visualization that reveals the underlying structure and allows viewing parts of the surface that would otherwise be hidden. This makes wireframes ideal for understanding the topology and shape of 3D functions.
""" anyplot.ai
wireframe-3d-basic: Basic 3D Wireframe Plot
Library: letsplot 4.11.0 | Python 3.13.14
Quality: 87/100 | Updated: 2026-08-04
"""

import os
import shutil

import numpy as np
import pandas as pd
from lets_plot import *


# Theme tokens
THEME = os.getenv("ANYPLOT_THEME", "light")
PAGE_BG = "#FAF8F1" if THEME == "light" else "#1A1A17"
INK = "#1A1A17" if THEME == "light" else "#F0EFE8"
INK_SOFT = "#4A4A44" if THEME == "light" else "#B8B7B0"

# First series color
BRAND = "#009E73"

# Generate 3D surface data (ripple function)
x = np.linspace(-6, 6, 28)
y = np.linspace(-6, 6, 28)
X, Y = np.meshgrid(x, y)
Z = np.sin(np.sqrt(X**2 + Y**2))

X_MIN, X_MAX = float(x.min()), float(x.max())
Y_MIN, Y_MAX = float(y.min()), float(y.max())
Z_MIN, Z_MAX = float(Z.min()), float(Z.max())
FLOOR = Z_MIN - 0.6  # reference plane below the surface, for the axis frame
TICK = 0.3
# Pull the axis-frame corner outward from the data extent so the frame reads
# as a detached reference box instead of colliding with the mesh's own front vertex
AXIS_X = X_MIN - 2.0
AXIS_Y = Y_MIN - 2.0


# Isometric projection from 3D to 2D
def isometric_project(x_3d, y_3d, z_3d):
    x_iso = x_3d - y_3d
    y_iso = (x_3d + y_3d) * 0.5 + z_3d
    return x_iso, y_iso


# Wireframe mesh, colored by height so elevation reads as a second visual cue
mesh = []

# X-direction lines (constant y index)
for j in range(X.shape[1]):
    x_2d, y_2d = isometric_project(X[:, j], Y[:, j], Z[:, j])
    for i in range(len(x_2d)):
        mesh.append({"x": x_2d[i], "y": y_2d[i], "z": Z[i, j], "line": f"x_{j}", "order": i})

# Y-direction lines (constant x index)
for i in range(X.shape[0]):
    x_2d, y_2d = isometric_project(X[i, :], Y[i, :], Z[i, :])
    for j in range(len(x_2d)):
        mesh.append({"x": x_2d[j], "y": y_2d[j], "z": Z[i, j], "line": f"y_{i}", "order": j})

mesh_df = pd.DataFrame(mesh)

# Axis frame: X/Y ground-plane edges plus a Z ladder, all drawn in the same
# isometric-projected space as the mesh (lets-plot has no native 3D axes)
axis_segs = []


def seg3(p0, p1):
    a = isometric_project(*p0)
    b = isometric_project(*p1)
    axis_segs.append({"x": a[0], "y": a[1], "xend": b[0], "yend": b[1]})


seg3((AXIS_X, AXIS_Y, FLOOR), (X_MAX, AXIS_Y, FLOOR))  # X-axis line
seg3((AXIS_X, AXIS_Y, FLOOR), (AXIS_X, Y_MAX, FLOOR))  # Y-axis line
seg3((AXIS_X, AXIS_Y, FLOOR), (AXIS_X, AXIS_Y, Z_MAX + 0.5))  # Z-axis line

X_TICKS = np.linspace(X_MIN, X_MAX, 5)
Y_TICKS = np.linspace(Y_MIN, Y_MAX, 5)
Z_TICKS = np.linspace(Z_MIN, Z_MAX, 5)

for xv in X_TICKS:
    seg3((xv, AXIS_Y, FLOOR), (xv, AXIS_Y, FLOOR - TICK))
for yv in Y_TICKS:
    seg3((AXIS_X, yv, FLOOR), (AXIS_X, yv, FLOOR - TICK))
for zv in Z_TICKS:
    seg3((AXIS_X, AXIS_Y, zv), (AXIS_X - TICK, AXIS_Y, zv))

axis_df = pd.DataFrame(axis_segs)

# Tick labels
tick_labels = []
for xv in X_TICKS:
    lx, ly = isometric_project(xv, AXIS_Y, FLOOR - TICK * 2)
    tick_labels.append({"x": lx, "y": ly, "label": f"{xv:.0f}"})
for yv in Y_TICKS:
    lx, ly = isometric_project(AXIS_X, yv, FLOOR - TICK * 2)
    tick_labels.append({"x": lx, "y": ly, "label": f"{yv:.0f}"})
for zv in Z_TICKS:
    lx, ly = isometric_project(AXIS_X - TICK * 2, AXIS_Y, zv)
    tick_labels.append({"x": lx, "y": ly, "label": f"{zv:.1f}"})
tick_label_df = pd.DataFrame(tick_labels)

# Axis titles (X / Y / Z), placed just past the last tick on each axis
ax_x, ax_y = isometric_project(X_MAX + 0.8, AXIS_Y, FLOOR - TICK * 1.6)
ay_x, ay_y = isometric_project(AXIS_X, Y_MAX + 0.8, FLOOR - TICK * 1.6)
az_x, az_y = isometric_project(AXIS_X - TICK * 1.6, AXIS_Y, Z_MAX + 0.7)
axis_title_df = pd.DataFrame(
    [{"x": ax_x, "y": ax_y, "label": "X"}, {"x": ay_x, "y": ay_y, "label": "Y"}, {"x": az_x, "y": az_y, "label": "Z"}]
)

# Create plot with wireframe lines, colored by height, plus a minimal axis frame
plot = (
    ggplot()
    + geom_path(aes(x="x", y="y", group="line", color="z"), data=mesh_df, size=0.6, alpha=0.85)
    + scale_color_gradient(low=BRAND, high="#4467A3", guide="none")
    + geom_segment(aes(x="x", y="y", xend="xend", yend="yend"), data=axis_df, color=INK_SOFT, size=0.6, alpha=0.85)
    + geom_text(aes(x="x", y="y", label="label"), data=tick_label_df, color=INK_SOFT, size=3.2)
    + geom_text(aes(x="x", y="y", label="label"), data=axis_title_df, color=INK, size=4.2, fontface="bold")
    + ggsize(800, 450)
    + theme_void()
    + theme(
        plot_background=element_rect(fill=PAGE_BG, color=PAGE_BG),
        panel_background=element_rect(fill=PAGE_BG),
        plot_title=element_text(size=16, color=INK, hjust=0.5),
    )
    + labs(title="wireframe-3d-basic · letsplot · anyplot.ai")
)

# Setup and save
LetsPlot.setup_html()

ggsave(plot, f"plot-{THEME}.png", scale=4)
ggsave(plot, f"plot-{THEME}.html")

# Move files from lets-plot-images to current directory
for ext in ["png", "html"]:
    src = f"lets-plot-images/plot-{THEME}.{ext}"
    dst = f"plot-{THEME}.{ext}"
    if os.path.exists(src):
        shutil.move(src, dst)
Runnable source as JSON, for any HTTP client: https://api.anyplot.ai/specs/wireframe-3d-basic/letsplot/code. Any spec id and library id listed in llms-full.txt fit the same URL shape; every URL below is complete and callable.
{
  "spec_id": "wireframe-3d-basic",
  "language": "python",
  "library": "letsplot",
  "page": "https://anyplot.ai/wireframe-3d-basic/python/letsplot",
  "hub": "https://anyplot.ai/wireframe-3d-basic",
  "code_json": "https://api.anyplot.ai/specs/wireframe-3d-basic/letsplot/code",
  "spec_json": "https://api.anyplot.ai/specs/wireframe-3d-basic",
  "render_light_png": "https://storage.googleapis.com/anyplot-images/plots/wireframe-3d-basic/python/letsplot/plot-light.png",
  "render_dark_png": "https://storage.googleapis.com/anyplot-images/plots/wireframe-3d-basic/python/letsplot/plot-dark.png",
  "interactive_light_html": "https://storage.googleapis.com/anyplot-images/plots/wireframe-3d-basic/python/letsplot/plot-light.html",
  "interactive_dark_html": "https://storage.googleapis.com/anyplot-images/plots/wireframe-3d-basic/python/letsplot/plot-dark.html",
  "quality_score": 87.0,
  "license": "MIT",
  "guide": "https://anyplot.ai/llms.txt"
}
Part of Basic 3D Wireframe Plot on anyplot.ai.