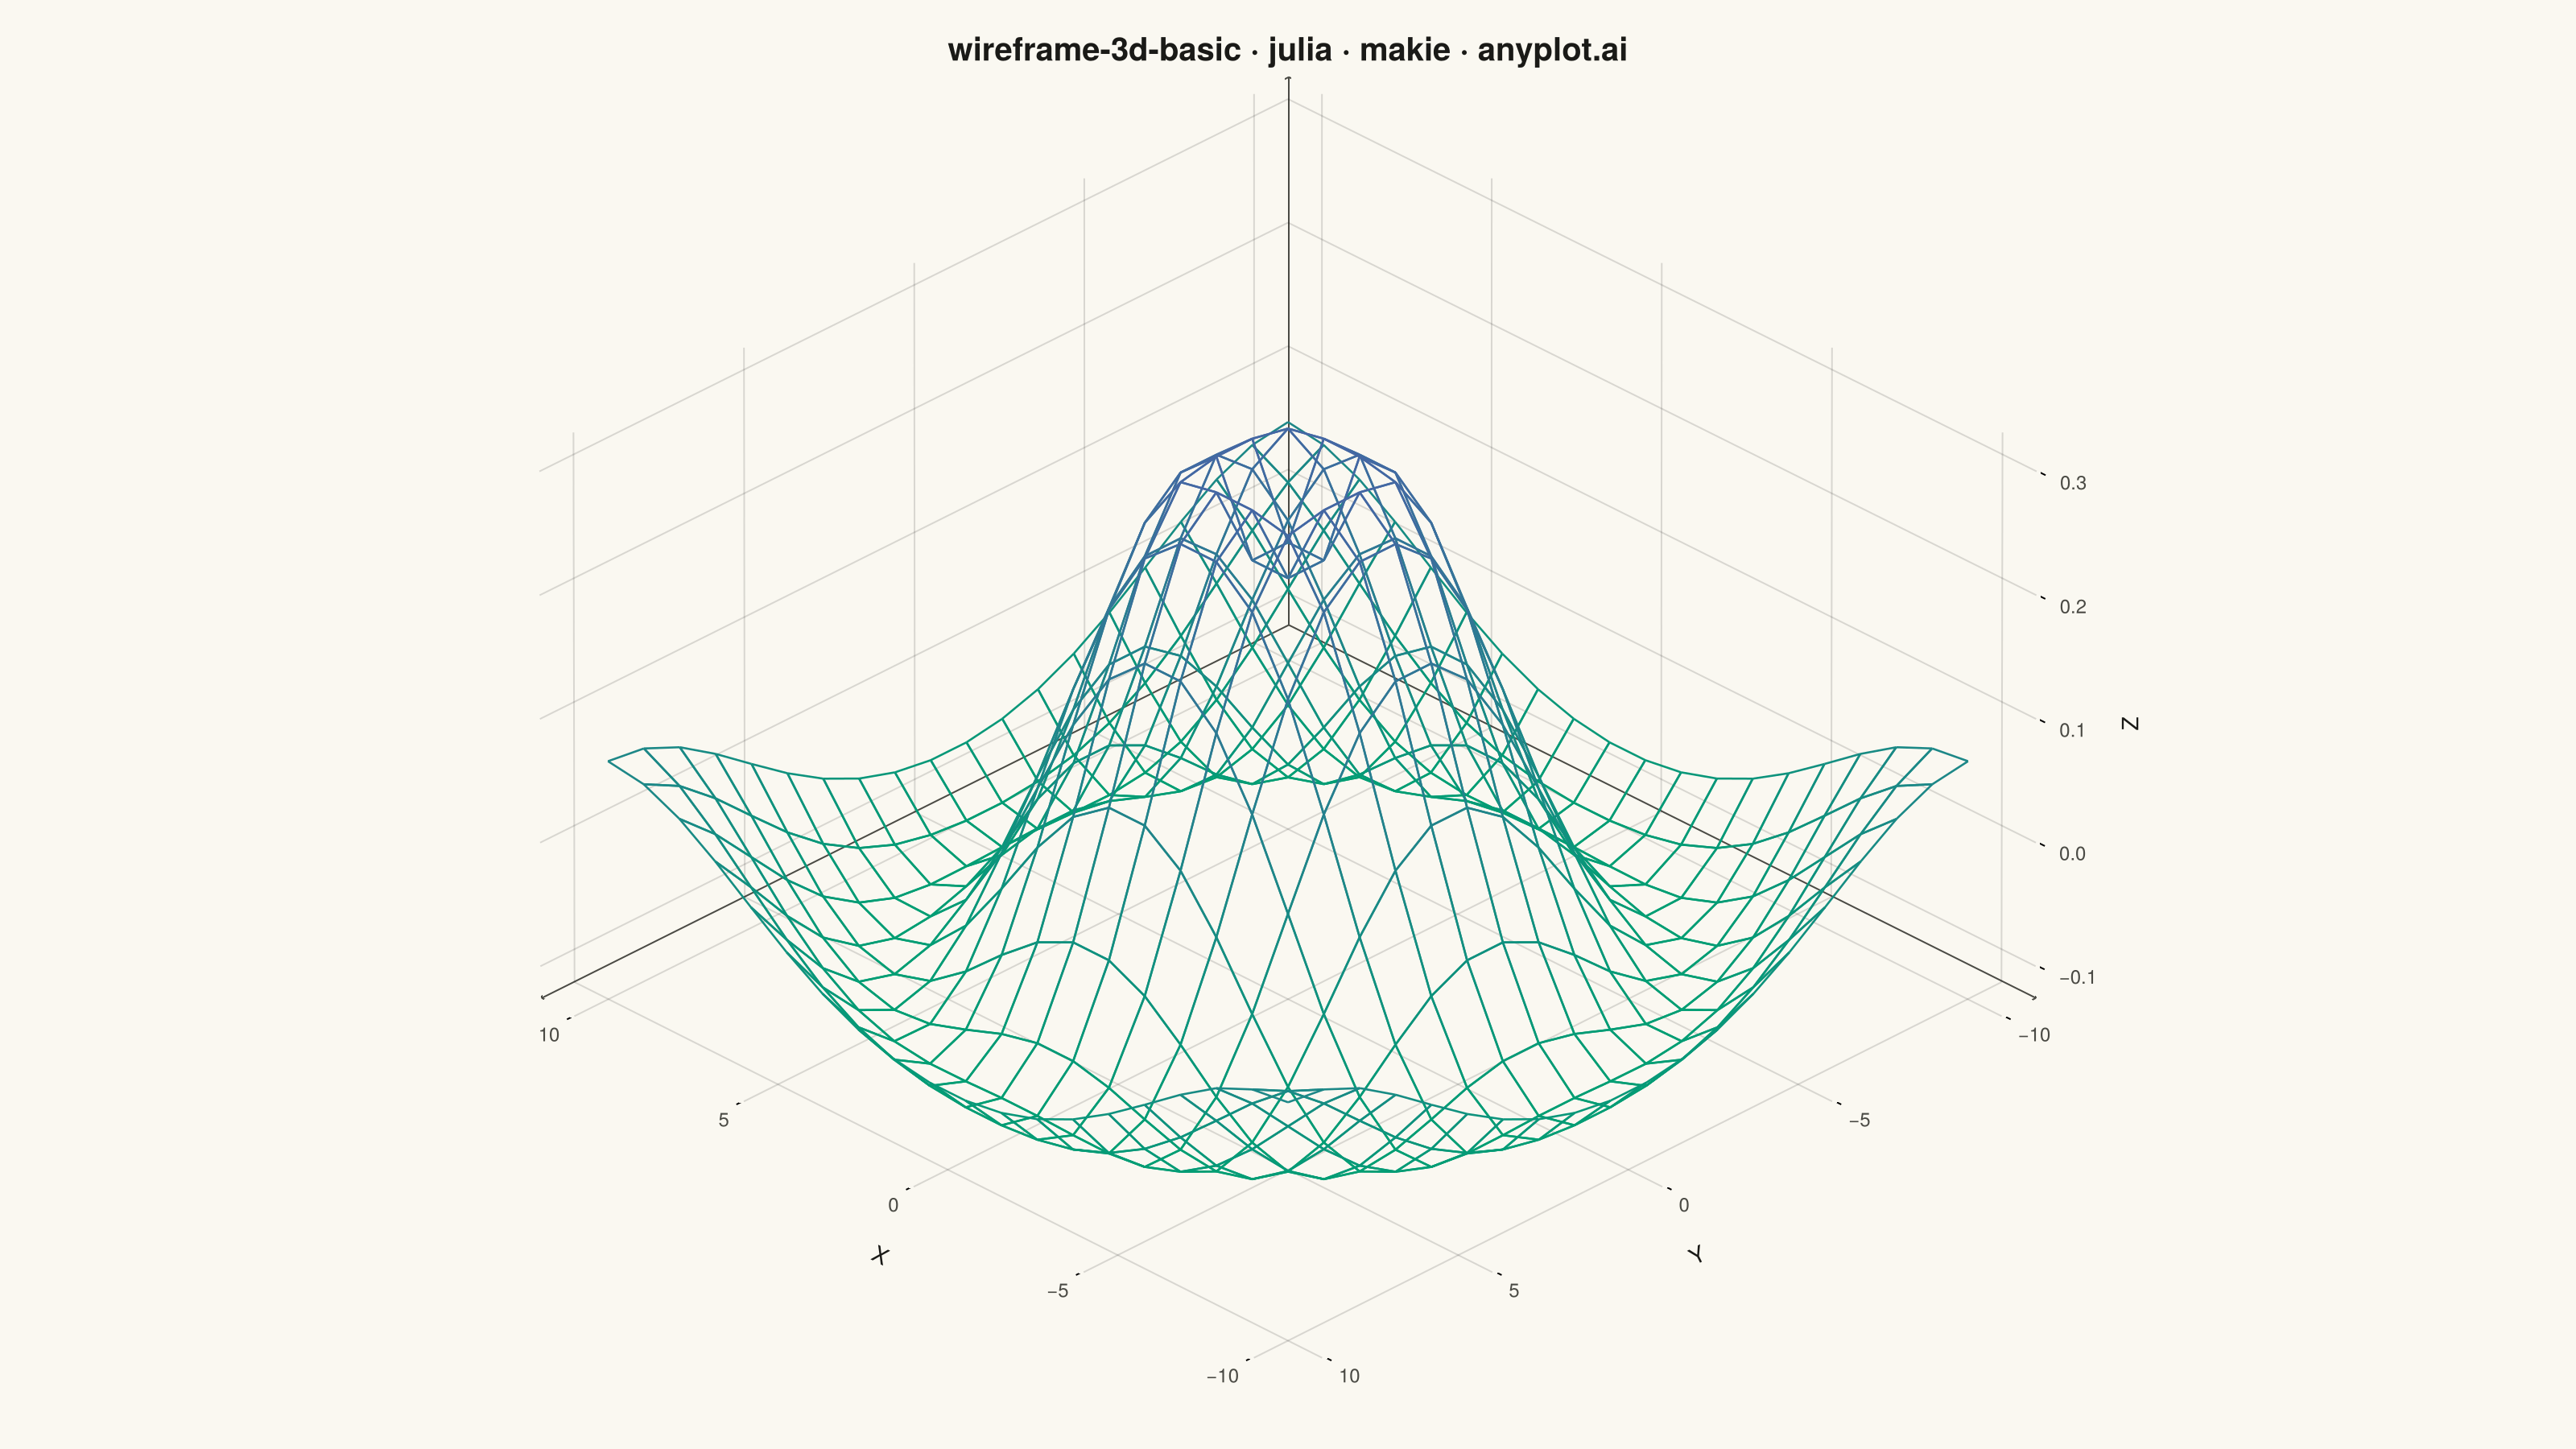
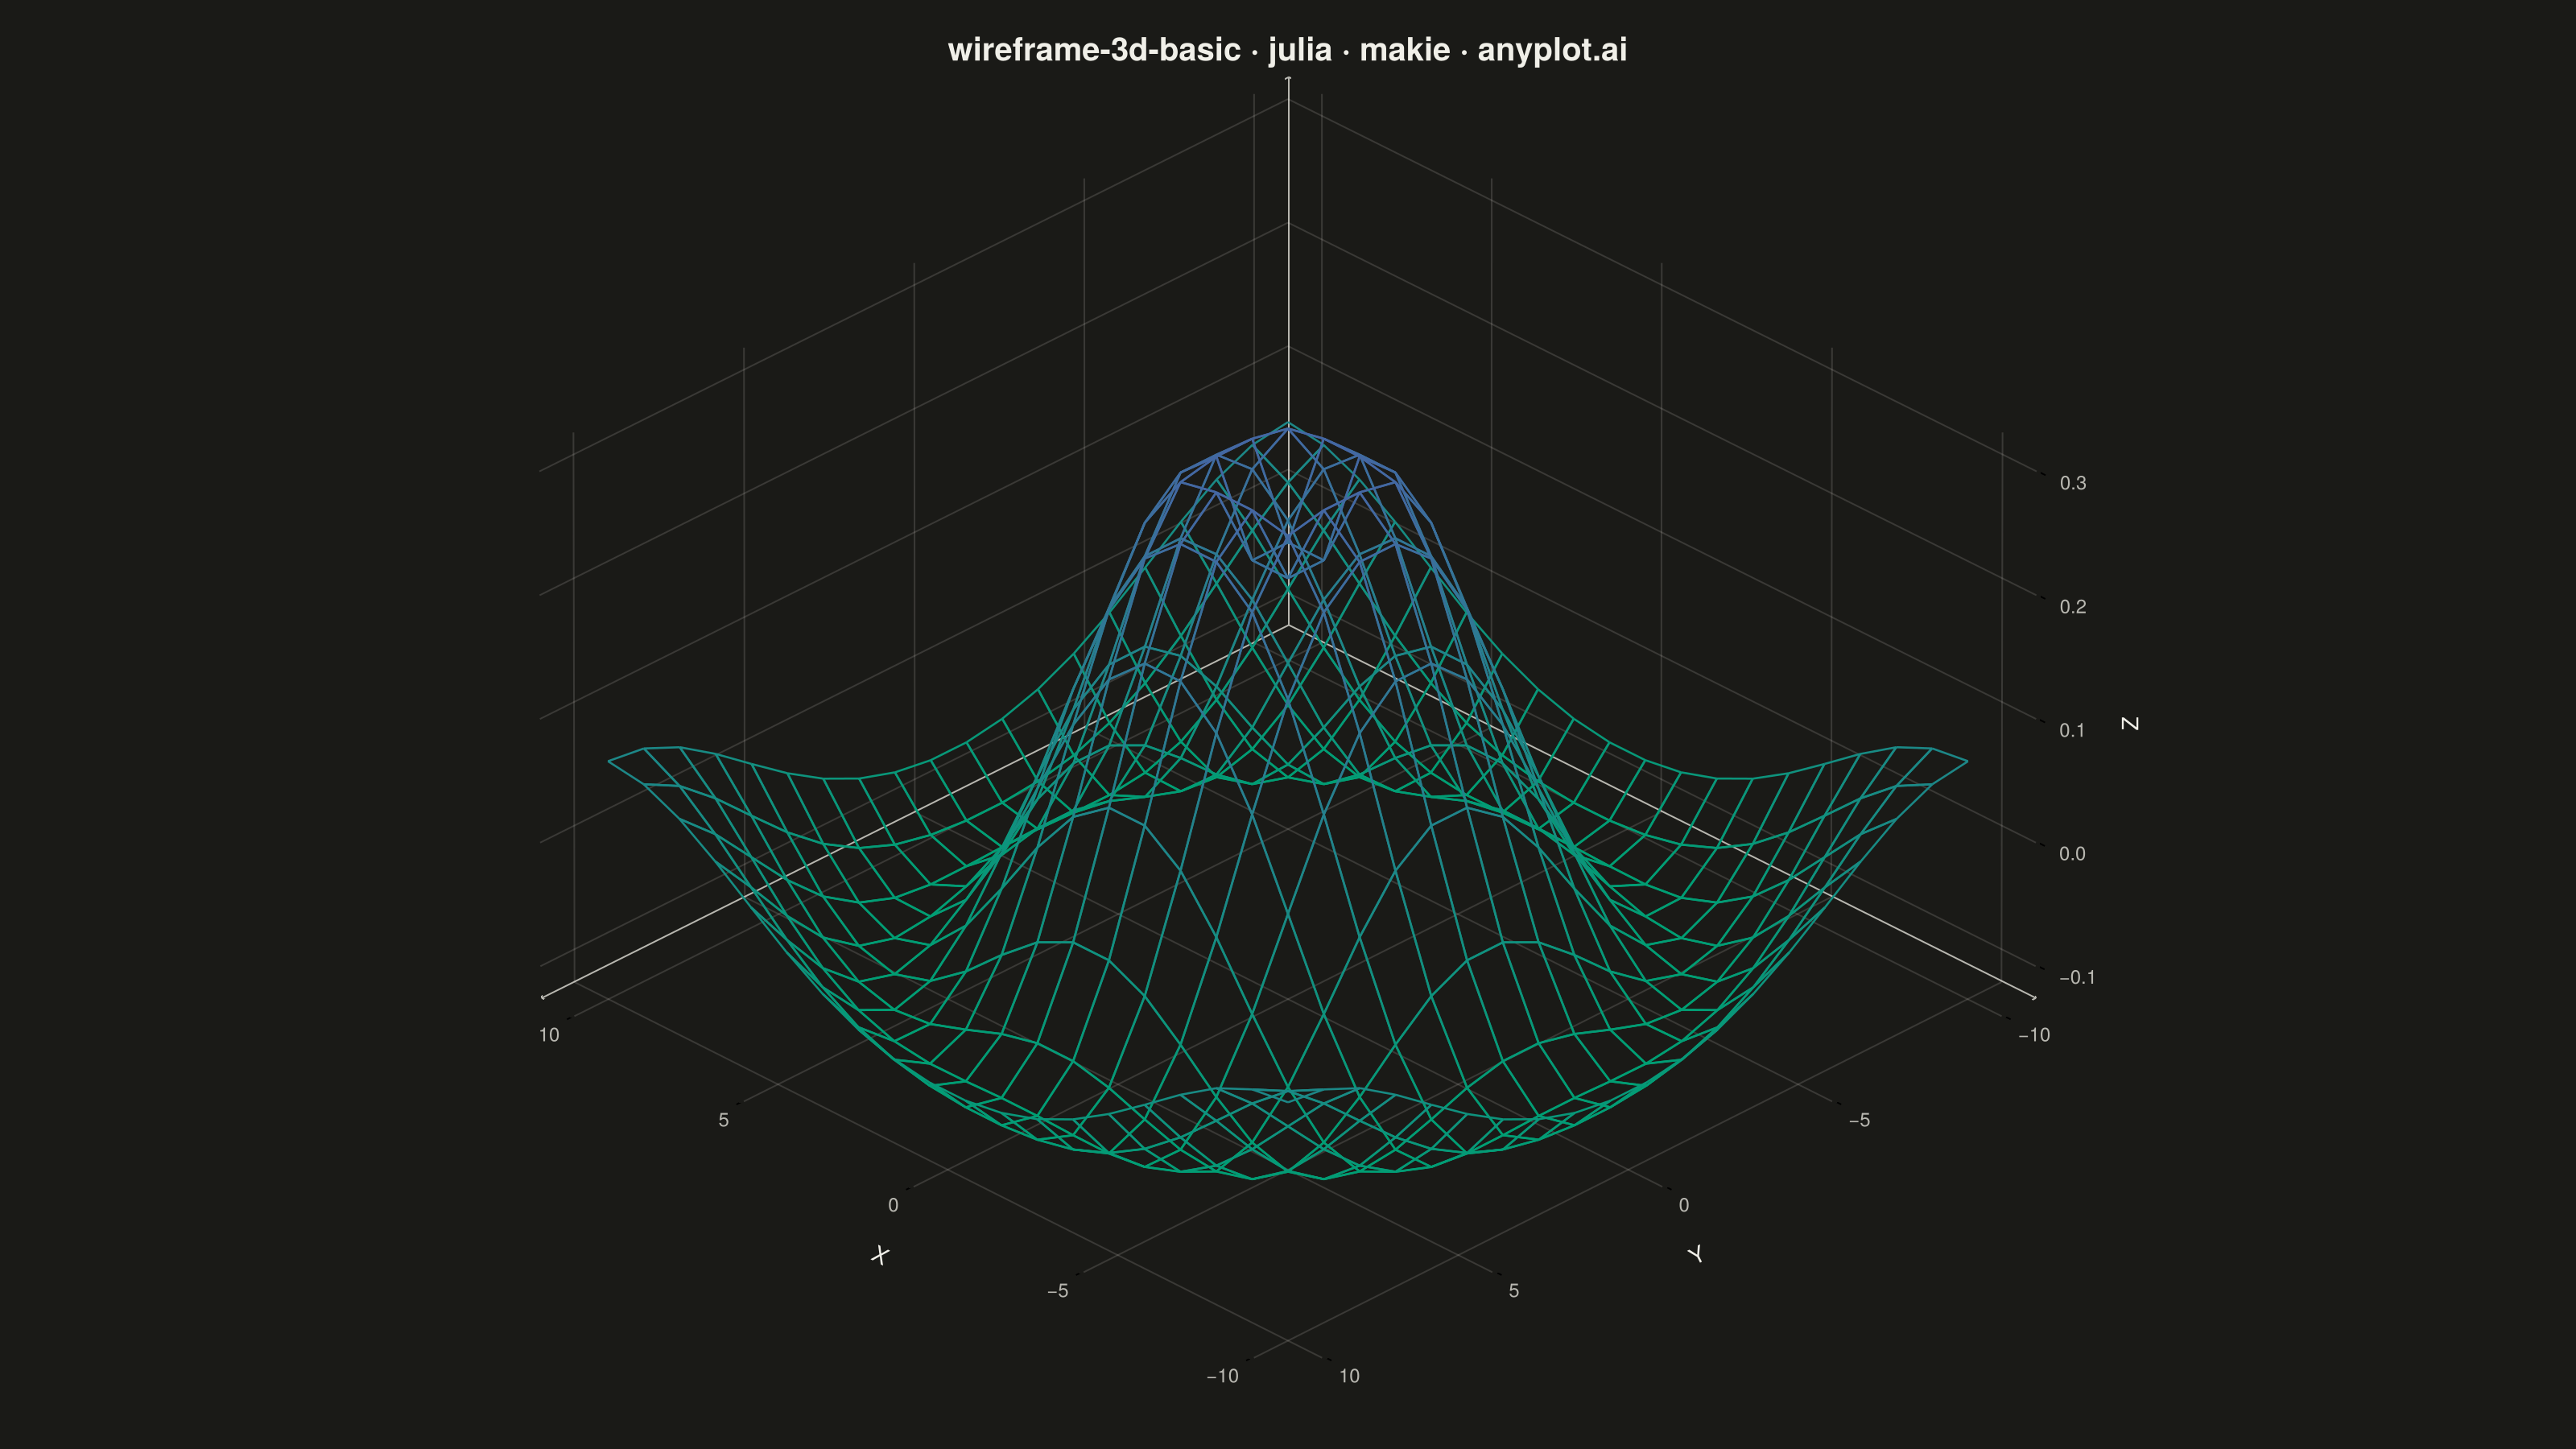
A 3D wireframe plot displays a mathematical surface as a mesh of lines connecting grid points in three-dimensional space. Unlike solid surface plots, wireframes render only the edges between grid points, creating a see-through visualization that reveals the underlying structure and allows viewing parts of the surface that would otherwise be hidden. This makes wireframes ideal for understanding the topology and shape of 3D functions.
# anyplot.ai
# wireframe-3d-basic: Basic 3D Wireframe Plot
# Library: makie 0.21.9 | Julia 1.11.9
# Quality: 85/100 | Created: 2026-08-04

using CairoMakie
using Colors

# --- Theme tokens -----------------------------------------------------------
const THEME    = get(ENV, "ANYPLOT_THEME", "light")
const PAGE_BG  = THEME == "light" ? colorant"#FAF8F1" : colorant"#1A1A17"
const INK      = THEME == "light" ? colorant"#1A1A17" : colorant"#F0EFE8"
const INK_SOFT = THEME == "light" ? colorant"#4A4A44" : colorant"#B8B7B0"
const ANYPLOT_SEQ = cgrad([colorant"#009E73", colorant"#4467A3"])  # sequential, height-encoded

# --- Data ---------------------------------------------------------------
# Ripple function z = sin(0.55 * r) / (r + 1) evaluated on a 20x20 grid.
# The damped oscillation (~1.1 periods across the domain, vs. ~2.2 previously)
# and coarser grid keep the mesh see-through instead of cluttered near the peak.
grid_points = range(-10, 10; length = 20)
x = collect(grid_points)
y = collect(grid_points)
radius = [sqrt(xi^2 + yi^2) for xi in x, yi in y]
z = sin.(0.55 .* radius) ./ (radius .+ 1)

# --- Plot -----------------------------------------------------------------
title_text = "wireframe-3d-basic · julia · makie · anyplot.ai"
title_fontsize = round(Int, 20 * min(1.0, 67 / length(title_text)))

fig = Figure(
    resolution      = (1600, 900),
    fontsize        = 14,
    backgroundcolor = PAGE_BG,
)

ax = Axis3(
    fig[1, 1];
    title             = title_text,
    titlesize         = title_fontsize,
    titlecolor        = INK,
    xlabel            = "X",
    ylabel            = "Y",
    zlabel            = "Z",
    xlabelsize        = 14,
    ylabelsize        = 14,
    zlabelsize        = 14,
    xticklabelsize    = 12,
    yticklabelsize    = 12,
    zticklabelsize    = 12,
    xlabelcolor       = INK,
    ylabelcolor       = INK,
    zlabelcolor       = INK,
    xticklabelcolor   = INK_SOFT,
    yticklabelcolor   = INK_SOFT,
    zticklabelcolor   = INK_SOFT,
    xgridcolor        = RGBAf(INK.r, INK.g, INK.b, 0.15),
    ygridcolor        = RGBAf(INK.r, INK.g, INK.b, 0.15),
    zgridcolor        = RGBAf(INK.r, INK.g, INK.b, 0.15),
    xspinecolor_1     = INK_SOFT,
    yspinecolor_1     = INK_SOFT,
    zspinecolor_1     = INK_SOFT,
    xspinecolor_2     = INK_SOFT,
    yspinecolor_2     = INK_SOFT,
    zspinecolor_2     = INK_SOFT,
    xspinecolor_3     = INK_SOFT,
    yspinecolor_3     = INK_SOFT,
    zspinecolor_3     = INK_SOFT,
    xypanelcolor      = PAGE_BG,
    xzpanelcolor      = PAGE_BG,
    yzpanelcolor      = PAGE_BG,
    azimuth           = deg2rad(45 + 90),
    elevation         = deg2rad(30),
    aspect            = (1, 1, 0.6),
)

# Height-based line coloring (brand green -> blue via ANYPLOT_SEQ) so each
# wireframe segment is colored by the endpoints' z-height, giving the mesh a
# depth cue instead of a single flat line color.
grid_m, grid_n = size(z)
line_faces = Makie.decompose(
    Makie.LineFace{Makie.GLIndex}, Makie.Tesselation(Makie.Rect2(0, 0, 1, 1), (grid_m, grid_n))
)
z_per_vertex = vec(z)
segment_colors = Float64[]
for face in line_faces
    push!(segment_colors, z_per_vertex[face[1]])
    push!(segment_colors, z_per_vertex[face[2]])
end

wireframe!(
    ax, x, y, z;
    color = segment_colors, colormap = ANYPLOT_SEQ, colorrange = extrema(z), linewidth = 1.3,
)

# --- Save -------------------------------------------------------------------
save("plot-$(THEME).png", fig; px_per_unit = 2)
Runnable source as JSON, for any HTTP client: https://api.anyplot.ai/specs/wireframe-3d-basic/makie/code. Any spec id and library id listed in llms-full.txt fit the same URL shape; every URL below is complete and callable.
{
  "spec_id": "wireframe-3d-basic",
  "language": "julia",
  "library": "makie",
  "page": "https://anyplot.ai/wireframe-3d-basic/julia/makie",
  "hub": "https://anyplot.ai/wireframe-3d-basic",
  "code_json": "https://api.anyplot.ai/specs/wireframe-3d-basic/makie/code",
  "spec_json": "https://api.anyplot.ai/specs/wireframe-3d-basic",
  "render_light_png": "https://storage.googleapis.com/anyplot-images/plots/wireframe-3d-basic/julia/makie/plot-light.png",
  "render_dark_png": "https://storage.googleapis.com/anyplot-images/plots/wireframe-3d-basic/julia/makie/plot-dark.png",
  "quality_score": 85.0,
  "license": "MIT",
  "guide": "https://anyplot.ai/llms.txt"
}
Part of Basic 3D Wireframe Plot on anyplot.ai.