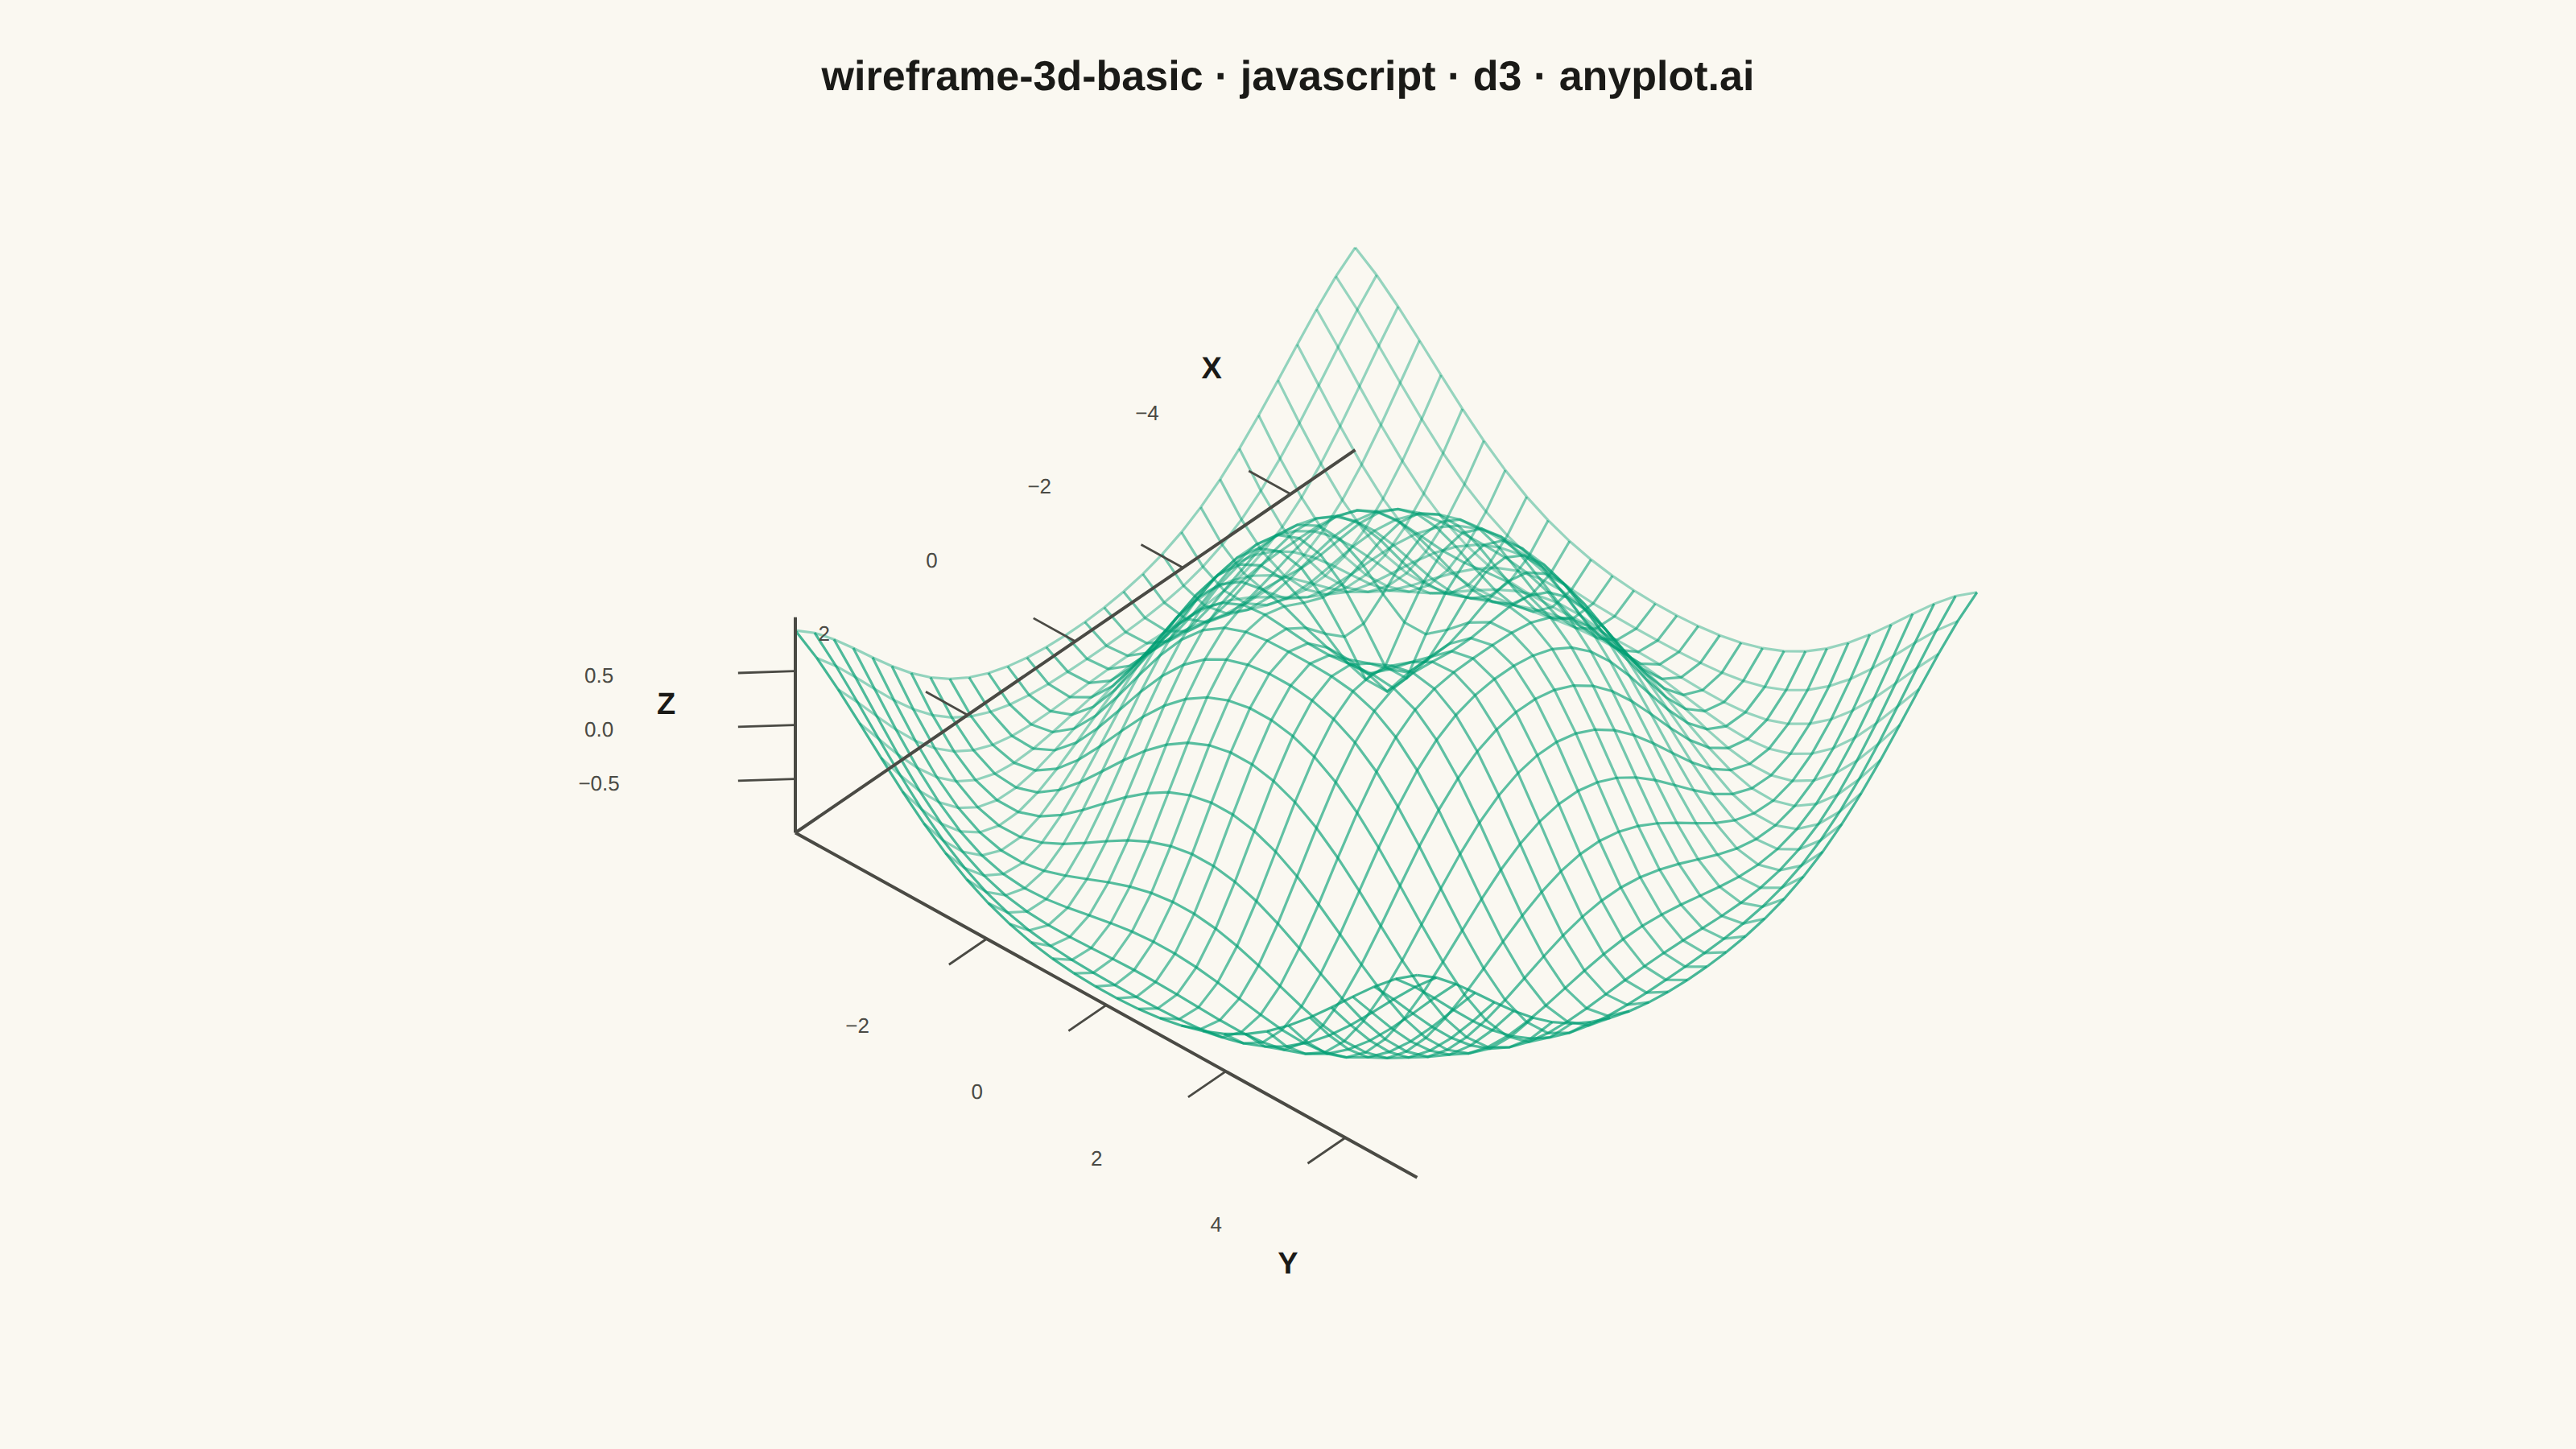
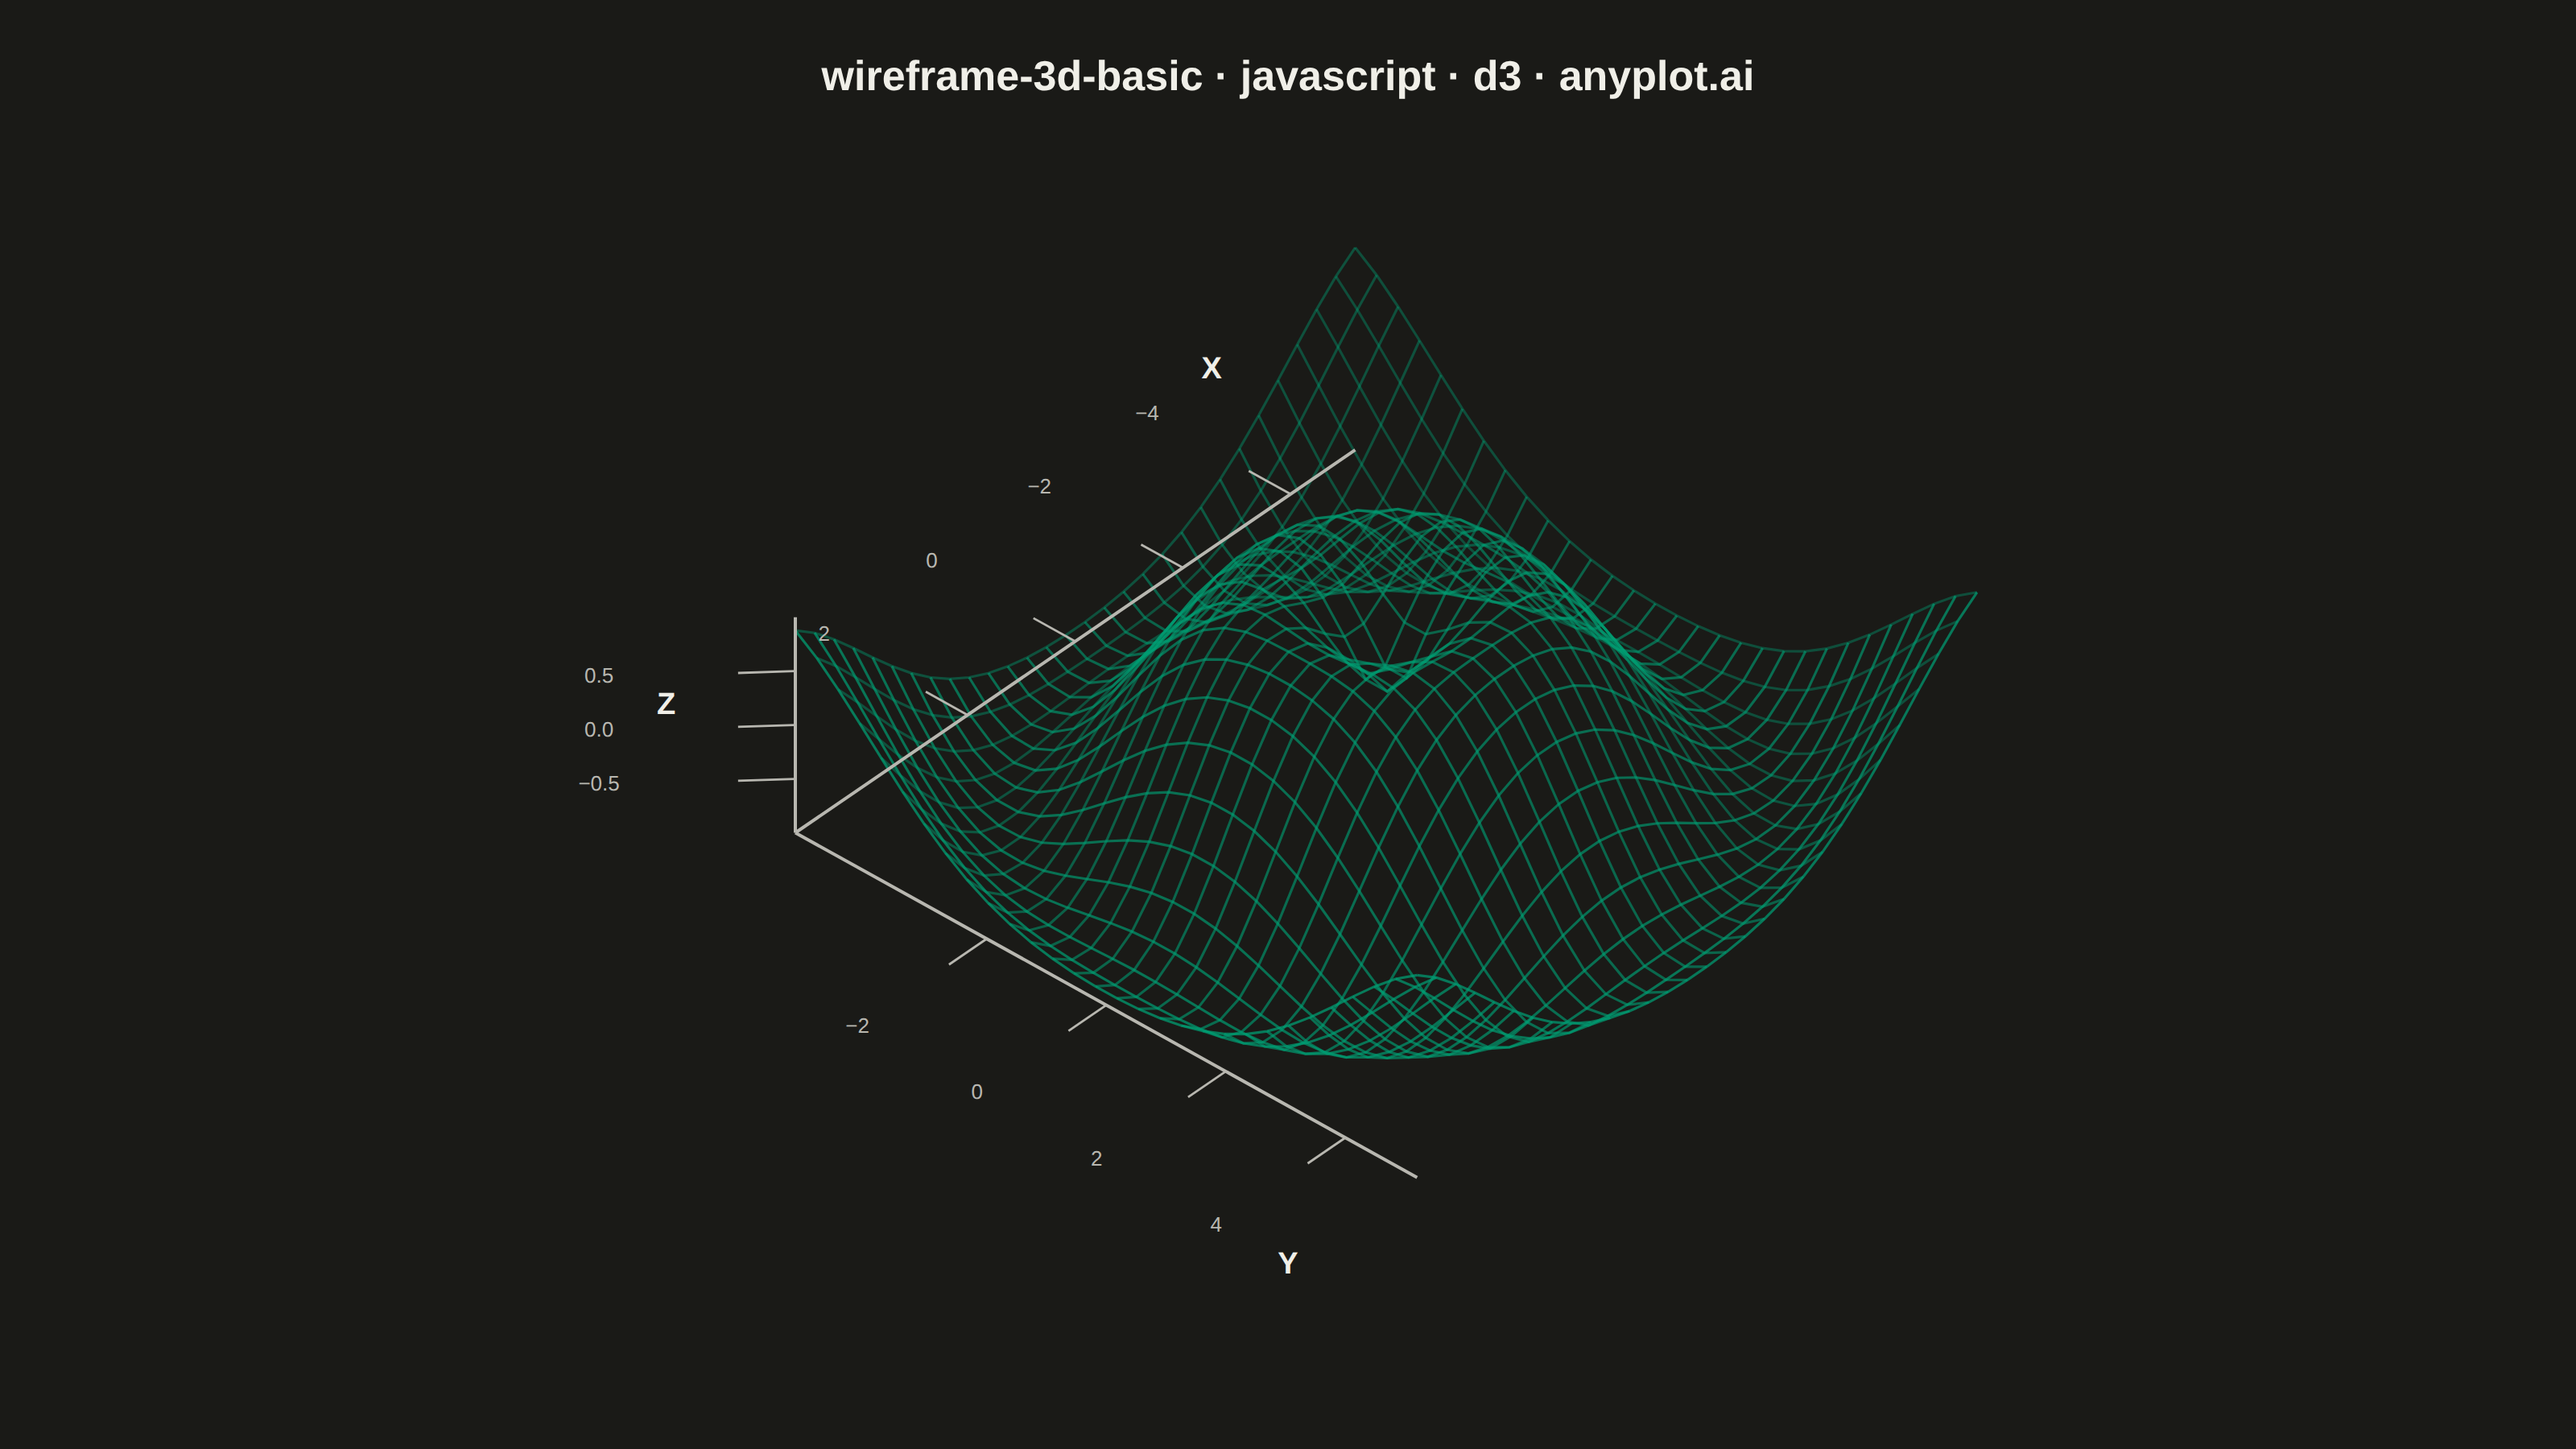
A 3D wireframe plot displays a mathematical surface as a mesh of lines connecting grid points in three-dimensional space. Unlike solid surface plots, wireframes render only the edges between grid points, creating a see-through visualization that reveals the underlying structure and allows viewing parts of the surface that would otherwise be hidden. This makes wireframes ideal for understanding the topology and shape of 3D functions.
// anyplot.ai
// wireframe-3d-basic: Basic 3D Wireframe Plot
// Library: d3 7.9.0 | JavaScript 22.23.1
// Quality: 97/100 | Created: 2026-08-04

const t = window.ANYPLOT_TOKENS;
const { width, height } = window.ANYPLOT_SIZE;
const margin = { top: 130, right: 100, bottom: 90, left: 100 };
const iw = width - margin.left - margin.right;
const ih = height - margin.top - margin.bottom;

// --- Data (in-memory, deterministic) ----------------------------------------
// Ripple surface z = sin(sqrt(x^2 + y^2)) sampled on an evenly spaced grid.
const GRID_N = 30;
const AXIS_RANGE = 5.2;
const Z_EXAGGERATION = 1.7; // visual-only height boost so ripples read clearly

const xs = d3.range(GRID_N).map((i) => -AXIS_RANGE + (2 * AXIS_RANGE * i) / (GRID_N - 1));
const ys = d3.range(GRID_N).map((i) => -AXIS_RANGE + (2 * AXIS_RANGE * i) / (GRID_N - 1));
const rippleHeight = (x, y) => Math.sin(Math.sqrt(x * x + y * y));
const zGrid = ys.map((y) => xs.map((x) => rippleHeight(x, y)));
const zFlat = zGrid.flat();
const zRawMin = d3.min(zFlat);
const zRawMax = d3.max(zFlat);

// --- Camera: elevation/azimuth orthographic projection ----------------------
const ELEVATION = 38;
const AZIMUTH = 42;
const elRad = (ELEVATION * Math.PI) / 180;
const azRad = (AZIMUTH * Math.PI) / 180;

const camDir = [Math.cos(elRad) * Math.cos(azRad), Math.cos(elRad) * Math.sin(azRad), Math.sin(elRad)];
const cross = (a, b) => [a[1] * b[2] - a[2] * b[1], a[2] * b[0] - a[0] * b[2], a[0] * b[1] - a[1] * b[0]];
const normalize = (v) => {
  const len = Math.hypot(v[0], v[1], v[2]);
  return [v[0] / len, v[1] / len, v[2] / len];
};
const dot = (a, b) => a[0] * b[0] + a[1] * b[1] + a[2] * b[2];

const worldUp = [0, 0, 1];
const right = normalize(cross(worldUp, camDir));
const up = normalize(cross(camDir, right));

const project = (x, y, z) => [dot([x, y, z], right), dot([x, y, z], up)];
const depthOf = (x, y, z) => dot([x, y, z], camDir);

// --- Grid points in view space ------------------------------------------------
const points = zGrid.map((row, j) =>
  row.map((zRaw, i) => {
    const xd = xs[i];
    const yd = ys[j];
    const zd = zRaw * Z_EXAGGERATION;
    const [vx, vy] = project(xd, yd, zd);
    return { vx, vy, depth: depthOf(xd, yd, zd) };
  })
);

const meshLines = [];
for (let j = 0; j < GRID_N; j++) {
  meshLines.push({ pts: points[j], depth: d3.mean(points[j], (d) => d.depth) });
}
for (let i = 0; i < GRID_N; i++) {
  const col = points.map((row) => row[i]);
  meshLines.push({ pts: col, depth: d3.mean(col, (d) => d.depth) });
}
meshLines.sort((a, b) => a.depth - b.depth); // far to near — later draws sit on top

const depthExtent = d3.extent(points.flat(), (d) => d.depth);
const opacityScale = d3.scaleLinear().domain(depthExtent).range([0.3, 0.95]).clamp(true);

// --- Axis frame (floor corner behind the mesh, relative to the camera) ------
const xMin = xs[0];
const xMax = xs[GRID_N - 1];
const yMin = ys[0];
const yMax = ys[GRID_N - 1];
const zMinScaled = zRawMin * Z_EXAGGERATION;
const zMaxScaled = zRawMax * Z_EXAGGERATION;

// Pick the floor corner that projects furthest to screen-left, so the axis
// frame traces the mesh's visual silhouette instead of cutting through it.
let anchorX = xMin;
let anchorY = yMin;
let bestVx = Infinity;
for (const cx of [xMin, xMax]) {
  for (const cy of [yMin, yMax]) {
    const [vx] = project(cx, cy, zMinScaled);
    if (vx < bestVx) {
      bestVx = vx;
      anchorX = cx;
      anchorY = cy;
    }
  }
}
const xAxisOtherEnd = anchorX === xMin ? xMax : xMin;
const yAxisOtherEnd = anchorY === yMin ? yMax : yMin;
const outwardXSign = anchorX > xAxisOtherEnd ? 1 : -1;
const outwardYSign = anchorY > yAxisOtherEnd ? 1 : -1;
const TICK_LEN = 0.7;
const LABEL_LEN = 2.4;
// Z ticks step diagonally away from the shared corner (not along the X or Y
// axis direction) so they don't crowd the other two axes' own tick labels.
const Z_TICK_LEN = TICK_LEN * 0.72;
const Z_LABEL_LEN = LABEL_LEN * 0.72;

const axisLines = [
  [
    [anchorX, anchorY, zMinScaled],
    [xAxisOtherEnd, anchorY, zMinScaled],
  ],
  [
    [anchorX, anchorY, zMinScaled],
    [anchorX, yAxisOtherEnd, zMinScaled],
  ],
  [
    [anchorX, anchorY, zMinScaled],
    [anchorX, anchorY, zMaxScaled],
  ],
];

// Ticks landing close to the shared corner crowd the Z axis's own tick
// column (all three axes converge there) — drop those, they're redundant
// next to the corner anyway.
const CORNER_GUARD = 0.15;
const xTicks = d3.ticks(xMin, xMax, 4)
  .filter((v) => Math.abs(v - anchorX) > CORNER_GUARD * (xMax - xMin))
  .map((v) => ({
    a: [v, anchorY, zMinScaled],
    b: [v, anchorY + outwardYSign * TICK_LEN, zMinScaled],
    label: [v, anchorY + outwardYSign * LABEL_LEN, zMinScaled],
    text: d3.format(".0f")(v),
  }));
const yTicks = d3.ticks(yMin, yMax, 4)
  .filter((v) => Math.abs(v - anchorY) > CORNER_GUARD * (yMax - yMin))
  .map((v) => ({
    a: [anchorX, v, zMinScaled],
    b: [anchorX + outwardXSign * TICK_LEN, v, zMinScaled],
    label: [anchorX + outwardXSign * LABEL_LEN, v, zMinScaled],
    text: d3.format(".0f")(v),
  }));
const zTicks = d3.ticks(zRawMin, zRawMax, 4).map((v) => ({
  a: [anchorX, anchorY, v * Z_EXAGGERATION],
  b: [anchorX + outwardXSign * Z_TICK_LEN, anchorY + outwardYSign * Z_TICK_LEN, v * Z_EXAGGERATION],
  label: [anchorX + outwardXSign * Z_LABEL_LEN, anchorY + outwardYSign * Z_LABEL_LEN, v * Z_EXAGGERATION],
  text: d3.format(".1f")(v),
}));

const axisLabels = [
  { pos: [xAxisOtherEnd, anchorY + outwardYSign * 2.4, zMinScaled], text: "X" },
  { pos: [anchorX + outwardXSign * 2.4, yAxisOtherEnd, zMinScaled], text: "Y" },
  { pos: [anchorX + outwardXSign * 2.4, anchorY, zMaxScaled], text: "Z" },
];

// --- Fit view-space extent (mesh + axis frame + tick stubs) into the mount --
const extentSource = [
  ...points.flat().map((d) => [d.vx, d.vy]),
  ...axisLines.flatMap(([a, b]) => [project(...a), project(...b)]),
  ...xTicks.flatMap((tk) => [project(...tk.a), project(...tk.label)]),
  ...yTicks.flatMap((tk) => [project(...tk.a), project(...tk.label)]),
  ...zTicks.flatMap((tk) => [project(...tk.a), project(...tk.label)]),
  ...axisLabels.map((l) => project(...l.pos)),
];
const extMinX = d3.min(extentSource, (d) => d[0]);
const extMaxX = d3.max(extentSource, (d) => d[0]);
const extMinY = d3.min(extentSource, (d) => d[1]);
const extMaxY = d3.max(extentSource, (d) => d[1]);
const midX = (extMinX + extMaxX) / 2;
const midY = (extMinY + extMaxY) / 2;
const fitScale = 0.93 * Math.min(iw / (extMaxX - extMinX), ih / (extMaxY - extMinY));
const toScreen = ([vx, vy]) => [
  margin.left + iw / 2 + (vx - midX) * fitScale,
  margin.top + ih / 2 - (vy - midY) * fitScale,
];

// --- SVG mount ----------------------------------------------------------------
const svg = d3.select("#container").append("svg").attr("width", width).attr("height", height);

// --- Wireframe mesh, painted back-to-front for a plausible depth cue --------
const line = d3
  .line()
  .x((d) => d[0])
  .y((d) => d[1]);

const mesh = svg.append("g").attr("stroke", t.palette[0]).attr("fill", "none").attr("stroke-width", 1.6);
mesh
  .selectAll("path")
  .data(meshLines)
  .join("path")
  .attr("d", (d) => line(d.pts.map((p) => toScreen([p.vx, p.vy]))))
  .attr("stroke-opacity", (d) => opacityScale(d.depth));

// --- Axis frame ----------------------------------------------------------------
const axisGroup = svg.append("g").attr("stroke", t.inkSoft).attr("stroke-width", 2);
axisGroup
  .selectAll("line")
  .data(axisLines)
  .join("line")
  .attr("x1", (d) => toScreen(project(...d[0]))[0])
  .attr("y1", (d) => toScreen(project(...d[0]))[1])
  .attr("x2", (d) => toScreen(project(...d[1]))[0])
  .attr("y2", (d) => toScreen(project(...d[1]))[1]);

const tickGroup = svg.append("g").attr("stroke", t.inkSoft).attr("stroke-width", 1.4);
const allTicks = [...xTicks, ...yTicks, ...zTicks];
tickGroup
  .selectAll("line")
  .data(allTicks)
  .join("line")
  .attr("x1", (d) => toScreen(project(...d.a))[0])
  .attr("y1", (d) => toScreen(project(...d.a))[1])
  .attr("x2", (d) => toScreen(project(...d.b))[0])
  .attr("y2", (d) => toScreen(project(...d.b))[1]);

// Screen-space corner-overlap guard: CORNER_GUARD above only filters ticks by
// 3D data-space distance to the anchor, but a tick far from the anchor in
// data space can still project close to the shared corner in 2D at this
// camera angle. Push any tick label whose *projected* position lands inside
// a pixel radius of the projected corner further out along the corner->label
// direction, so no label ever renders on top of the mesh silhouette there.
const anchorScreen = toScreen(project(anchorX, anchorY, zMinScaled));
const CORNER_PX_RADIUS = 42;
for (const tk of allTicks) {
  const [sx, sy] = toScreen(project(...tk.label));
  let dx = sx - anchorScreen[0];
  let dy = sy - anchorScreen[1];
  let dist = Math.hypot(dx, dy);
  if (dist < 1e-6) {
    const [bx, by] = toScreen(project(...tk.b));
    dx = bx - anchorScreen[0];
    dy = by - anchorScreen[1];
    dist = Math.hypot(dx, dy) || 1;
  }
  if (dist < CORNER_PX_RADIUS) {
    const scale = (CORNER_PX_RADIUS * 1.15) / dist;
    tk.labelScreen = [anchorScreen[0] + dx * scale, anchorScreen[1] + dy * scale];
  } else {
    tk.labelScreen = [sx, sy];
  }
}

svg
  .append("g")
  .attr("fill", t.inkSoft)
  .style("font-size", "13px")
  .selectAll("text")
  .data(allTicks)
  .join("text")
  .attr("x", (d) => d.labelScreen[0])
  .attr("y", (d) => d.labelScreen[1])
  .attr("text-anchor", "middle")
  .attr("dominant-baseline", "middle")
  .text((d) => d.text);

svg
  .append("g")
  .attr("fill", t.ink)
  .style("font-size", "19px")
  .style("font-weight", "600")
  .selectAll("text")
  .data(axisLabels)
  .join("text")
  .attr("x", (d) => toScreen(project(...d.pos))[0])
  .attr("y", (d) => toScreen(project(...d.pos))[1])
  .attr("text-anchor", "middle")
  .attr("dominant-baseline", "middle")
  .text((d) => d.text);

// --- Title ----------------------------------------------------------------
svg
  .append("text")
  .attr("x", width / 2)
  .attr("y", 56)
  .attr("text-anchor", "middle")
  .attr("fill", t.ink)
  .style("font-size", "26px")
  .style("font-weight", "600")
  .text("wireframe-3d-basic · javascript · d3 · anyplot.ai");
Runnable source as JSON, for any HTTP client: https://api.anyplot.ai/specs/wireframe-3d-basic/d3/code. Any spec id and library id listed in llms-full.txt fit the same URL shape; every URL below is complete and callable.
{
  "spec_id": "wireframe-3d-basic",
  "language": "javascript",
  "library": "d3",
  "page": "https://anyplot.ai/wireframe-3d-basic/javascript/d3",
  "hub": "https://anyplot.ai/wireframe-3d-basic",
  "code_json": "https://api.anyplot.ai/specs/wireframe-3d-basic/d3/code",
  "spec_json": "https://api.anyplot.ai/specs/wireframe-3d-basic",
  "render_light_png": "https://storage.googleapis.com/anyplot-images/plots/wireframe-3d-basic/javascript/d3/plot-light.png",
  "render_dark_png": "https://storage.googleapis.com/anyplot-images/plots/wireframe-3d-basic/javascript/d3/plot-dark.png",
  "interactive_light_html": "https://storage.googleapis.com/anyplot-images/plots/wireframe-3d-basic/javascript/d3/plot-light.html",
  "interactive_dark_html": "https://storage.googleapis.com/anyplot-images/plots/wireframe-3d-basic/javascript/d3/plot-dark.html",
  "quality_score": 97.0,
  "license": "MIT",
  "guide": "https://anyplot.ai/llms.txt"
}
Part of Basic 3D Wireframe Plot on anyplot.ai.