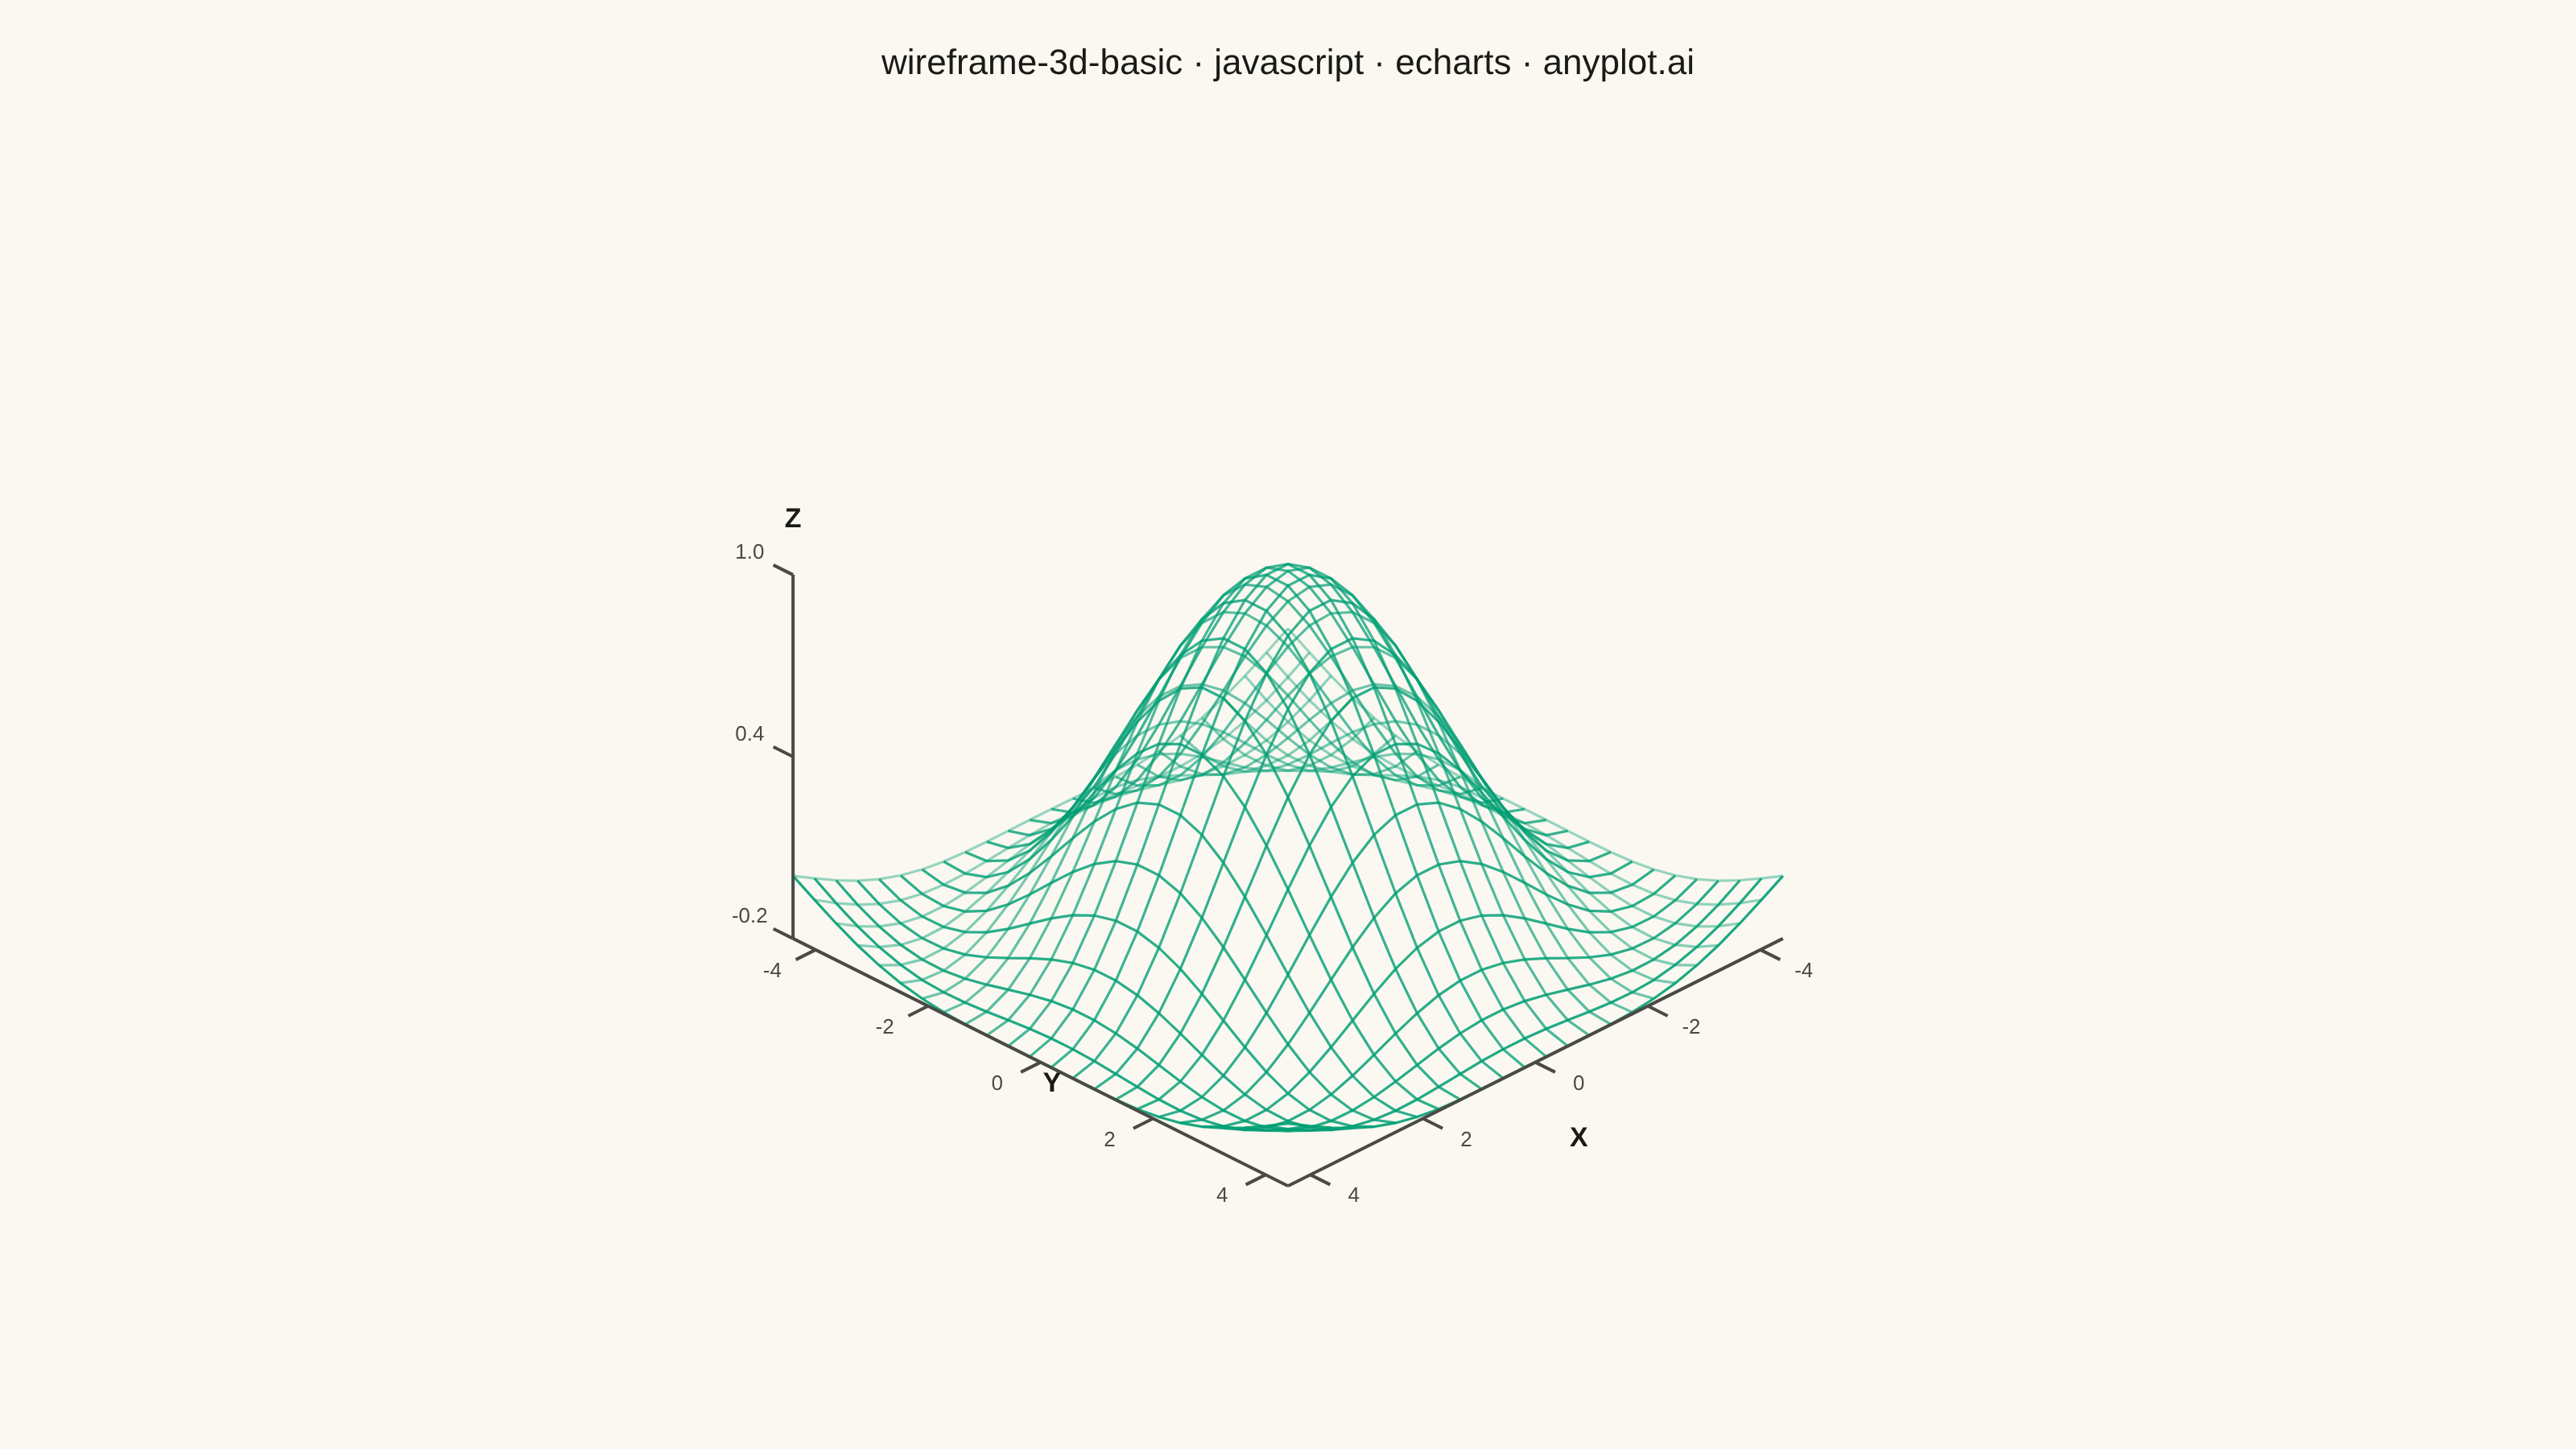
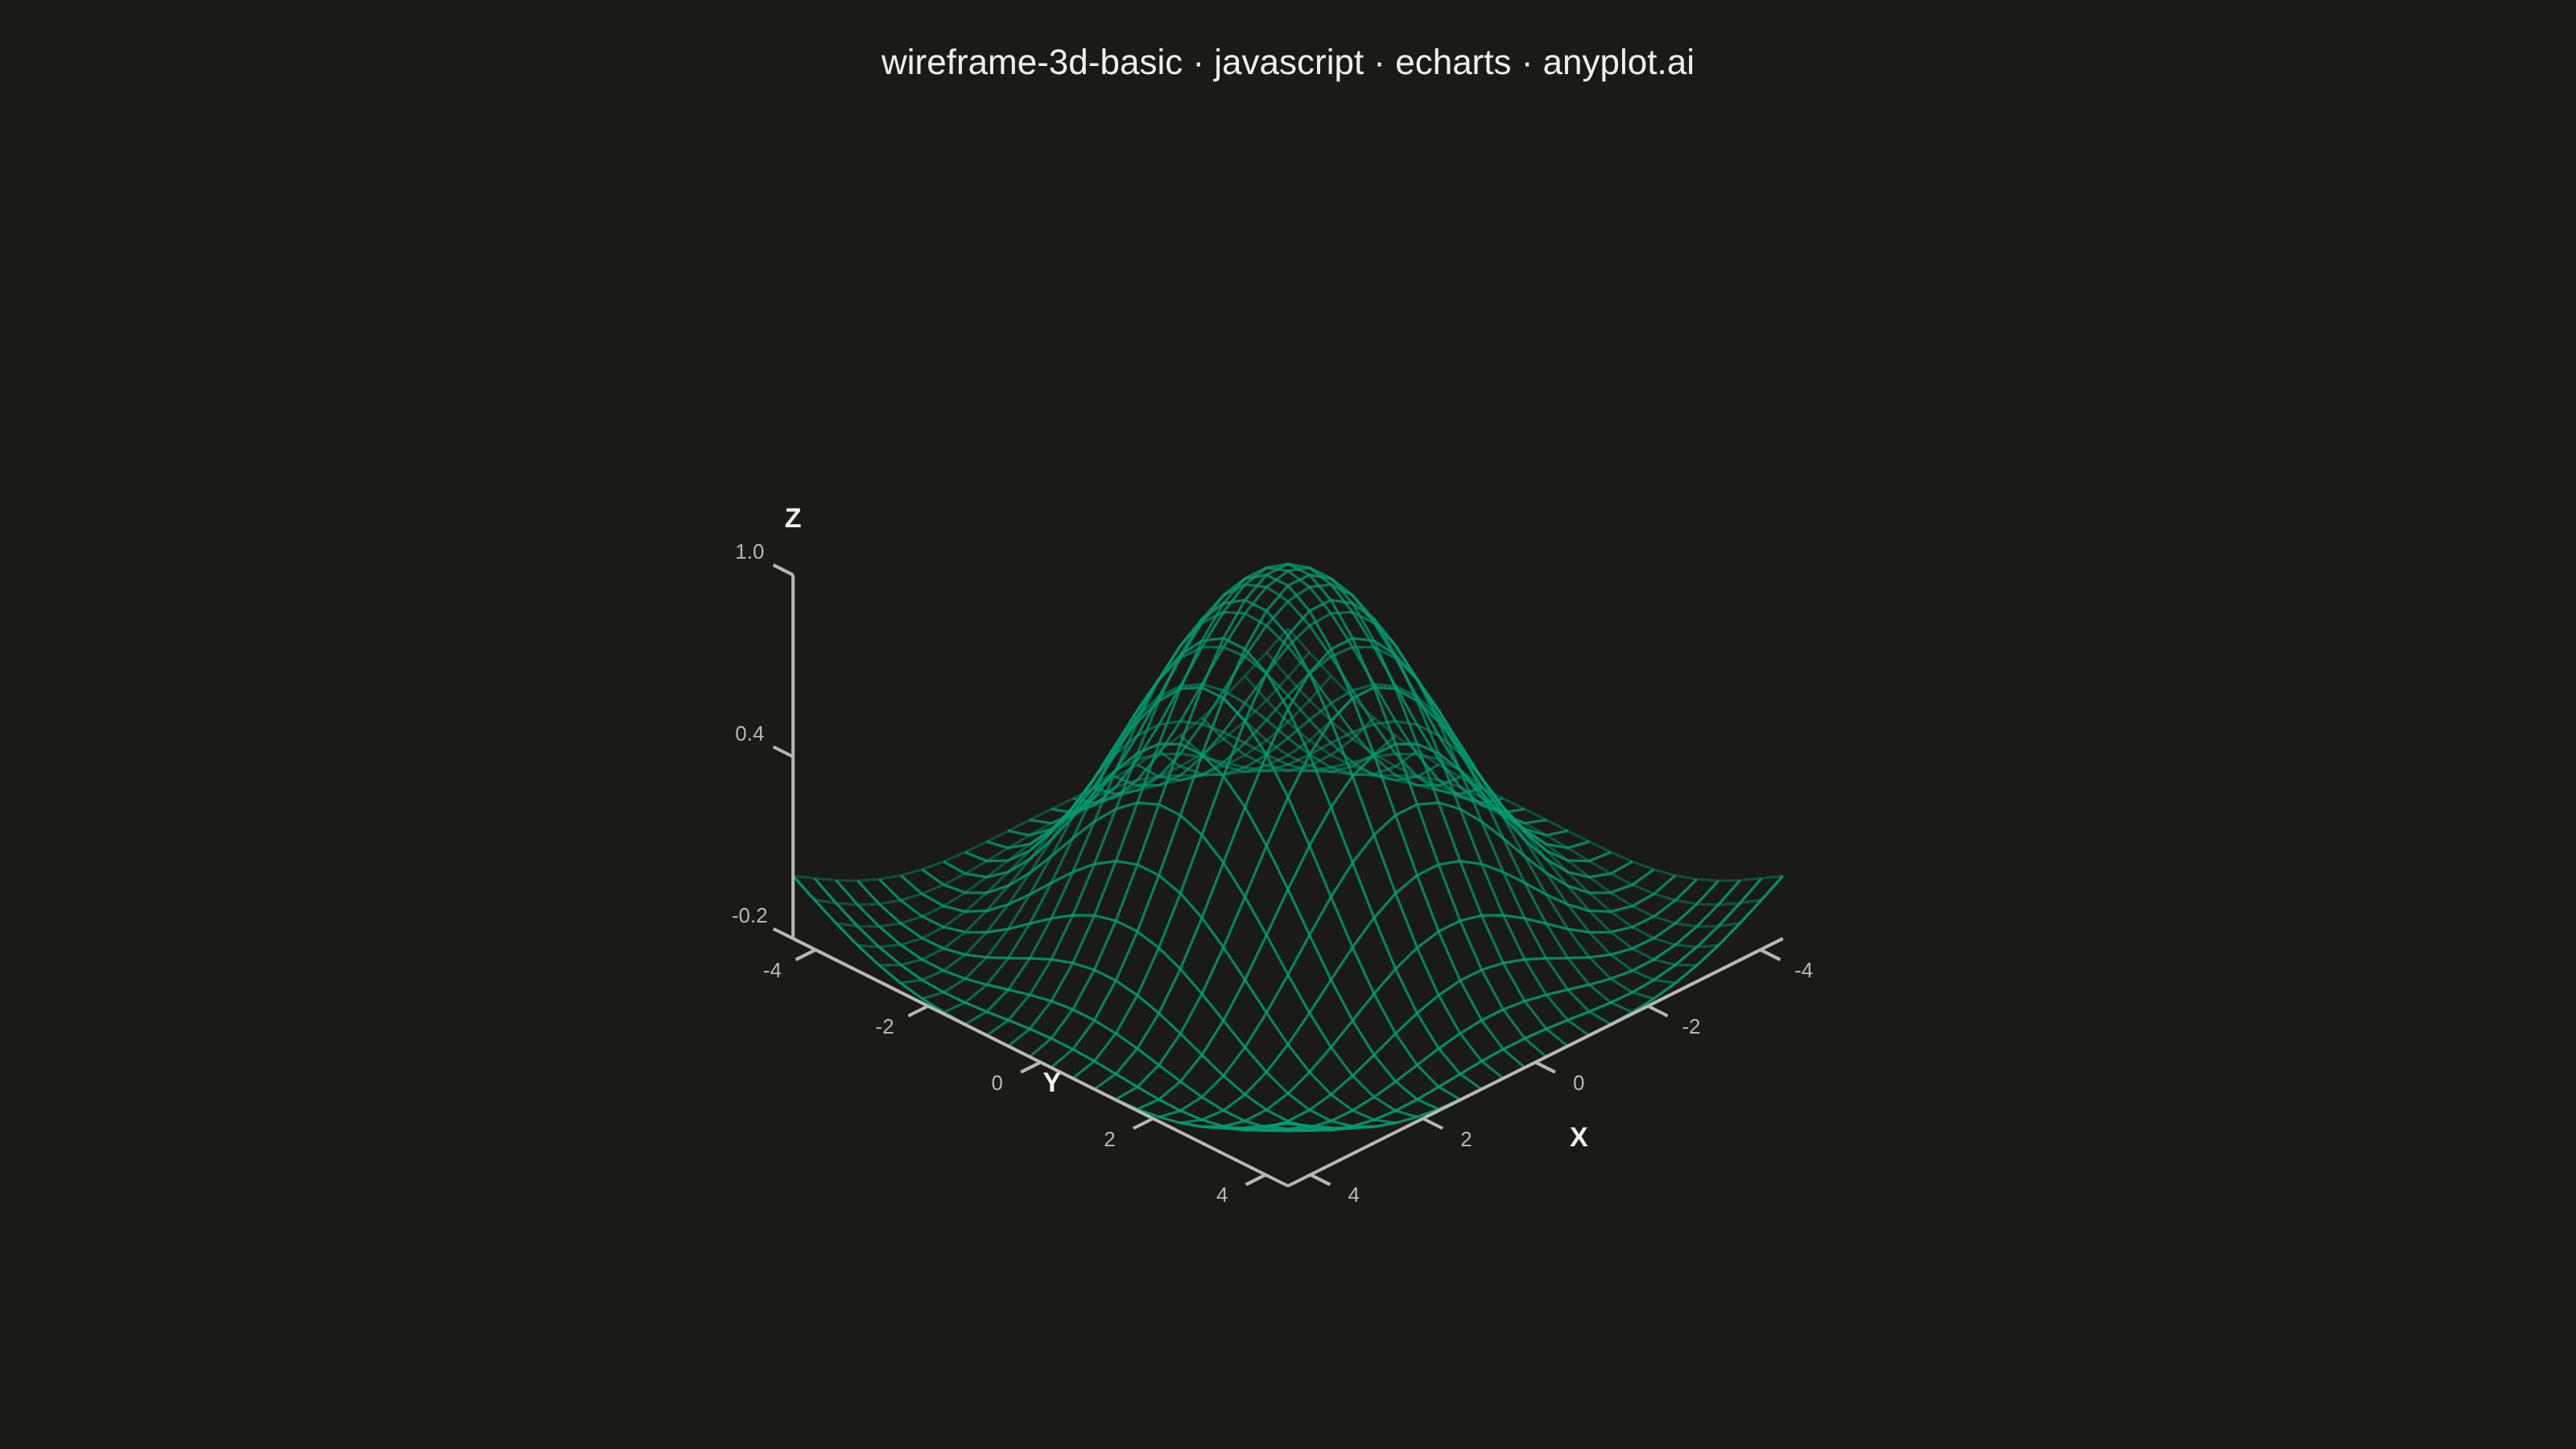
A 3D wireframe plot displays a mathematical surface as a mesh of lines connecting grid points in three-dimensional space. Unlike solid surface plots, wireframes render only the edges between grid points, creating a see-through visualization that reveals the underlying structure and allows viewing parts of the surface that would otherwise be hidden. This makes wireframes ideal for understanding the topology and shape of 3D functions.
// anyplot.ai
// wireframe-3d-basic: Basic 3D Wireframe Plot
// Library: echarts 6.1.0 | JavaScript 22.23.1
// Quality: 89/100 | Created: 2026-08-04

const t = window.ANYPLOT_TOKENS;
const size = window.ANYPLOT_SIZE;

// --- Data: ripple surface z = sinc(r) = sin(r)/r on a 24x24 grid -----------
// RANGE is chosen so the diagonal (the farthest grid corner) reaches close to
// one full sin() period (2*pi) — a clean central peak plus one surrounding
// ring, without a truncated third lobe fraying the corners. Dividing by r
// (the sinc form, naturally 1 at r=0) keeps the apex a smooth dome instead of
// the sharp cusp a raw sin(r) surface has at the center.
const GRID_N = 24;
const RANGE = 4.4;
const step = (2 * RANGE) / (GRID_N - 1);
const xs = Array.from({ length: GRID_N }, (_, i) => -RANGE + i * step);
const ys = Array.from({ length: GRID_N }, (_, i) => -RANGE + i * step);
const zGrid = xs.map((x) =>
  ys.map((y) => {
    const r = Math.sqrt(x * x + y * y);
    return r === 0 ? 1 : Math.sin(r) / r;
  })
);
const zFlat = zGrid.flat();
const zMin = Math.min(...zFlat);
const zMax = Math.max(...zFlat);

// --- Camera: orthographic axonometric projection (elevation + azimuth) -----
const ELEVATION = (30 * Math.PI) / 180;
const AZIMUTH = (45 * Math.PI) / 180;
const sinAz = Math.sin(AZIMUTH);
const cosAz = Math.cos(AZIMUTH);
const sinEl = Math.sin(ELEVATION);
const cosEl = Math.cos(ELEVATION);
const ZSCALE = 0.6; // compresses height relative to the x/y footprint

// Normalizes (x, y, zData) to a unit-ish cube, then rotates onto the view
// plane. Depth (toward/away from the camera) is returned alongside the 2D
// screen offset so lines can be drawn back-to-front with a subtle depth fade.
function projectRaw(x, y, zData) {
  const xn = x / RANGE;
  const yn = y / RANGE;
  const zn = ((zData - (zMin + zMax) / 2) / (zMax - zMin)) * 2 * ZSCALE;
  const screenX = -xn * sinAz + yn * cosAz;
  const screenY = -xn * cosAz * sinEl - yn * sinAz * sinEl + zn * cosEl;
  const depth = xn * cosEl * cosAz + yn * cosEl * sinAz + zn * sinEl;
  return { screenX, screenY, depth };
}

// --- Fit the projected bounding box into the mount, leaving title room -----
const corners = [];
for (const x of [-RANGE, RANGE]) {
  for (const y of [-RANGE, RANGE]) {
    for (const z of [zMin, zMax]) corners.push(projectRaw(x, y, z));
  }
}
const sxs = corners.map((c) => c.screenX);
const sys = corners.map((c) => c.screenY);
const boxW = Math.max(...sxs) - Math.min(...sxs);
const boxH = Math.max(...sys) - Math.min(...sys);
const boxCx = (Math.max(...sxs) + Math.min(...sxs)) / 2;
const boxCy = (Math.max(...sys) + Math.min(...sys)) / 2;

const TOP_MARGIN = 110;
const SIDE_MARGIN = 90;
const BOTTOM_MARGIN = 70;
const drawW = size.width - 2 * SIDE_MARGIN;
const drawH = size.height - TOP_MARGIN - BOTTOM_MARGIN;
// Extra padding so axis ticks/labels (drawn slightly outside the data cube)
// stay within the mount.
const PAD = 1.35;
const scale = Math.min(drawW / (boxW * PAD), drawH / (boxH * PAD));
const originX = size.width / 2 - boxCx * scale;
const originY = TOP_MARGIN + drawH / 2 + boxCy * scale;

function toPixel(x, y, zData) {
  const { screenX, screenY, depth } = projectRaw(x, y, zData);
  return { px: originX + screenX * scale, py: originY - screenY * scale, depth };
}

// --- Wireframe mesh: one polyline per grid row and per grid column ---------
const BRAND = t.palette[0];
const meshLines = [];
for (let i = 0; i < GRID_N; i += 1) {
  const rowPts = xs.map((x, xi) => toPixel(x, ys[i], zGrid[xi][i]));
  const rowDepth = rowPts.reduce((s, p) => s + p.depth, 0) / rowPts.length;
  meshLines.push({ points: rowPts.map((p) => [p.px, p.py]), depth: rowDepth });
}
for (let j = 0; j < GRID_N; j += 1) {
  const colPts = ys.map((y, k) => toPixel(xs[j], y, zGrid[j][k]));
  const colDepth = colPts.reduce((s, p) => s + p.depth, 0) / colPts.length;
  meshLines.push({ points: colPts.map((p) => [p.px, p.py]), depth: colDepth });
}
// Back-to-front draw order plus a depth-based opacity fade gives a gentle
// see-through, near-lines-brighter cue without any hidden-line removal.
meshLines.sort((a, b) => a.depth - b.depth);
const depths = meshLines.map((l) => l.depth);
const dMin = Math.min(...depths);
const dMax = Math.max(...depths);
const meshElements = meshLines.map((l) => {
  const tDepth = dMax > dMin ? (l.depth - dMin) / (dMax - dMin) : 1;
  return {
    type: "polyline",
    shape: { points: l.points },
    style: { stroke: BRAND, lineWidth: 1.6, fill: "none", opacity: 0.4 + 0.5 * tDepth },
    silent: true,
  };
});

// --- Axis frame: three edges of the bounding box, ticks + labels -----------
const AXIS_COLOR = t.inkSoft;
const TICK_LEN = 0.35; // in data units along the outward axis direction
const axisElements = [];

function axisLine(p1, p2) {
  const points = [p1, p2].map(([x, y, z]) => {
    const p = toPixel(x, y, z);
    return [p.px, p.py];
  });
  axisElements.push({
    type: "polyline",
    shape: { points },
    style: { stroke: AXIS_COLOR, lineWidth: 2, fill: "none" },
    silent: true,
  });
}

function tickMark(base, outward) {
  const p1 = toPixel(...base);
  const p2 = toPixel(...outward);
  axisElements.push({
    type: "polyline",
    shape: { points: [[p1.px, p1.py], [p2.px, p2.py]] },
    style: { stroke: AXIS_COLOR, lineWidth: 2, fill: "none" },
    silent: true,
  });
}

function tickLabel(pos, text, align) {
  const p = toPixel(...pos);
  axisElements.push({
    type: "text",
    style: {
      text,
      x: p.px,
      y: p.py,
      fill: t.inkSoft,
      fontSize: 13,
      align: align || "center",
      verticalAlign: "middle",
    },
    silent: true,
  });
}

function axisTitle(pos, text, pixelOffset) {
  const p = toPixel(...pos);
  const dx = (pixelOffset && pixelOffset[0]) || 0;
  const dy = (pixelOffset && pixelOffset[1]) || 0;
  axisElements.push({
    type: "text",
    style: {
      text,
      x: p.px + dx,
      y: p.py + dy,
      fill: t.ink,
      fontSize: 17,
      fontWeight: "bold",
      align: "center",
      verticalAlign: "middle",
    },
    silent: true,
  });
}

// X and Y sit on the front-bottom corner of the data box — the corner
// whose projected screen position is farthest from (behind) the
// camera-facing surface, i.e. lowest on screen — so their ticks/labels
// never compete with the mesh for space. With this camera (elevation 30,
// azimuth 45) that is (+RANGE, +RANGE, zMin); ticks point further
// outward, away from the data box.
const CORNER_X = RANGE;
const CORNER_Y = RANGE;
const zAxisBase = zMin;
const axisTicks = [-4, -2, 0, 2, 4];

// X axis (varies x, fixed y = CORNER_Y, z = zMin) — ticks extend in +y
axisLine([-RANGE, CORNER_Y, zAxisBase], [RANGE, CORNER_Y, zAxisBase]);
axisTicks.forEach((v) => {
  tickMark([v, CORNER_Y, zAxisBase], [v, CORNER_Y + TICK_LEN, zAxisBase]);
  tickLabel([v, CORNER_Y + TICK_LEN * 2.2, zAxisBase], String(v));
});
axisTitle([0, CORNER_Y + TICK_LEN * 2.2, zAxisBase], "X", [0, 34]);

// Y axis (varies y, fixed x = CORNER_X, z = zMin) — ticks extend in +x
axisLine([CORNER_X, -RANGE, zAxisBase], [CORNER_X, RANGE, zAxisBase]);
axisTicks.forEach((v) => {
  tickMark([CORNER_X, v, zAxisBase], [CORNER_X + TICK_LEN, v, zAxisBase]);
  tickLabel([CORNER_X + TICK_LEN * 2.2, v, zAxisBase], String(v));
});
axisTitle([CORNER_X + TICK_LEN * 2.2, 0, zAxisBase], "Y", [34, 0]);

// Z sits on its own corner (+RANGE, -RANGE) rather than the X/Y corner:
// azimuth 45 puts every x=y point (including the surface peak at x=y=0) on
// the same vertical screen line, so a Z axis rising from (+RANGE, +RANGE)
// climbs straight up behind the peak. (+RANGE, -RANGE) has x + y = 0, which
// cancels the xy term in the screen-Y projection entirely — the column
// stays pinned to the box's far-left screen edge for its whole height,
// clear of the mesh above.
const Z_CORNER_X = RANGE;
const Z_CORNER_Y = -RANGE;
axisLine([Z_CORNER_X, Z_CORNER_Y, zMin], [Z_CORNER_X, Z_CORNER_Y, zMax]);
const zTicks = [zMin, (zMin + zMax) / 2, zMax];
zTicks.forEach((v) => {
  tickMark([Z_CORNER_X, Z_CORNER_Y, v], [Z_CORNER_X, Z_CORNER_Y - TICK_LEN, v]);
  // Guard the near-zero midpoint: floating-point rounding can leave it as a
  // tiny negative value, which .toFixed(1) would otherwise render as "-0.0".
  const label = (Math.abs(v) < 1e-9 ? 0 : v).toFixed(1);
  tickLabel([Z_CORNER_X, Z_CORNER_Y - TICK_LEN * 2.2, v], label, "center");
});
axisTitle([Z_CORNER_X, Z_CORNER_Y, zMax], "Z", [0, -34]);

// --- Init + option -----------------------------------------------------------
const chart = echarts.init(document.getElementById("container"));
chart.setOption({
  animation: false,
  backgroundColor: "transparent",
  title: {
    text: "wireframe-3d-basic · javascript · echarts · anyplot.ai",
    left: "center",
    top: 24,
    textStyle: { color: t.ink, fontSize: 22, fontWeight: 500 },
  },
  graphic: { elements: [...meshElements, ...axisElements] },
});
chart.on("finished", () => {
  window.__anyplotReady = true;
});
Runnable source as JSON, for any HTTP client: https://api.anyplot.ai/specs/wireframe-3d-basic/echarts/code. Any spec id and library id listed in llms-full.txt fit the same URL shape; every URL below is complete and callable.
{
  "spec_id": "wireframe-3d-basic",
  "language": "javascript",
  "library": "echarts",
  "page": "https://anyplot.ai/wireframe-3d-basic/javascript/echarts",
  "hub": "https://anyplot.ai/wireframe-3d-basic",
  "code_json": "https://api.anyplot.ai/specs/wireframe-3d-basic/echarts/code",
  "spec_json": "https://api.anyplot.ai/specs/wireframe-3d-basic",
  "render_light_png": "https://storage.googleapis.com/anyplot-images/plots/wireframe-3d-basic/javascript/echarts/plot-light.png",
  "render_dark_png": "https://storage.googleapis.com/anyplot-images/plots/wireframe-3d-basic/javascript/echarts/plot-dark.png",
  "interactive_light_html": "https://storage.googleapis.com/anyplot-images/plots/wireframe-3d-basic/javascript/echarts/plot-light.html",
  "interactive_dark_html": "https://storage.googleapis.com/anyplot-images/plots/wireframe-3d-basic/javascript/echarts/plot-dark.html",
  "quality_score": 89.0,
  "license": "MIT",
  "guide": "https://anyplot.ai/llms.txt"
}
Part of Basic 3D Wireframe Plot on anyplot.ai.