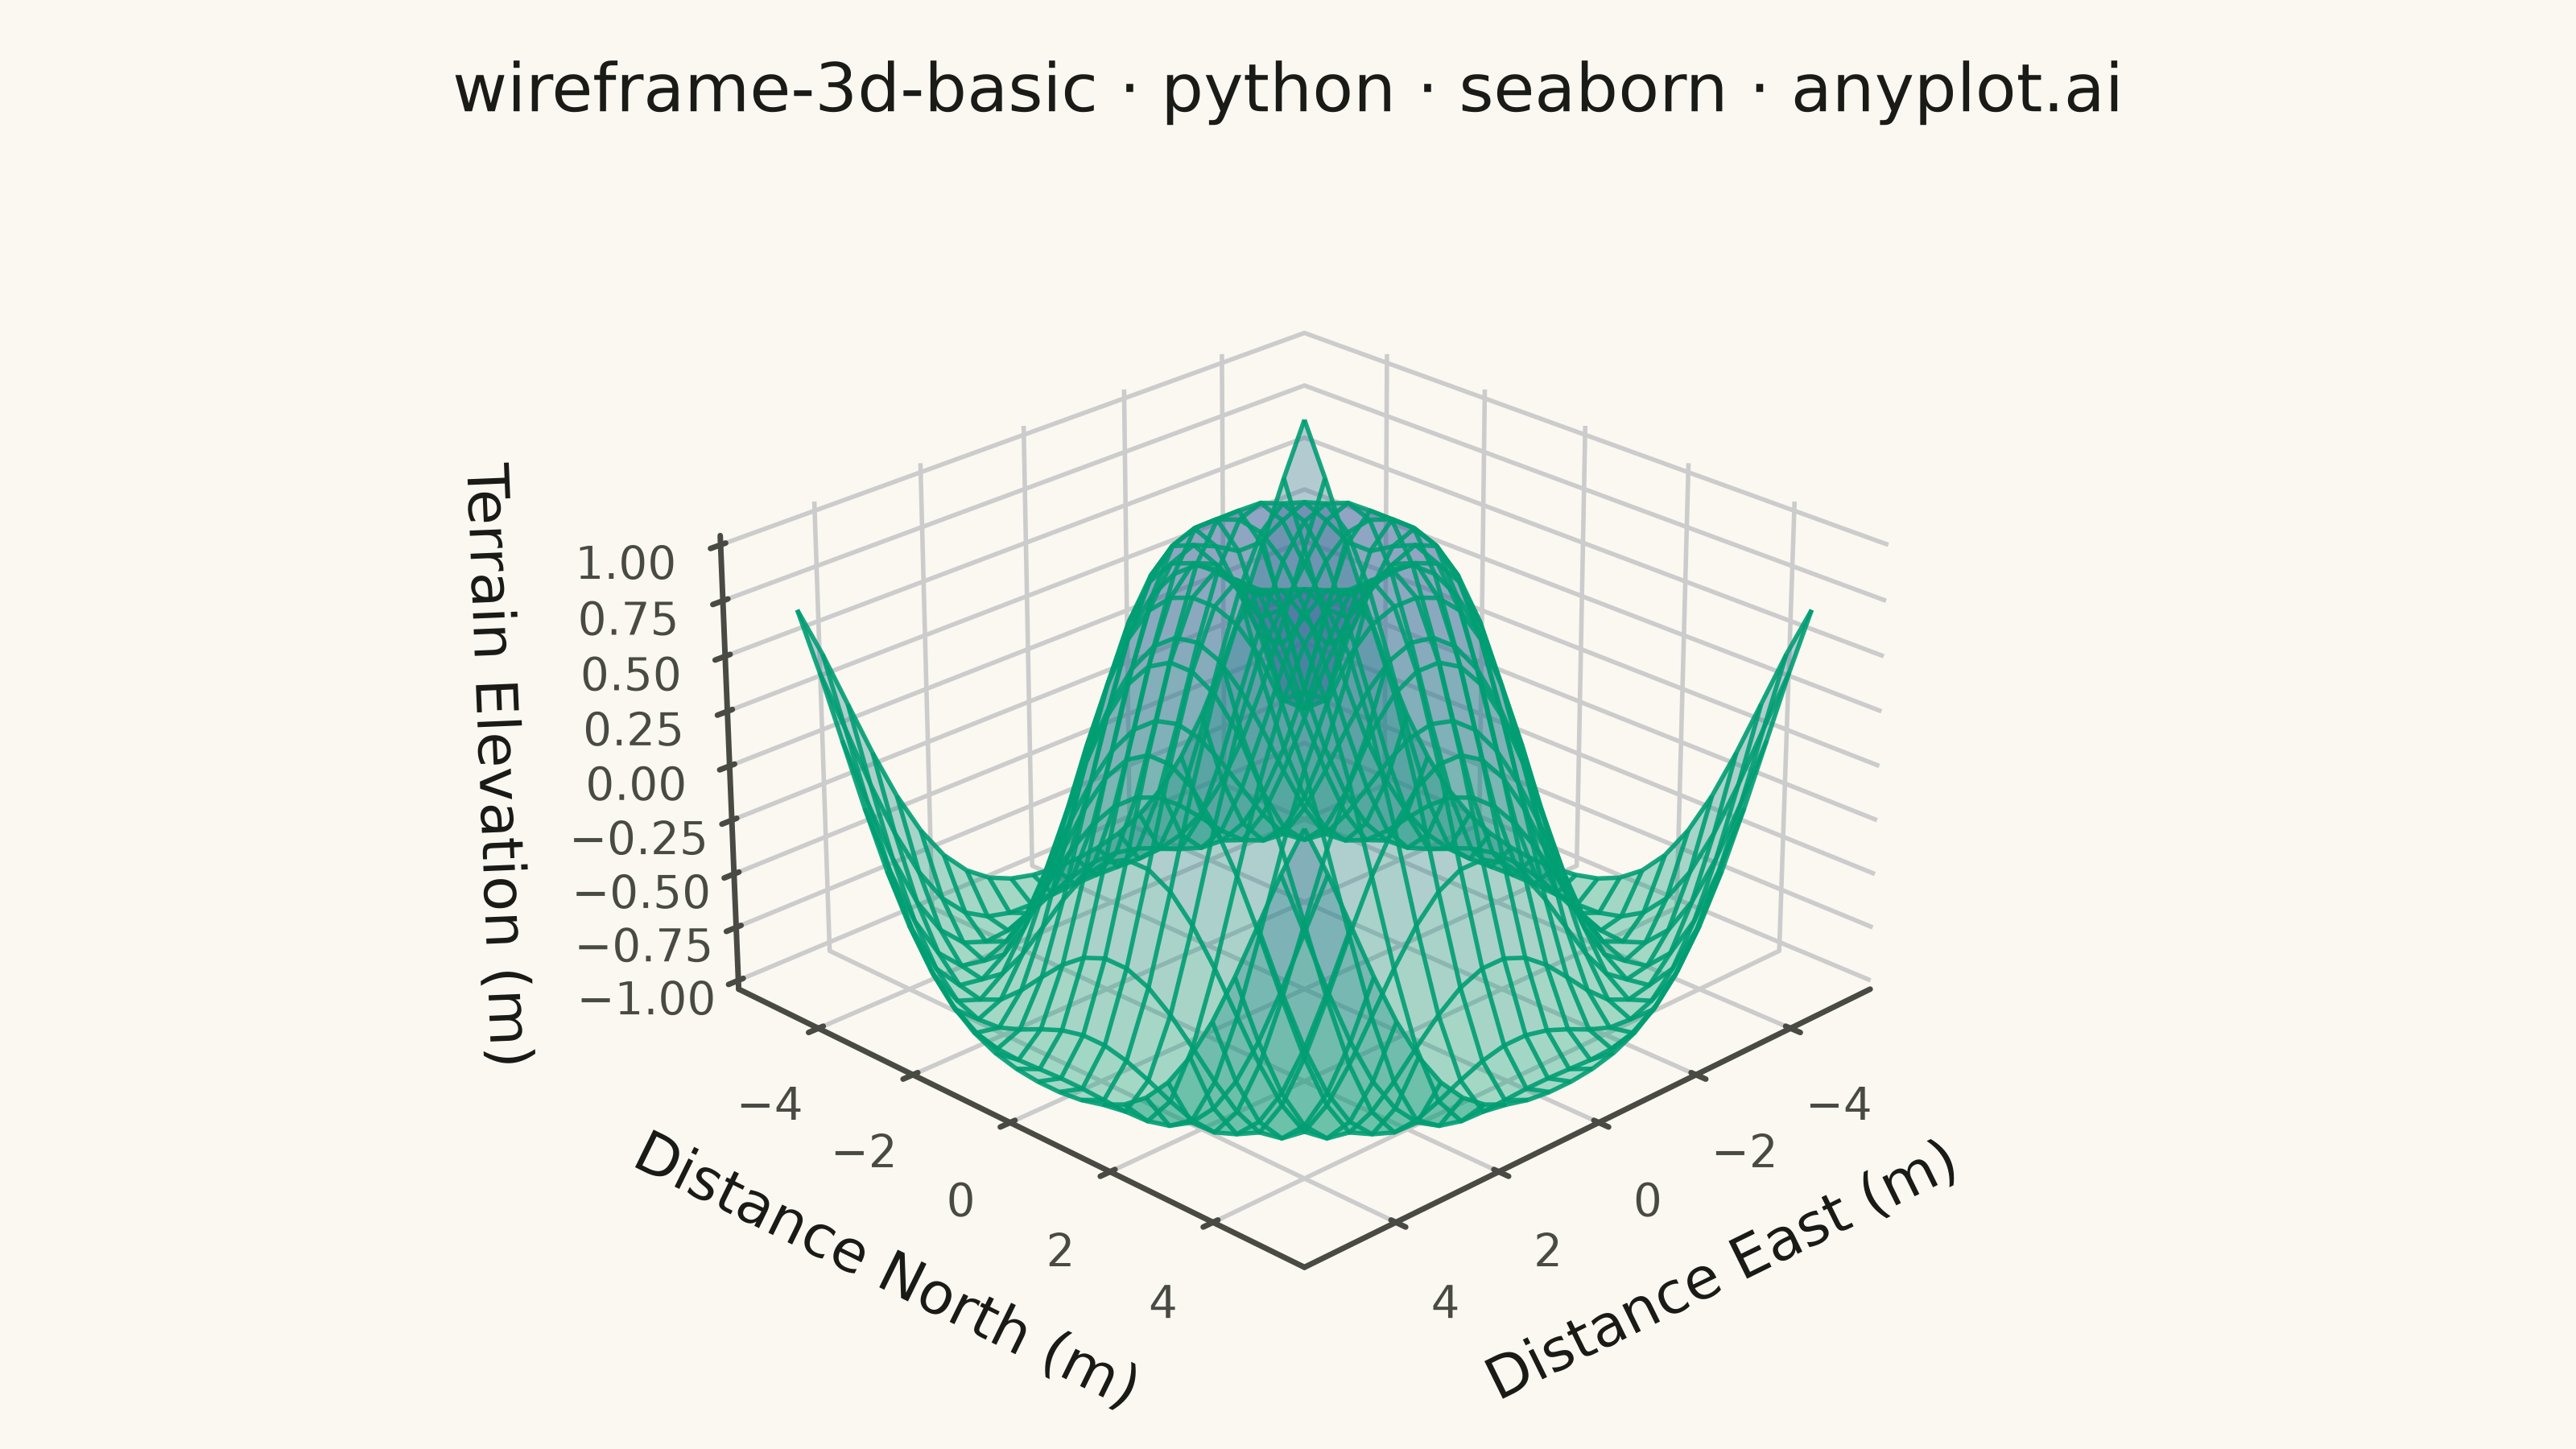
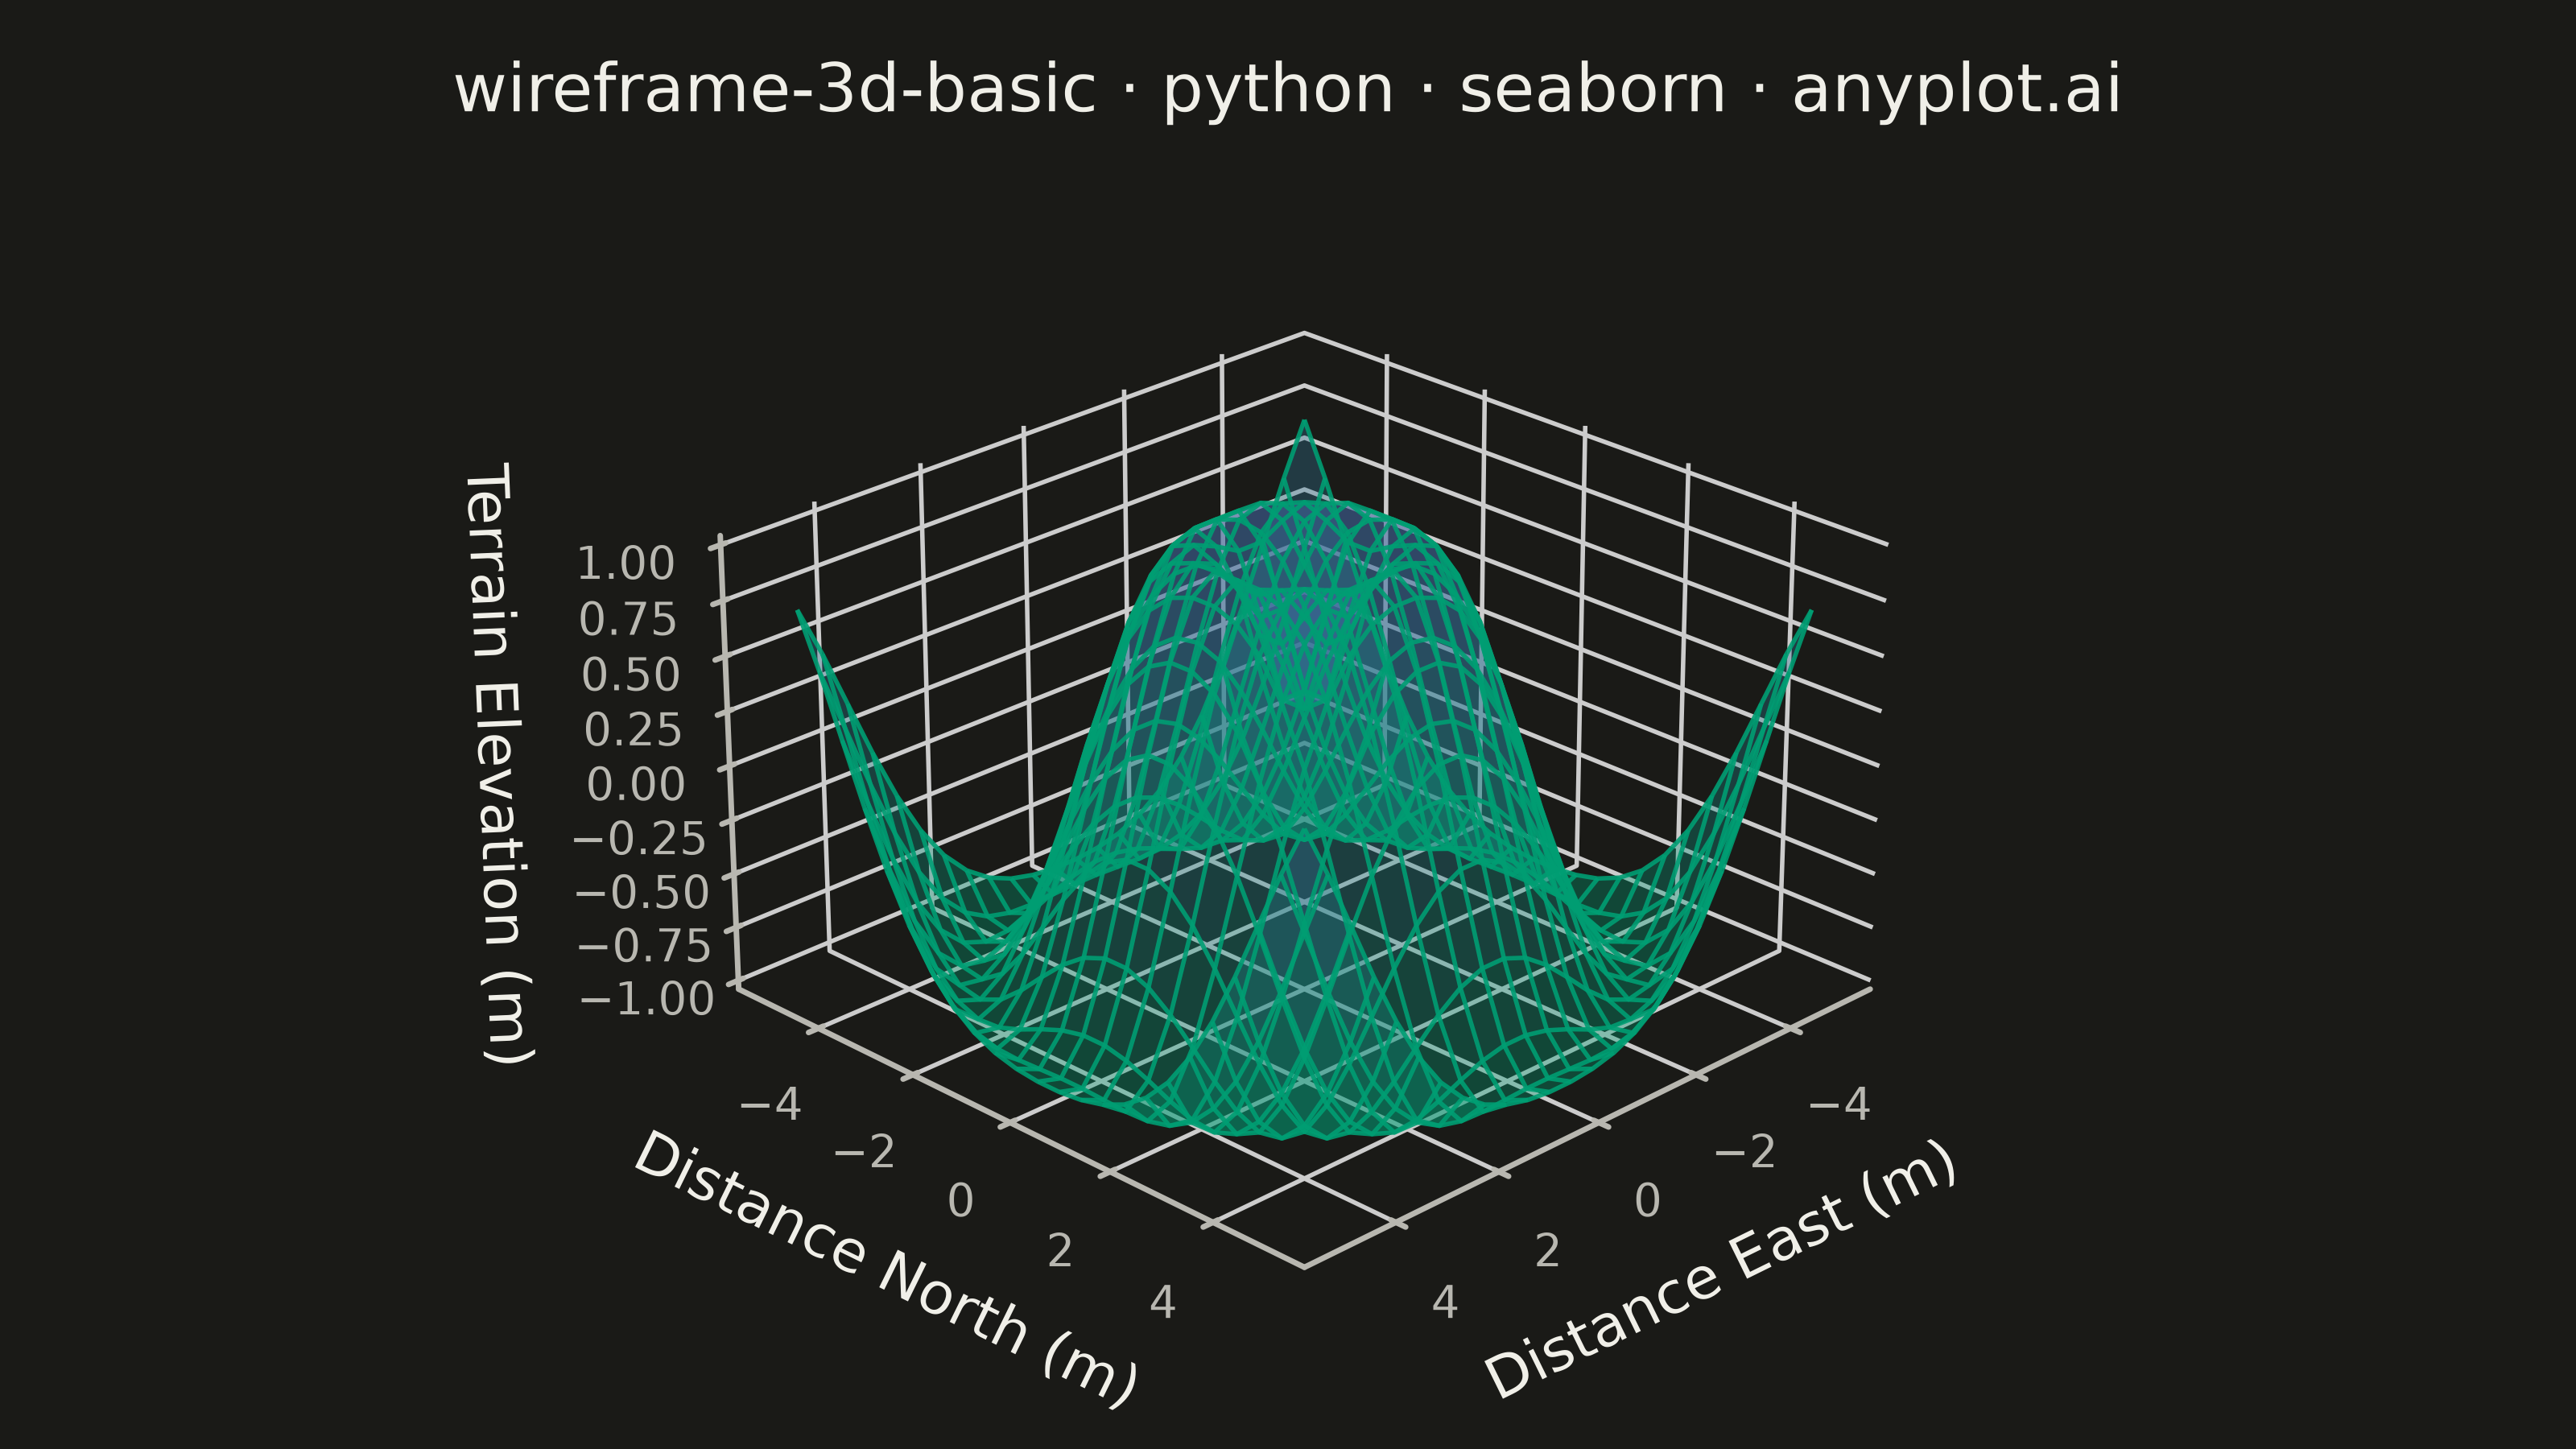
A 3D wireframe plot displays a mathematical surface as a mesh of lines connecting grid points in three-dimensional space. Unlike solid surface plots, wireframes render only the edges between grid points, creating a see-through visualization that reveals the underlying structure and allows viewing parts of the surface that would otherwise be hidden. This makes wireframes ideal for understanding the topology and shape of 3D functions.
""" anyplot.ai
wireframe-3d-basic: Basic 3D Wireframe Plot
Library: seaborn 0.13.2 | Python 3.13.14
Quality: 83/100 | Updated: 2026-08-04
"""

import sys


sys.path = [p for p in sys.path if "implementations/python" not in p and p not in ("", ".")]

import os

import matplotlib.pyplot as plt
import numpy as np
import seaborn as sns
from matplotlib.colors import LinearSegmentedColormap


# Theme tokens
THEME = os.getenv("ANYPLOT_THEME", "light")
PAGE_BG = "#FAF8F1" if THEME == "light" else "#1A1A17"
INK = "#1A1A17" if THEME == "light" else "#F0EFE8"
INK_SOFT = "#4A4A44" if THEME == "light" else "#B8B7B0"
BRAND = "#009E73"

sns.set_theme(
    style="ticks",
    rc={
        "figure.facecolor": PAGE_BG,
        "axes.facecolor": PAGE_BG,
        "axes.edgecolor": INK_SOFT,
        "axes.labelcolor": INK,
        "text.color": INK,
        "xtick.color": INK_SOFT,
        "ytick.color": INK_SOFT,
    },
)

# Imprint sequential colormap (brand green -> blue) for height-based shading
imprint_seq = LinearSegmentedColormap.from_list("imprint_seq", [BRAND, "#4467A3"])

# Data - terrain ripple surface (24x24 keeps the mesh legible at the central peak)
np.random.seed(42)
x = np.linspace(-5, 5, 24)
y = np.linspace(-5, 5, 24)
X, Y = np.meshgrid(x, y)
R = np.sqrt(X**2 + Y**2)
Z = np.sin(R)

# Plot
fig = plt.figure(figsize=(8, 4.5), dpi=400)
fig.patch.set_facecolor(PAGE_BG)
ax = fig.add_subplot(111, projection="3d", facecolor=PAGE_BG)
ax.set_box_aspect((1.3, 1.3, 0.8))

# Faint height-mapped surface for depth cues, crisp wireframe on top for structure
ax.plot_surface(X, Y, Z, cmap=imprint_seq, alpha=0.35, linewidth=0, antialiased=True, shade=False)
ax.plot_wireframe(X, Y, Z, color=BRAND, linewidth=1.0, alpha=0.9, antialiased=True)

# Style
ax.set_xlabel("Distance East (m)", fontsize=13, color=INK, labelpad=8)
ax.set_ylabel("Distance North (m)", fontsize=13, color=INK, labelpad=8)
ax.set_zlabel("Terrain Elevation (m)", fontsize=13, color=INK, labelpad=8)
ax.set_title("wireframe-3d-basic · python · seaborn · anyplot.ai", fontsize=15, fontweight="medium", color=INK, pad=14)

# Tick styling
ax.tick_params(axis="x", labelsize=10, colors=INK_SOFT)
ax.tick_params(axis="y", labelsize=10, colors=INK_SOFT)
ax.tick_params(axis="z", labelsize=10, colors=INK_SOFT)

# Perspective: elevation angle emphasizes surface topology
ax.view_init(elev=25, azim=45)
ax.grid(True, alpha=0.08, linewidth=0.6, color=INK_SOFT)

# Pane styling: minimize edges for cleaner appearance
ax.xaxis.pane.set_facecolor(PAGE_BG)
ax.yaxis.pane.set_facecolor(PAGE_BG)
ax.zaxis.pane.set_facecolor(PAGE_BG)
for pane in [ax.xaxis.pane, ax.yaxis.pane, ax.zaxis.pane]:
    pane.set_edgecolor("none")
    pane.set_alpha(0.0)

# Tighten margins so the mesh fills more of the 3200x1800 canvas
fig.subplots_adjust(left=0.02, right=0.98, top=0.88, bottom=0.04)

# Save — bbox_inches must stay default (None); "tight" silently trims the canvas
plt.savefig(f"plot-{THEME}.png", dpi=400, facecolor=PAGE_BG, edgecolor="none")
Runnable source as JSON, for any HTTP client: https://api.anyplot.ai/specs/wireframe-3d-basic/seaborn/code. Any spec id and library id listed in llms-full.txt fit the same URL shape; every URL below is complete and callable.
{
  "spec_id": "wireframe-3d-basic",
  "language": "python",
  "library": "seaborn",
  "page": "https://anyplot.ai/wireframe-3d-basic/python/seaborn",
  "hub": "https://anyplot.ai/wireframe-3d-basic",
  "code_json": "https://api.anyplot.ai/specs/wireframe-3d-basic/seaborn/code",
  "spec_json": "https://api.anyplot.ai/specs/wireframe-3d-basic",
  "render_light_png": "https://storage.googleapis.com/anyplot-images/plots/wireframe-3d-basic/python/seaborn/plot-light.png",
  "render_dark_png": "https://storage.googleapis.com/anyplot-images/plots/wireframe-3d-basic/python/seaborn/plot-dark.png",
  "quality_score": 83.0,
  "license": "MIT",
  "guide": "https://anyplot.ai/llms.txt"
}
Part of Basic 3D Wireframe Plot on anyplot.ai.