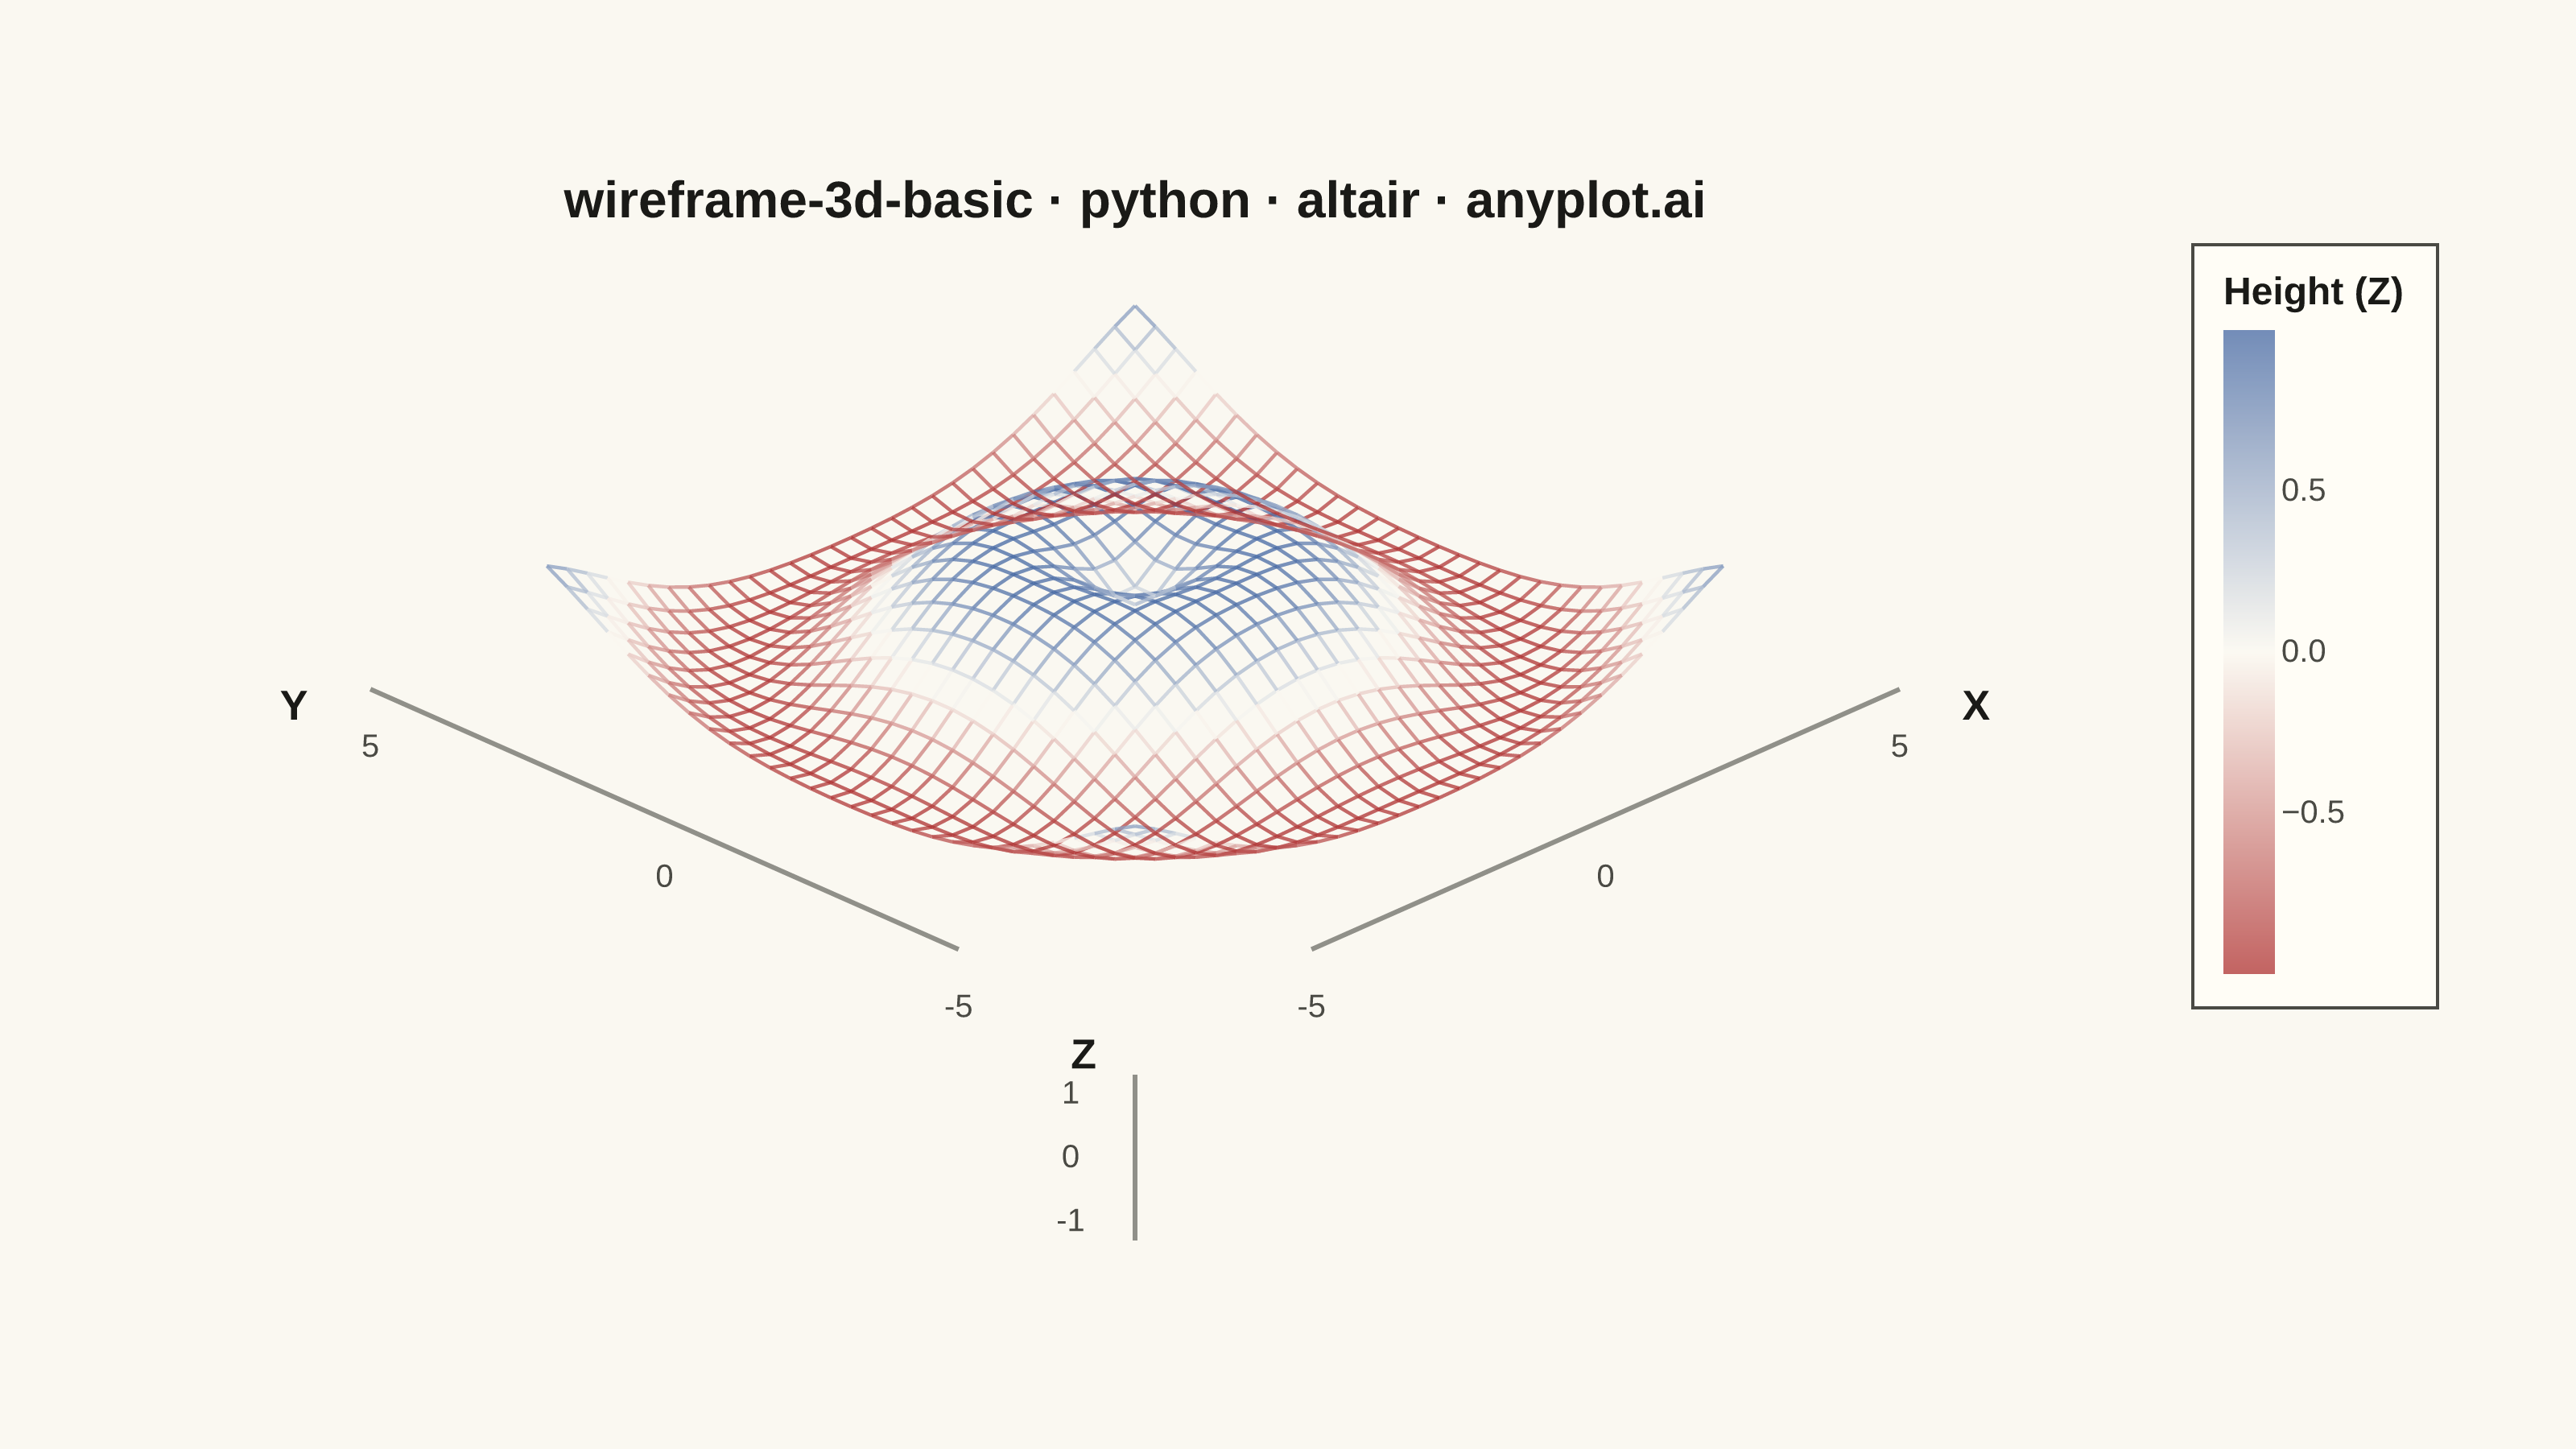
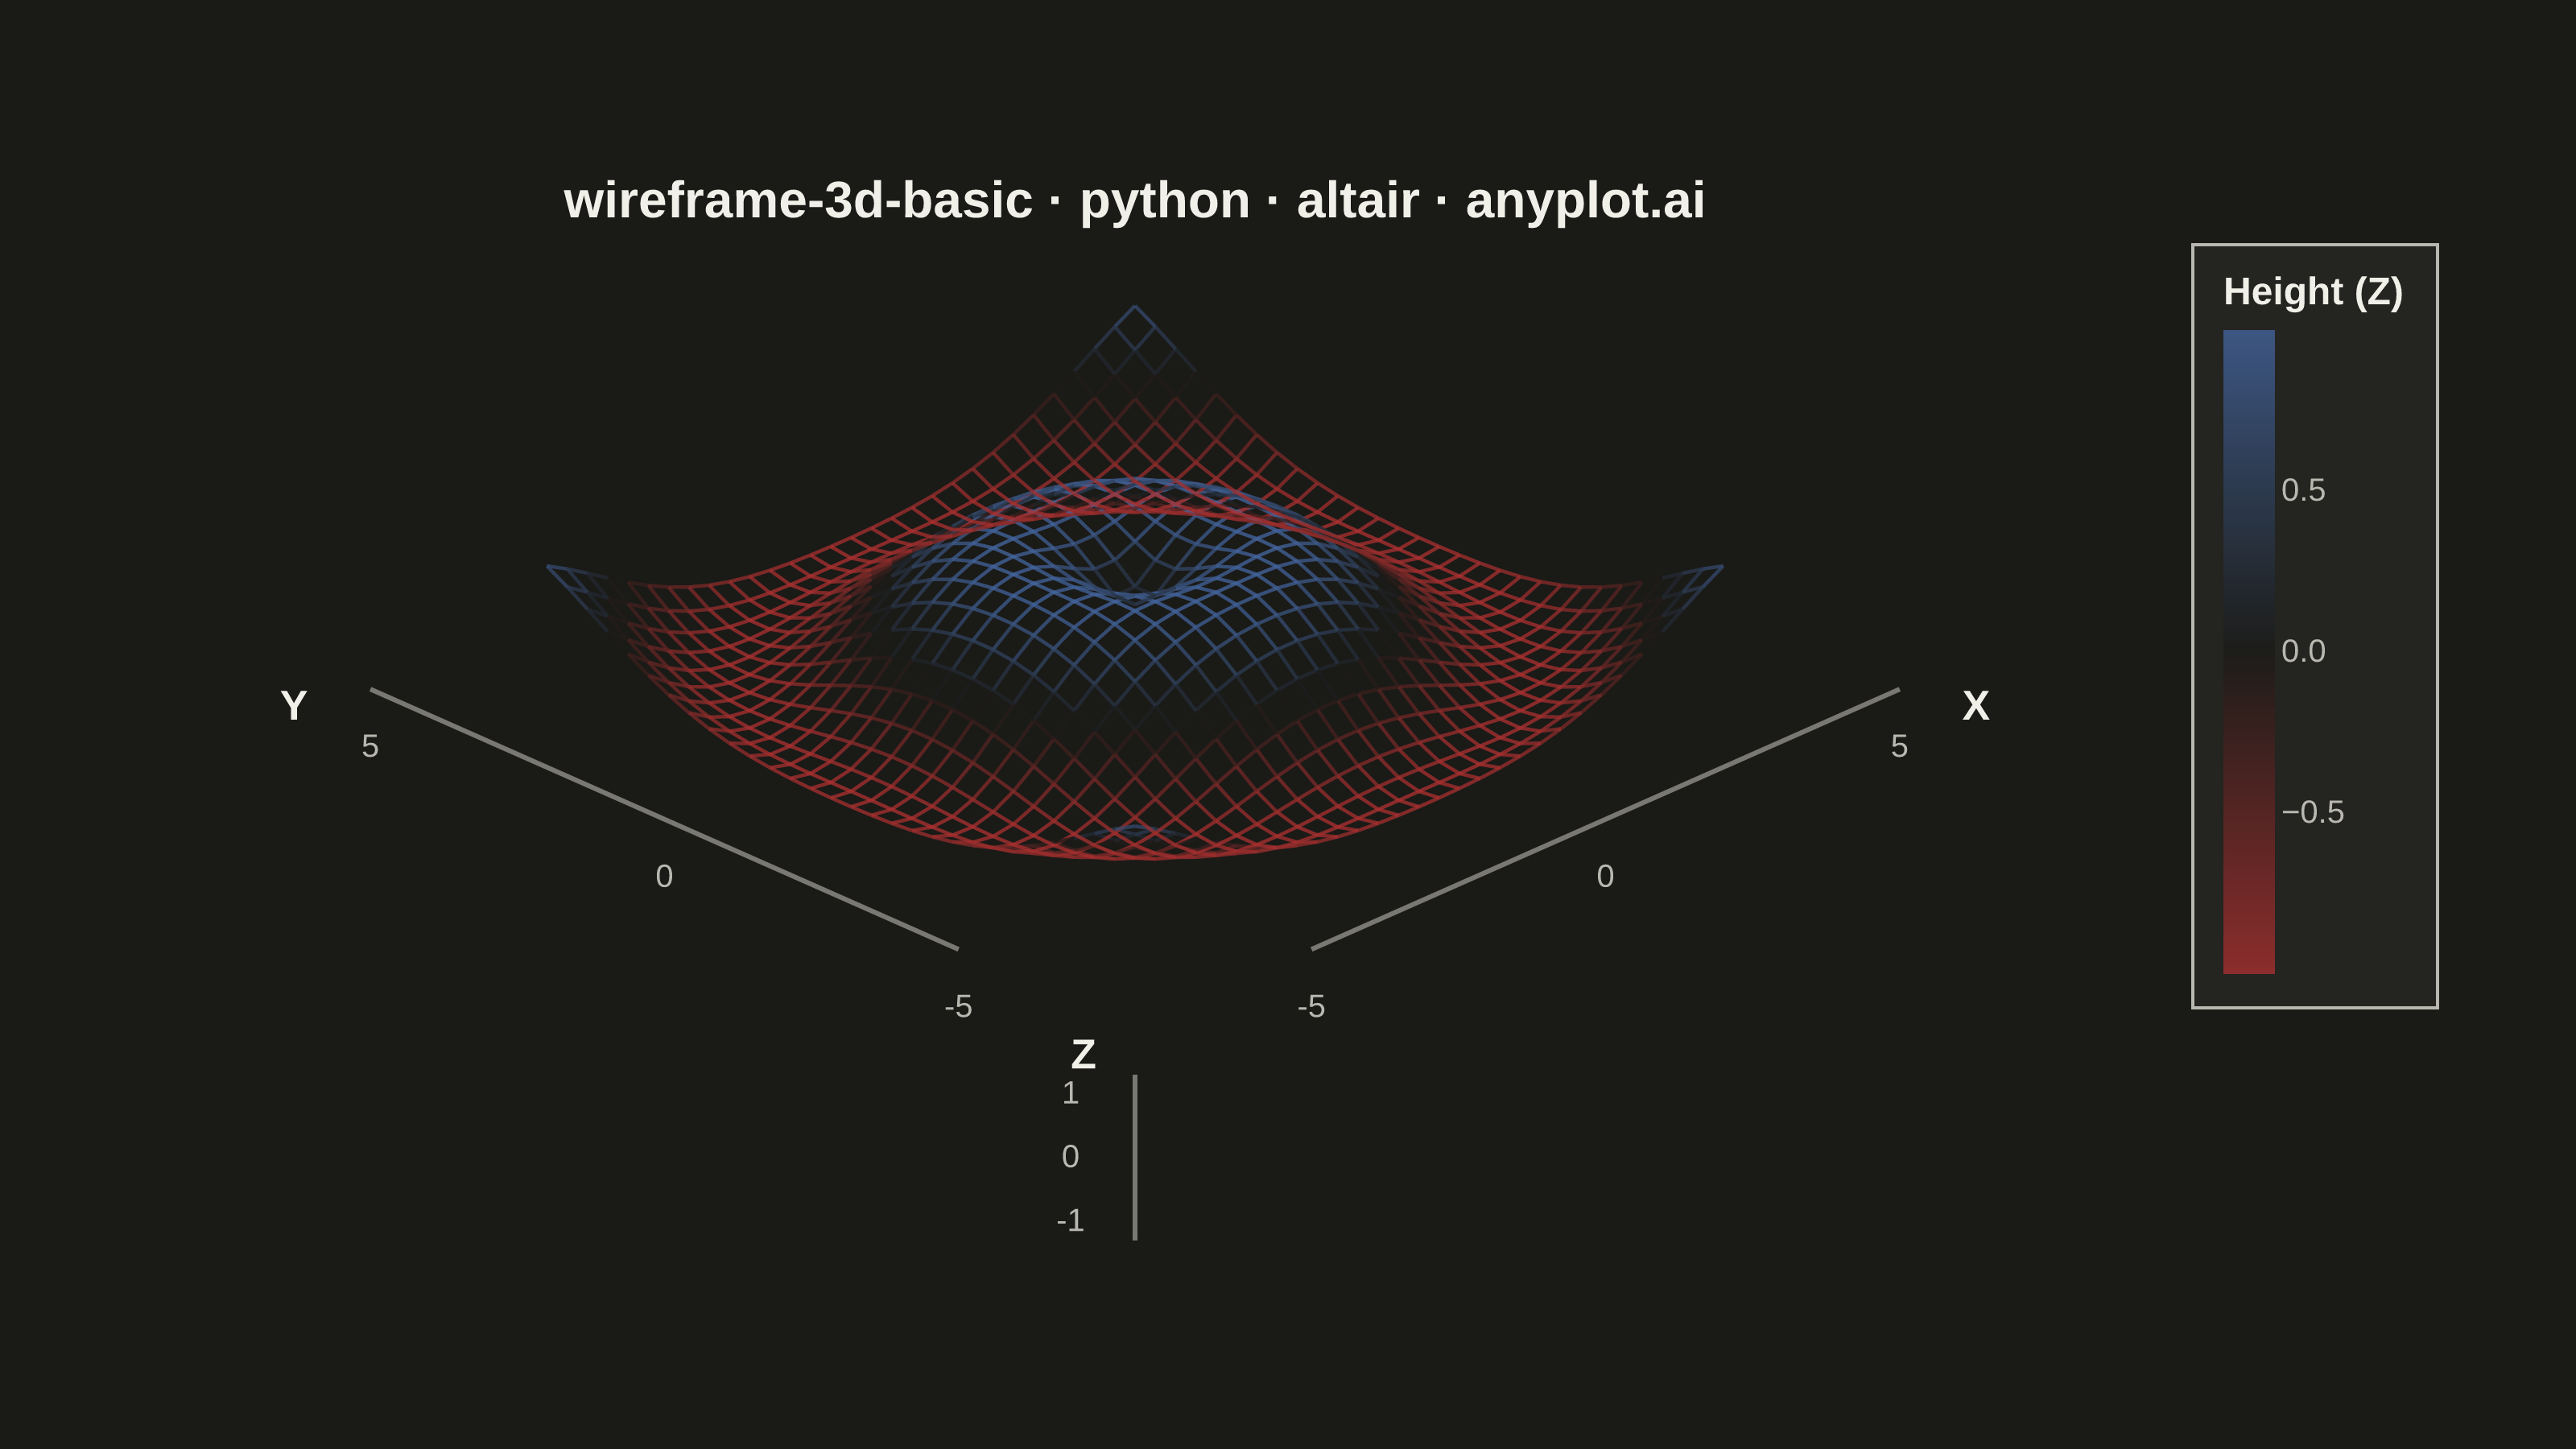
A 3D wireframe plot displays a mathematical surface as a mesh of lines connecting grid points in three-dimensional space. Unlike solid surface plots, wireframes render only the edges between grid points, creating a see-through visualization that reveals the underlying structure and allows viewing parts of the surface that would otherwise be hidden. This makes wireframes ideal for understanding the topology and shape of 3D functions.
""" anyplot.ai
wireframe-3d-basic: Basic 3D Wireframe Plot
Library: altair 6.2.2 | Python 3.13.14
Quality: 87/100 | Updated: 2026-08-04
"""

import os
import sys


# Prevent self-import: this file is named altair.py, so remove its directory
# from sys.path before importing the altair package.
_this_dir = os.path.dirname(os.path.abspath(__file__))
sys.path = [p for p in sys.path if p and os.path.abspath(p) != _this_dir]

import altair as alt
import numpy as np
import pandas as pd
from PIL import Image


# Theme
THEME = os.getenv("ANYPLOT_THEME", "light")
PAGE_BG = "#FAF8F1" if THEME == "light" else "#1A1A17"
ELEVATED_BG = "#FFFDF6" if THEME == "light" else "#242420"
INK = "#1A1A17" if THEME == "light" else "#F0EFE8"
INK_SOFT = "#4A4A44" if THEME == "light" else "#B8B7B0"
DIV_MID = "#FAF8F1" if THEME == "light" else "#1A1A17"  # Imprint diverging-cmap midpoint

# Data - ripple surface z = sin(sqrt(x^2 + y^2))
grid_size = 30
x_vals = np.linspace(-5, 5, grid_size)
y_vals = np.linspace(-5, 5, grid_size)
X_grid, Y_grid = np.meshgrid(x_vals, y_vals)
Z = np.sin(np.sqrt(X_grid**2 + Y_grid**2))


def isometric_projection(x, y, z, elevation=30, azimuth=45):
    """Project 3D coordinates to 2D using an isometric view."""
    el_rad, az_rad = np.radians(elevation), np.radians(azimuth)
    cos_el, sin_el = np.cos(el_rad), np.sin(el_rad)
    cos_az, sin_az = np.cos(az_rad), np.sin(az_rad)
    x_2d = x * cos_az - y * sin_az
    y_2d = (x * sin_az + y * cos_az) * sin_el + z * cos_el
    return x_2d, y_2d


x_proj, y_proj = isometric_projection(X_grid, Y_grid, Z)

# Wireframe edges - mesh lines along both grid directions
lines_data = []
for i in range(grid_size):
    for j in range(grid_size - 1):
        lines_data.append(
            {
                "x_proj": x_proj[i, j],
                "y_proj": y_proj[i, j],
                "x_proj_next": x_proj[i, j + 1],
                "y_proj_next": y_proj[i, j + 1],
                "z": (Z[i, j] + Z[i, j + 1]) / 2,
            }
        )
for i in range(grid_size - 1):
    for j in range(grid_size):
        lines_data.append(
            {
                "x_proj": x_proj[i, j],
                "y_proj": y_proj[i, j],
                "x_proj_next": x_proj[i + 1, j],
                "y_proj_next": y_proj[i + 1, j],
                "z": (Z[i, j] + Z[i + 1, j]) / 2,
            }
        )
mesh_df = pd.DataFrame(lines_data)

# X/Y reference axes - offset outside the mesh footprint so they read cleanly.
# Z gets its own, farther-out corner (AXIS_OFFSET_Z) so its ladder doesn't land
# on top of the X-axis "0" and Y-axis "0" ticks and crowd the shared corner.
AXIS_OFFSET = -8
AXIS_OFFSET_Z = AXIS_OFFSET - 2.5
axis_lines = []
xp0, yp0 = isometric_projection(-5, AXIS_OFFSET, 0)
xp1, yp1 = isometric_projection(5, AXIS_OFFSET, 0)
axis_lines.append({"x_proj": xp0, "y_proj": yp0, "x_proj_next": xp1, "y_proj_next": yp1})
xp0, yp0 = isometric_projection(AXIS_OFFSET, -5, 0)
xp1, yp1 = isometric_projection(AXIS_OFFSET, 5, 0)
axis_lines.append({"x_proj": xp0, "y_proj": yp0, "x_proj_next": xp1, "y_proj_next": yp1})
axis_df = pd.DataFrame(axis_lines)

# Tick marks (-5, 0, 5) along each reference axis
ticks = []
for t in (-5, 0, 5):
    xp, yp = isometric_projection(t, AXIS_OFFSET, 0)
    ticks.append({"x_proj": xp, "y_proj": yp, "label": str(t)})
for t in (-5, 0, 5):
    xp, yp = isometric_projection(AXIS_OFFSET, t, 0)
    ticks.append({"x_proj": xp, "y_proj": yp, "label": str(t)})
ticks_df = pd.DataFrame(ticks)

# Axis name labels at the tip of each reference axis
xp, yp = isometric_projection(6.3, AXIS_OFFSET, 0)
axis_x_name = pd.DataFrame([{"x_proj": xp, "y_proj": yp, "label": "X"}])
xp, yp = isometric_projection(AXIS_OFFSET, 6.3, 0)
axis_y_name = pd.DataFrame([{"x_proj": xp, "y_proj": yp, "label": "Y"}])

# Z reference axis - vertical tick ladder at its own farther-out corner
# (AXIS_OFFSET_Z) so Z gets real spatial ticks like X and Y, without
# clustering on top of the X-axis "0" / Y-axis "0" tick labels
xp0, yp0 = isometric_projection(AXIS_OFFSET_Z, AXIS_OFFSET_Z, -1.3)
xp1, yp1 = isometric_projection(AXIS_OFFSET_Z, AXIS_OFFSET_Z, 1.3)
z_axis_df = pd.DataFrame([{"x_proj": xp0, "y_proj": yp0, "x_proj_next": xp1, "y_proj_next": yp1}])

z_ticks = []
for t in (-1, 0, 1):
    xp, yp = isometric_projection(AXIS_OFFSET_Z, AXIS_OFFSET_Z, t)
    z_ticks.append({"x_proj": xp, "y_proj": yp, "label": str(t)})
z_ticks_df = pd.DataFrame(z_ticks)

xp, yp = isometric_projection(AXIS_OFFSET_Z, AXIS_OFFSET_Z, 1.6)
axis_z_name = pd.DataFrame([{"x_proj": xp, "y_proj": yp, "label": "Z"}])

title = "wireframe-3d-basic · python · altair · anyplot.ai"

# Wireframe mesh - height (Z) mapped through the Imprint diverging cmap since
# the ripple surface oscillates around 0 (troughs vs. peaks)
mesh = (
    alt.Chart(mesh_df)
    .mark_line(strokeWidth=1.1, opacity=0.75)
    .encode(
        x=alt.X("x_proj:Q", axis=None),
        y=alt.Y("y_proj:Q", axis=None),
        x2="x_proj_next:Q",
        y2="y_proj_next:Q",
        color=alt.Color(
            "z:Q",
            scale=alt.Scale(range=["#AE3030", DIV_MID, "#4467A3"], domainMid=0, interpolate="rgb"),
            title="Height (Z)",
        ),
    )
)

axes = (
    alt.Chart(pd.concat([axis_df, z_axis_df], ignore_index=True))
    .mark_line(strokeWidth=1.5, color=INK_SOFT, opacity=0.6)
    .encode(x=alt.X("x_proj:Q", axis=None), y=alt.Y("y_proj:Q", axis=None), x2="x_proj_next:Q", y2="y_proj_next:Q")
)

tick_labels = (
    alt.Chart(ticks_df)
    .mark_text(fontSize=10, color=INK_SOFT, dy=18)
    .encode(x=alt.X("x_proj:Q", axis=None), y=alt.Y("y_proj:Q", axis=None), text="label:N")
)

# Z ticks sit on a near-vertical axis line at its own farther-out corner, so
# offset horizontally (dx) rather than vertically (dy) like the X/Y ticks.
z_tick_labels = (
    alt.Chart(z_ticks_df)
    .mark_text(fontSize=10, color=INK_SOFT, dx=-20)
    .encode(x=alt.X("x_proj:Q", axis=None), y=alt.Y("y_proj:Q", axis=None), text="label:N")
)

axis_names = (
    alt.Chart(pd.concat([axis_x_name, axis_y_name], ignore_index=True))
    .mark_text(fontSize=13, fontWeight="bold", color=INK, dy=16)
    .encode(x=alt.X("x_proj:Q", axis=None), y=alt.Y("y_proj:Q", axis=None), text="label:N")
)

z_axis_name = (
    alt.Chart(axis_z_name)
    .mark_text(fontSize=13, fontWeight="bold", color=INK, dx=-16)
    .encode(x=alt.X("x_proj:Q", axis=None), y=alt.Y("y_proj:Q", axis=None), text="label:N")
)

chart = (
    alt.layer(mesh, axes, tick_labels, z_tick_labels, axis_names, z_axis_name)
    .properties(width=620, height=320, background=PAGE_BG, title=alt.Title(title, fontSize=16))
    .configure_view(continuousWidth=620, continuousHeight=320, fill=PAGE_BG, strokeWidth=0)
    .configure_title(color=INK)
    .configure_legend(
        fillColor=ELEVATED_BG,
        strokeColor=INK_SOFT,
        labelColor=INK_SOFT,
        titleColor=INK,
        labelFontSize=10,
        titleFontSize=12,
        padding=10,
    )
)

# Save PNG
chart.save(f"plot-{THEME}.png", scale_factor=4.0)

# Pad to exact 3200x1800
TW, TH = 3200, 1800
_img = Image.open(f"plot-{THEME}.png").convert("RGB")
_w, _h = _img.size
if _w > TW or _h > TH:
    raise SystemExit(
        f"altair vl-convert produced {_w}×{_h}, exceeds target {TW}×{TH}. "
        f"Shrink chart .properties(width=, height=) values and re-render."
    )
if _w < TW or _h < TH:
    _canvas = Image.new("RGB", (TW, TH), PAGE_BG)
    _canvas.paste(_img, ((TW - _w) // 2, (TH - _h) // 2))
    _canvas.save(f"plot-{THEME}.png")

# Save HTML
chart.save(f"plot-{THEME}.html")
Runnable source as JSON, for any HTTP client: https://api.anyplot.ai/specs/wireframe-3d-basic/altair/code. Any spec id and library id listed in llms-full.txt fit the same URL shape; every URL below is complete and callable.
{
  "spec_id": "wireframe-3d-basic",
  "language": "python",
  "library": "altair",
  "page": "https://anyplot.ai/wireframe-3d-basic/python/altair",
  "hub": "https://anyplot.ai/wireframe-3d-basic",
  "code_json": "https://api.anyplot.ai/specs/wireframe-3d-basic/altair/code",
  "spec_json": "https://api.anyplot.ai/specs/wireframe-3d-basic",
  "render_light_png": "https://storage.googleapis.com/anyplot-images/plots/wireframe-3d-basic/python/altair/plot-light.png",
  "render_dark_png": "https://storage.googleapis.com/anyplot-images/plots/wireframe-3d-basic/python/altair/plot-dark.png",
  "interactive_light_html": "https://storage.googleapis.com/anyplot-images/plots/wireframe-3d-basic/python/altair/plot-light.html",
  "interactive_dark_html": "https://storage.googleapis.com/anyplot-images/plots/wireframe-3d-basic/python/altair/plot-dark.html",
  "quality_score": 87.0,
  "license": "MIT",
  "guide": "https://anyplot.ai/llms.txt"
}
Part of Basic 3D Wireframe Plot on anyplot.ai.