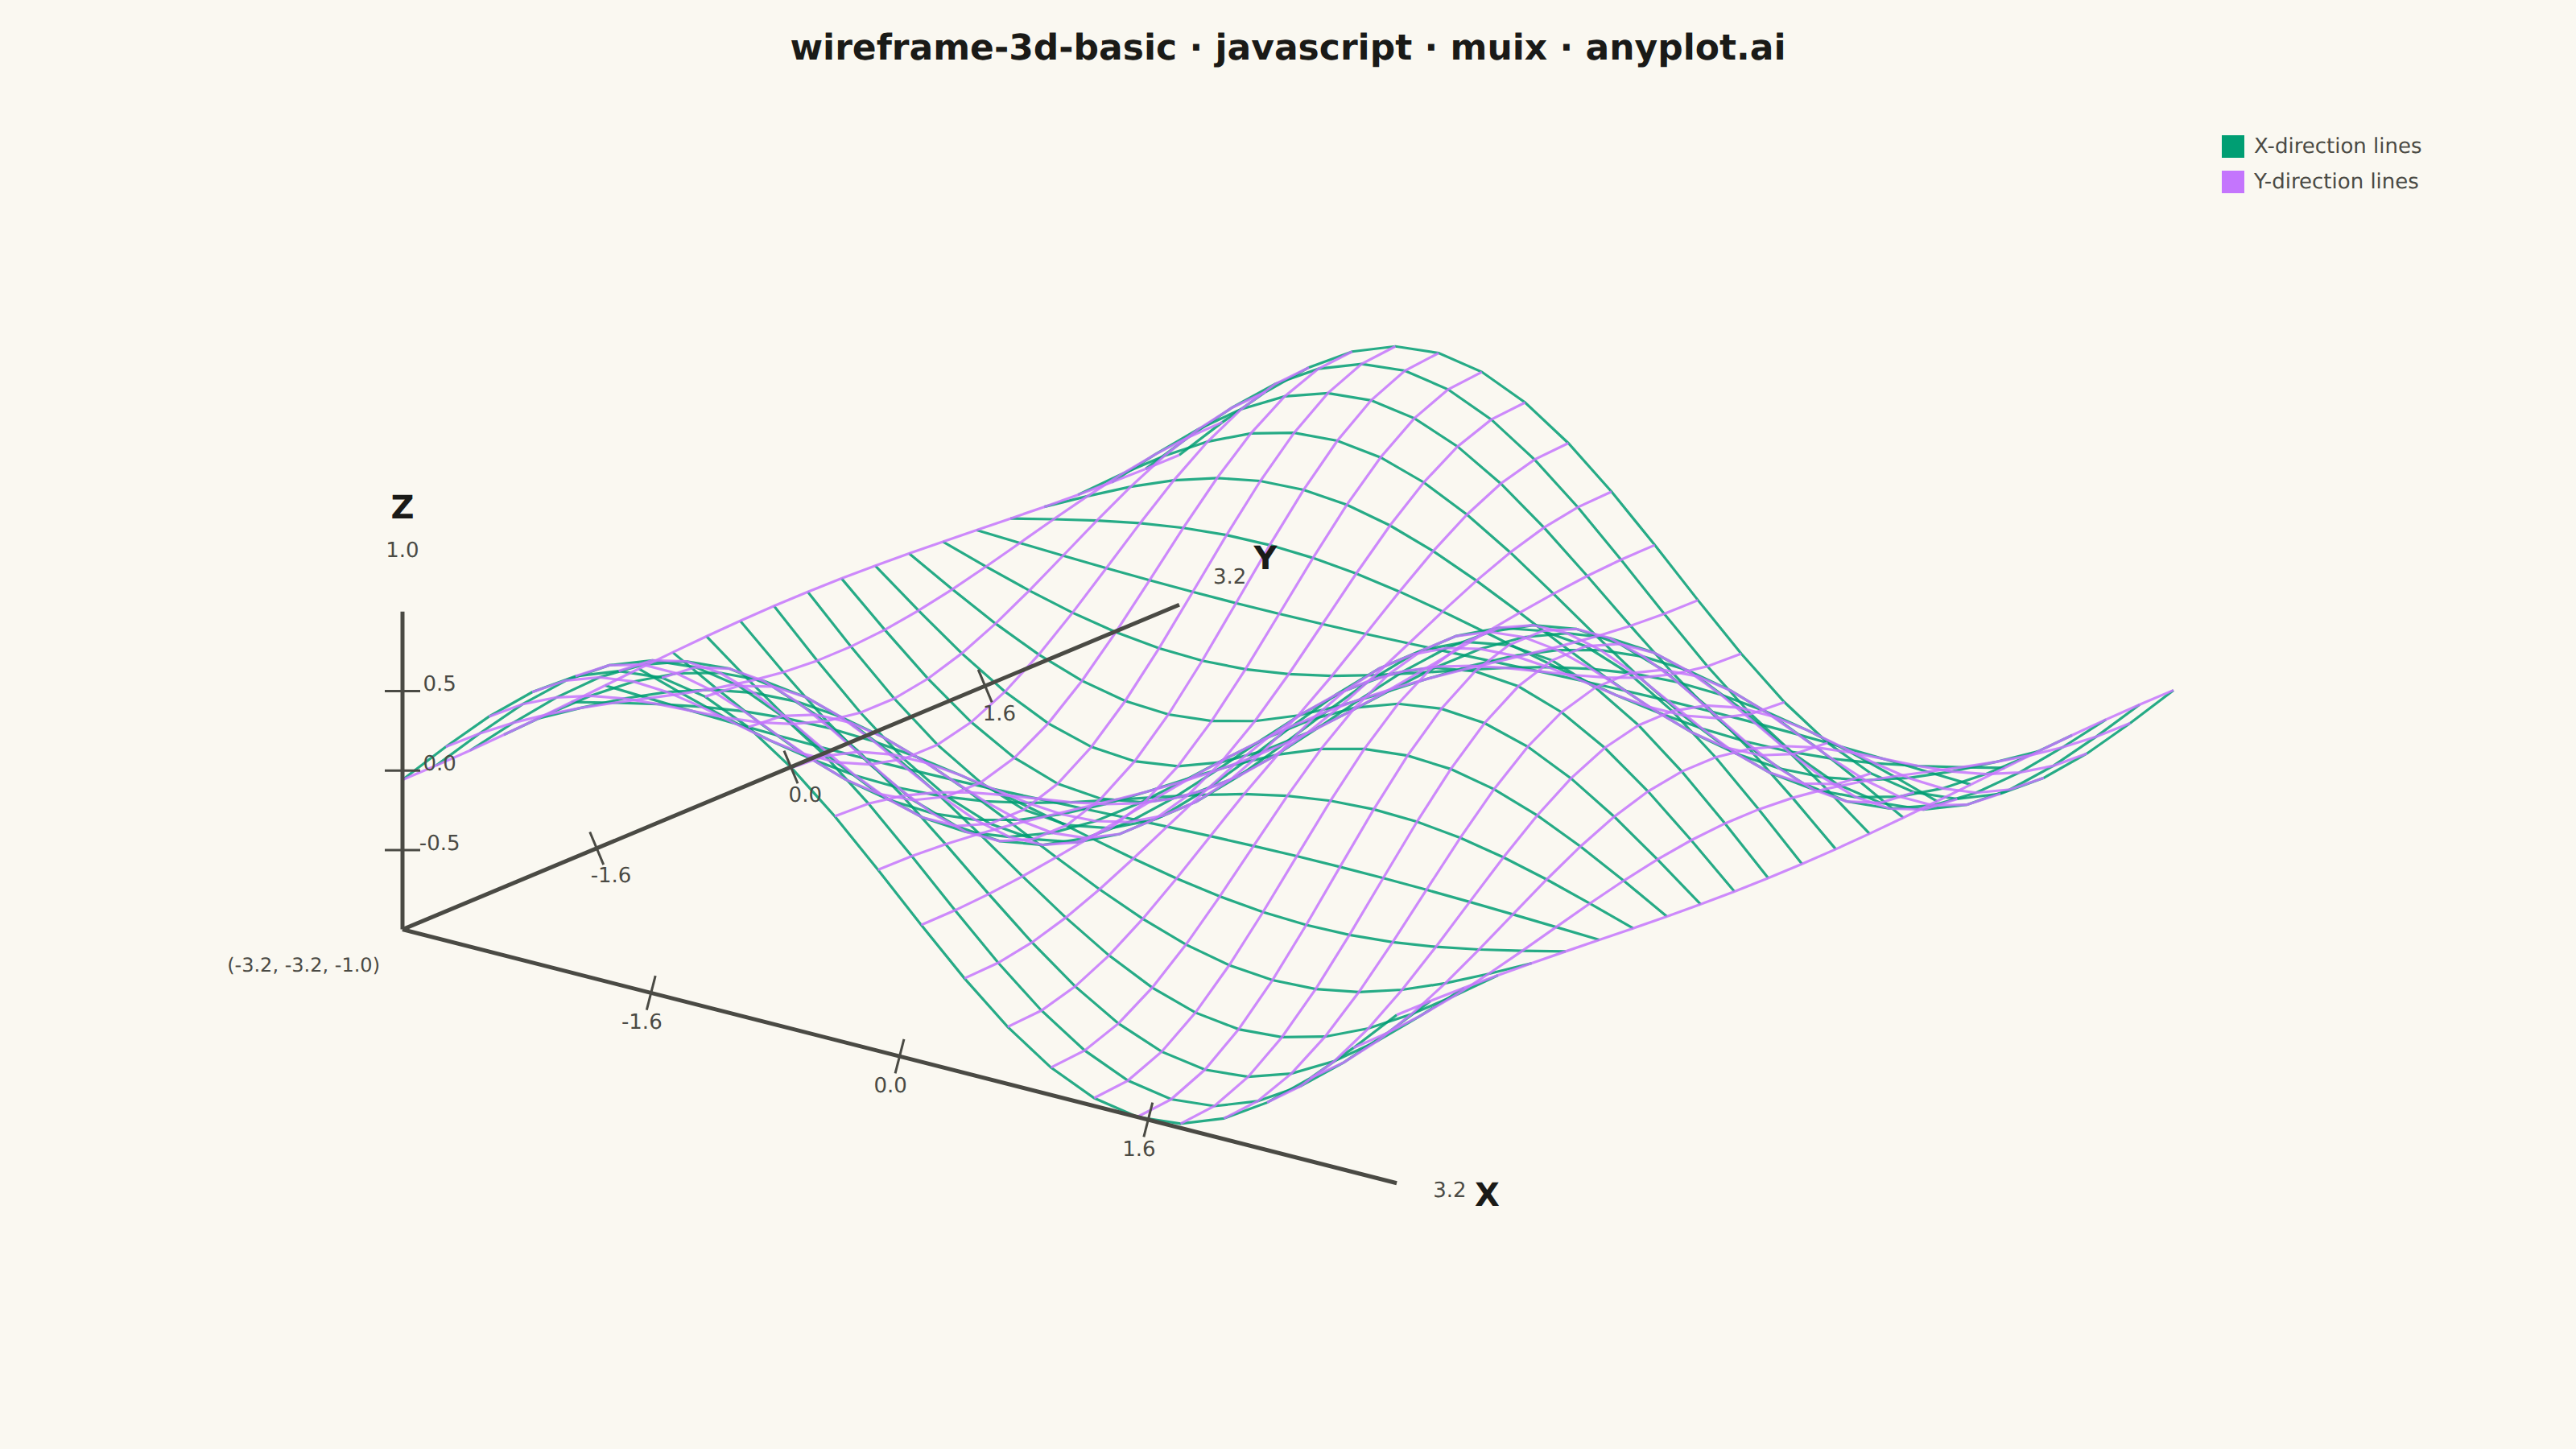
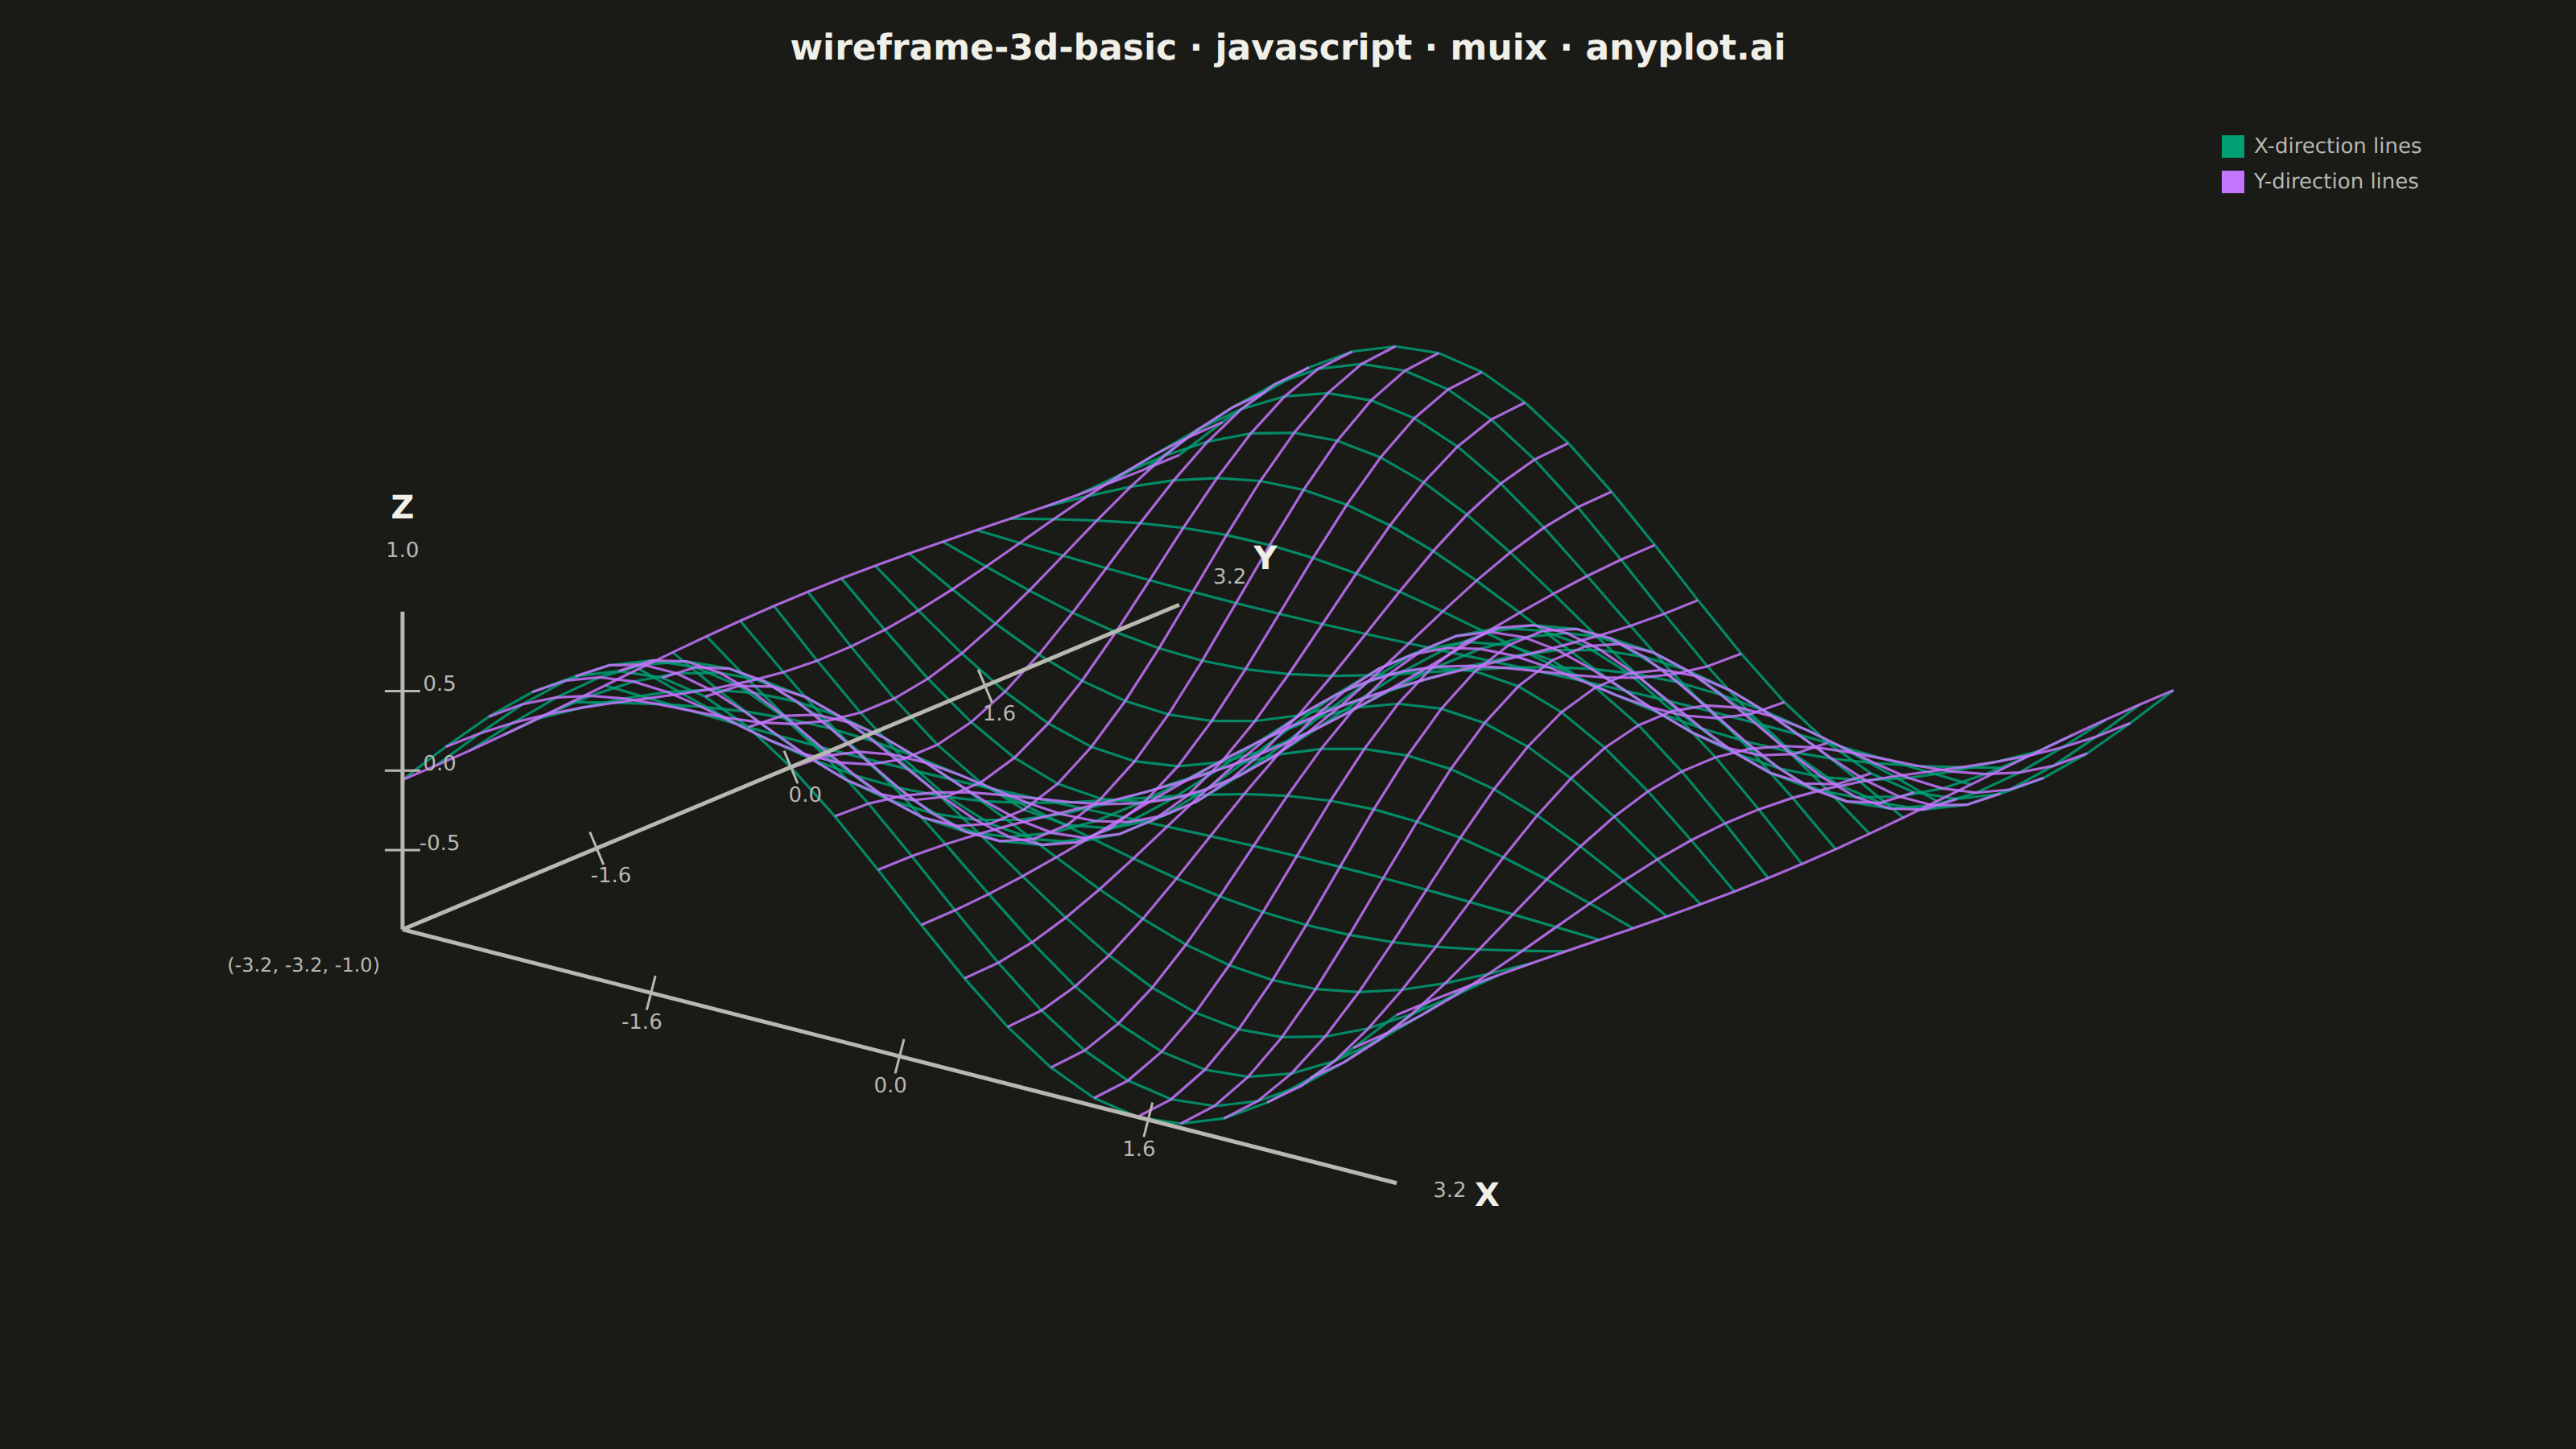
A 3D wireframe plot displays a mathematical surface as a mesh of lines connecting grid points in three-dimensional space. Unlike solid surface plots, wireframes render only the edges between grid points, creating a see-through visualization that reveals the underlying structure and allows viewing parts of the surface that would otherwise be hidden. This makes wireframes ideal for understanding the topology and shape of 3D functions.
// anyplot.ai
// wireframe-3d-basic: Basic 3D Wireframe Plot
// Library: muix 7.29.1 | JavaScript 22.23.1
// Quality: 82/100 | Created: 2026-08-04
//# anyplot-orientation: landscape
// anyplot.ai
// wireframe-3d-basic: Basic 3D Wireframe Plot
// Library: MUI X Charts | React | Node 22
// License: @mui/x-charts — MIT (community). Pro/Premium are out of scope.
// Quality: pending | Created: 2026-08-04

import { ChartContainer } from "@mui/x-charts/ChartContainer";
import { useDrawingArea } from "@mui/x-charts/hooks";

const t = window.ANYPLOT_TOKENS;

// --- Data: wave surface z = sin(x) · cos(y) over a 24x24 grid ---------------
const GRID_N = 24;
const AXIS_MIN = -3.2;
const AXIS_MAX = 3.2;

const grid: number[] = [];
for (let i = 0; i < GRID_N; i++) {
  grid.push(AXIS_MIN + ((AXIS_MAX - AXIS_MIN) * i) / (GRID_N - 1));
}

// height[i][j] at (x = grid[i], y = grid[j])
const height: number[][] = grid.map((x) => grid.map((y) => Math.sin(x) * Math.cos(y)));
const heightFlat = height.flat();
const Z_MIN = Math.min(...heightFlat);
const Z_MAX = Math.max(...heightFlat);

// --- 3D -> 2D axonometric projection (elevation 22°, azimuth -38°) ---------
const ELEV = (22 * Math.PI) / 180;
const AZIM = (-38 * Math.PI) / 180;

function project(x: number, y: number, z: number) {
  const xRot = x * Math.cos(AZIM) - y * Math.sin(AZIM);
  const yRot = x * Math.sin(AZIM) + y * Math.cos(AZIM);
  return { sx: xRot, sy: yRot * Math.sin(ELEV) + z * Math.cos(ELEV) };
}

// Two line families satisfy "grid lines in both x and y directions": lines
// that trace along x (each at one fixed y), and lines that trace along y
// (each at one fixed x).
const linesAlongX = grid.map((y, j) => grid.map((x, i) => project(x, y, height[i][j])));
const linesAlongY = grid.map((x, i) => grid.map((y, j) => project(x, y, height[i][j])));

// Schematic axis triad anchored at the grid's near corner, mirroring how
// boxed 3D axes pin their tick arms to the bounding-box edges.
const ORIGIN = { x: AXIS_MIN, y: AXIS_MIN, z: Z_MIN };
const AXES = [
  { key: "x", end: { x: AXIS_MAX, y: AXIS_MIN, z: Z_MIN }, from: AXIS_MIN, to: AXIS_MAX, label: "X" },
  { key: "y", end: { x: AXIS_MIN, y: AXIS_MAX, z: Z_MIN }, from: AXIS_MIN, to: AXIS_MAX, label: "Y" },
  { key: "z", end: { x: AXIS_MIN, y: AXIS_MIN, z: Z_MAX }, from: Z_MIN, to: Z_MAX, label: "Z" },
];

// Bounding box of every projected point (mesh + axis arms), padded so labels
// clear the SVG edges.
const allPoints = [
  ...linesAlongX.flat(),
  ...linesAlongY.flat(),
  project(ORIGIN.x, ORIGIN.y, ORIGIN.z),
  ...AXES.map((a) => project(a.end.x, a.end.y, a.end.z)),
];
const SX_MIN = Math.min(...allPoints.map((p) => p.sx));
const SX_MAX = Math.max(...allPoints.map((p) => p.sx));
const SY_MIN = Math.min(...allPoints.map((p) => p.sy));
const SY_MAX = Math.max(...allPoints.map((p) => p.sy));
const PAD_X = (SX_MAX - SX_MIN) * 0.2;
const PAD_Y = (SY_MAX - SY_MIN) * 0.26;

const TITLE_H = 60;

// Custom overlay: maps projected (sx, sy) into the ChartContainer's drawing
// area and paints the mesh + axis triad as plain SVG — the composition
// pattern MUI X documents for chart types the built-in series don't cover.
function Wireframe() {
  const { left, top, width, height: areaHeight } = useDrawingArea();
  const xOf = (sx: number) => left + ((sx - (SX_MIN - PAD_X)) / (SX_MAX + PAD_X - (SX_MIN - PAD_X))) * width;
  const yOf = (sy: number) =>
    top + areaHeight - ((sy - (SY_MIN - PAD_Y)) / (SY_MAX + PAD_Y - (SY_MIN - PAD_Y))) * areaHeight;

  const toPolyline = (pts: { sx: number; sy: number }[]) => pts.map((p) => `${xOf(p.sx)},${yOf(p.sy)}`).join(" ");

  const origin2d = project(ORIGIN.x, ORIGIN.y, ORIGIN.z);
  const originPx = { x: xOf(origin2d.sx), y: yOf(origin2d.sy) };

  return (
    <g>
      {linesAlongX.map((line, idx) => (
        <polyline
          key={`x-${idx}`}
          points={toPolyline(line)}
          fill="none"
          stroke={t.palette[0]}
          strokeWidth={1.6}
          opacity={0.85}
        />
      ))}
      {linesAlongY.map((line, idx) => (
        <polyline
          key={`y-${idx}`}
          points={toPolyline(line)}
          fill="none"
          stroke={t.palette[1]}
          strokeWidth={1.6}
          opacity={0.85}
        />
      ))}
      {AXES.map((a) => {
        const end2d = project(a.end.x, a.end.y, a.end.z);
        const endPx = { x: xOf(end2d.sx), y: yOf(end2d.sy) };
        const dirX = endPx.x - originPx.x;
        const dirY = endPx.y - originPx.y;
        const len = Math.hypot(dirX, dirY) || 1;
        const unitX = dirX / len;
        const unitY = dirY / len;
        const perpX = -unitY * 11;
        const perpY = unitX * 11;
        // Intermediate ticks at 1/4, 1/2, 3/4 — the min end is shared by all
        // three arms at the corner and gets one combined label below.
        const tickFracs = [0.25, 0.5, 0.75];
        return (
          <g key={a.key}>
            <line x1={originPx.x} y1={originPx.y} x2={endPx.x} y2={endPx.y} stroke={t.inkSoft} strokeWidth={2.5} />
            {tickFracs.map((frac) => {
              const tickValue = a.from + (a.to - a.from) * frac;
              const tickX = originPx.x + dirX * frac;
              const tickY = originPx.y + dirY * frac;
              return (
                <g key={frac}>
                  <line
                    x1={tickX - perpX}
                    y1={tickY - perpY}
                    x2={tickX + perpX}
                    y2={tickY + perpY}
                    stroke={t.inkSoft}
                    strokeWidth={1.5}
                  />
                  <text
                    x={tickX + perpX * 2.1}
                    y={tickY + perpY * 2.1}
                    fill={t.inkSoft}
                    textAnchor="middle"
                    style={{ fontSize: 13, fontFamily: "Inter, system-ui, sans-serif" }}
                  >
                    {tickValue.toFixed(1)}
                  </text>
                </g>
              );
            })}
            <text
              x={endPx.x + unitX * 34}
              y={endPx.y + unitY * 34}
              fill={t.inkSoft}
              textAnchor="middle"
              style={{ fontSize: 13, fontFamily: "Inter, system-ui, sans-serif" }}
            >
              {a.to.toFixed(1)}
            </text>
            <text
              x={endPx.x + unitX * 58}
              y={endPx.y + unitY * 58}
              fill={t.ink}
              textAnchor="middle"
              style={{ fontSize: 20, fontWeight: 700, fontFamily: "Inter, system-ui, sans-serif" }}
            >
              {a.label}
            </text>
          </g>
        );
      })}
      <text
        x={originPx.x - 14}
        y={originPx.y + 26}
        fill={t.inkSoft}
        textAnchor="end"
        style={{ fontSize: 12, fontFamily: "Inter, system-ui, sans-serif" }}
      >
        ({AXIS_MIN.toFixed(1)}, {AXIS_MIN.toFixed(1)}, {Z_MIN.toFixed(1)})
      </text>
      {/* Legend: explain the two mesh line colors (VQ storytelling gap). */}
      <g transform={`translate(${left + width - 190}, ${top + 4})`}>
        <rect x={0} y={0} width={14} height={14} fill={t.palette[0]} />
        <text
          x={20}
          y={11}
          fill={t.inkSoft}
          style={{ fontSize: 13, fontFamily: "Inter, system-ui, sans-serif" }}
        >
          X-direction lines
        </text>
        <rect x={0} y={22} width={14} height={14} fill={t.palette[1]} />
        <text
          x={20}
          y={33}
          fill={t.inkSoft}
          style={{ fontSize: 13, fontFamily: "Inter, system-ui, sans-serif" }}
        >
          Y-direction lines
        </text>
      </g>
    </g>
  );
}

export default function Chart() {
  const W = window.ANYPLOT_SIZE.width;
  const H = window.ANYPLOT_SIZE.height;

  return (
    <div
      style={{
        width: W,
        height: H,
        background: t.pageBg,
        fontFamily: "Inter, system-ui, sans-serif",
        display: "flex",
        flexDirection: "column",
      }}
    >
      <div style={{ height: TITLE_H, display: "flex", alignItems: "center", justifyContent: "center" }}>
        <span style={{ fontSize: 22, fontWeight: 600, color: t.ink }}>
          wireframe-3d-basic · javascript · muix · anyplot.ai
        </span>
      </div>
      <ChartContainer
        width={W}
        height={H - TITLE_H}
        skipAnimation
        series={[]}
        xAxis={[{ min: 0, max: 1 }]}
        yAxis={[{ min: 0, max: 1 }]}
        margin={{ top: 20, bottom: 30, left: 30, right: 30 }}
      >
        <Wireframe />
      </ChartContainer>
    </div>
  );
}
Runnable source as JSON, for any HTTP client: https://api.anyplot.ai/specs/wireframe-3d-basic/muix/code. Any spec id and library id listed in llms-full.txt fit the same URL shape; every URL below is complete and callable.
{
  "spec_id": "wireframe-3d-basic",
  "language": "javascript",
  "library": "muix",
  "page": "https://anyplot.ai/wireframe-3d-basic/javascript/muix",
  "hub": "https://anyplot.ai/wireframe-3d-basic",
  "code_json": "https://api.anyplot.ai/specs/wireframe-3d-basic/muix/code",
  "spec_json": "https://api.anyplot.ai/specs/wireframe-3d-basic",
  "render_light_png": "https://storage.googleapis.com/anyplot-images/plots/wireframe-3d-basic/javascript/muix/plot-light.png",
  "render_dark_png": "https://storage.googleapis.com/anyplot-images/plots/wireframe-3d-basic/javascript/muix/plot-dark.png",
  "interactive_light_html": "https://storage.googleapis.com/anyplot-images/plots/wireframe-3d-basic/javascript/muix/plot-light.html",
  "interactive_dark_html": "https://storage.googleapis.com/anyplot-images/plots/wireframe-3d-basic/javascript/muix/plot-dark.html",
  "quality_score": 82.0,
  "license": "MIT",
  "guide": "https://anyplot.ai/llms.txt"
}
Part of Basic 3D Wireframe Plot on anyplot.ai.