The same plot in 14 other libraries — Python: Altair, Bokeh, lets-plot, Matplotlib, Plotly, Pygal, Seaborn; R: ggplot2; Julia: Makie.jl; JavaScript: Chart.js, D3.js, Apache ECharts, Highcharts, MUI X Charts. Compare all 15 side by side: Basic 3D Wireframe Plot in Python, R, Julia and JavaScript.
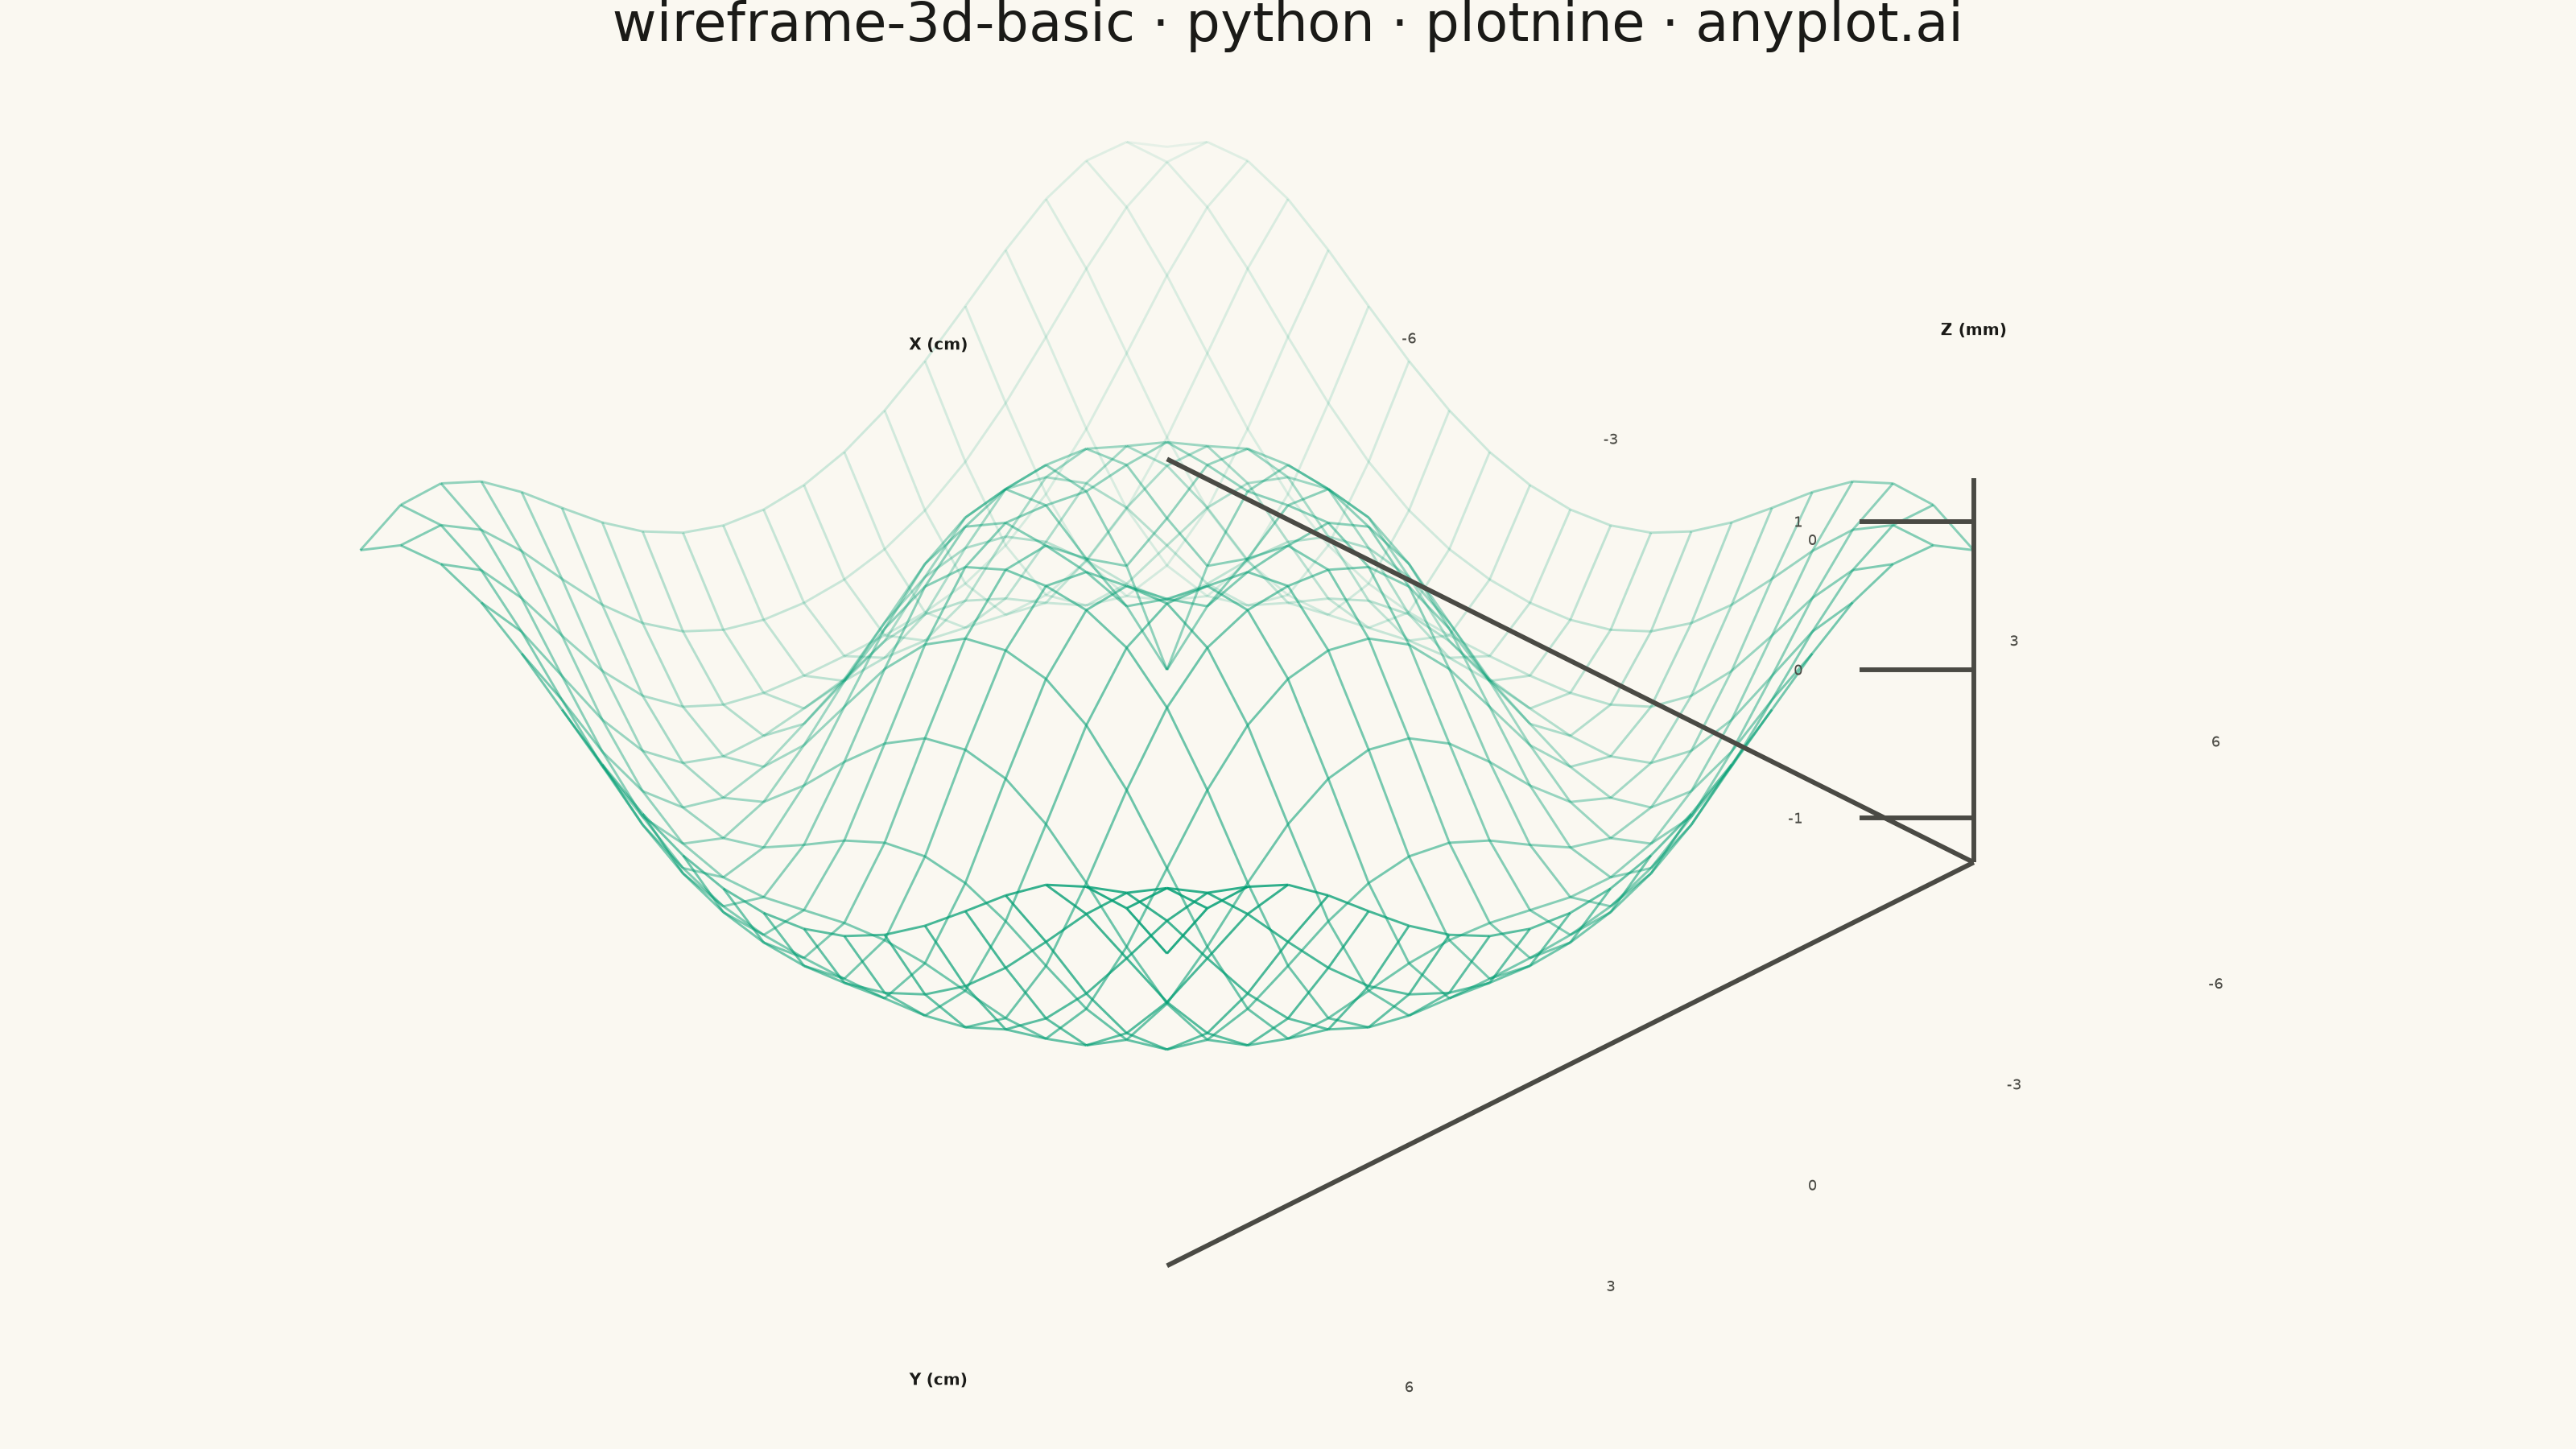
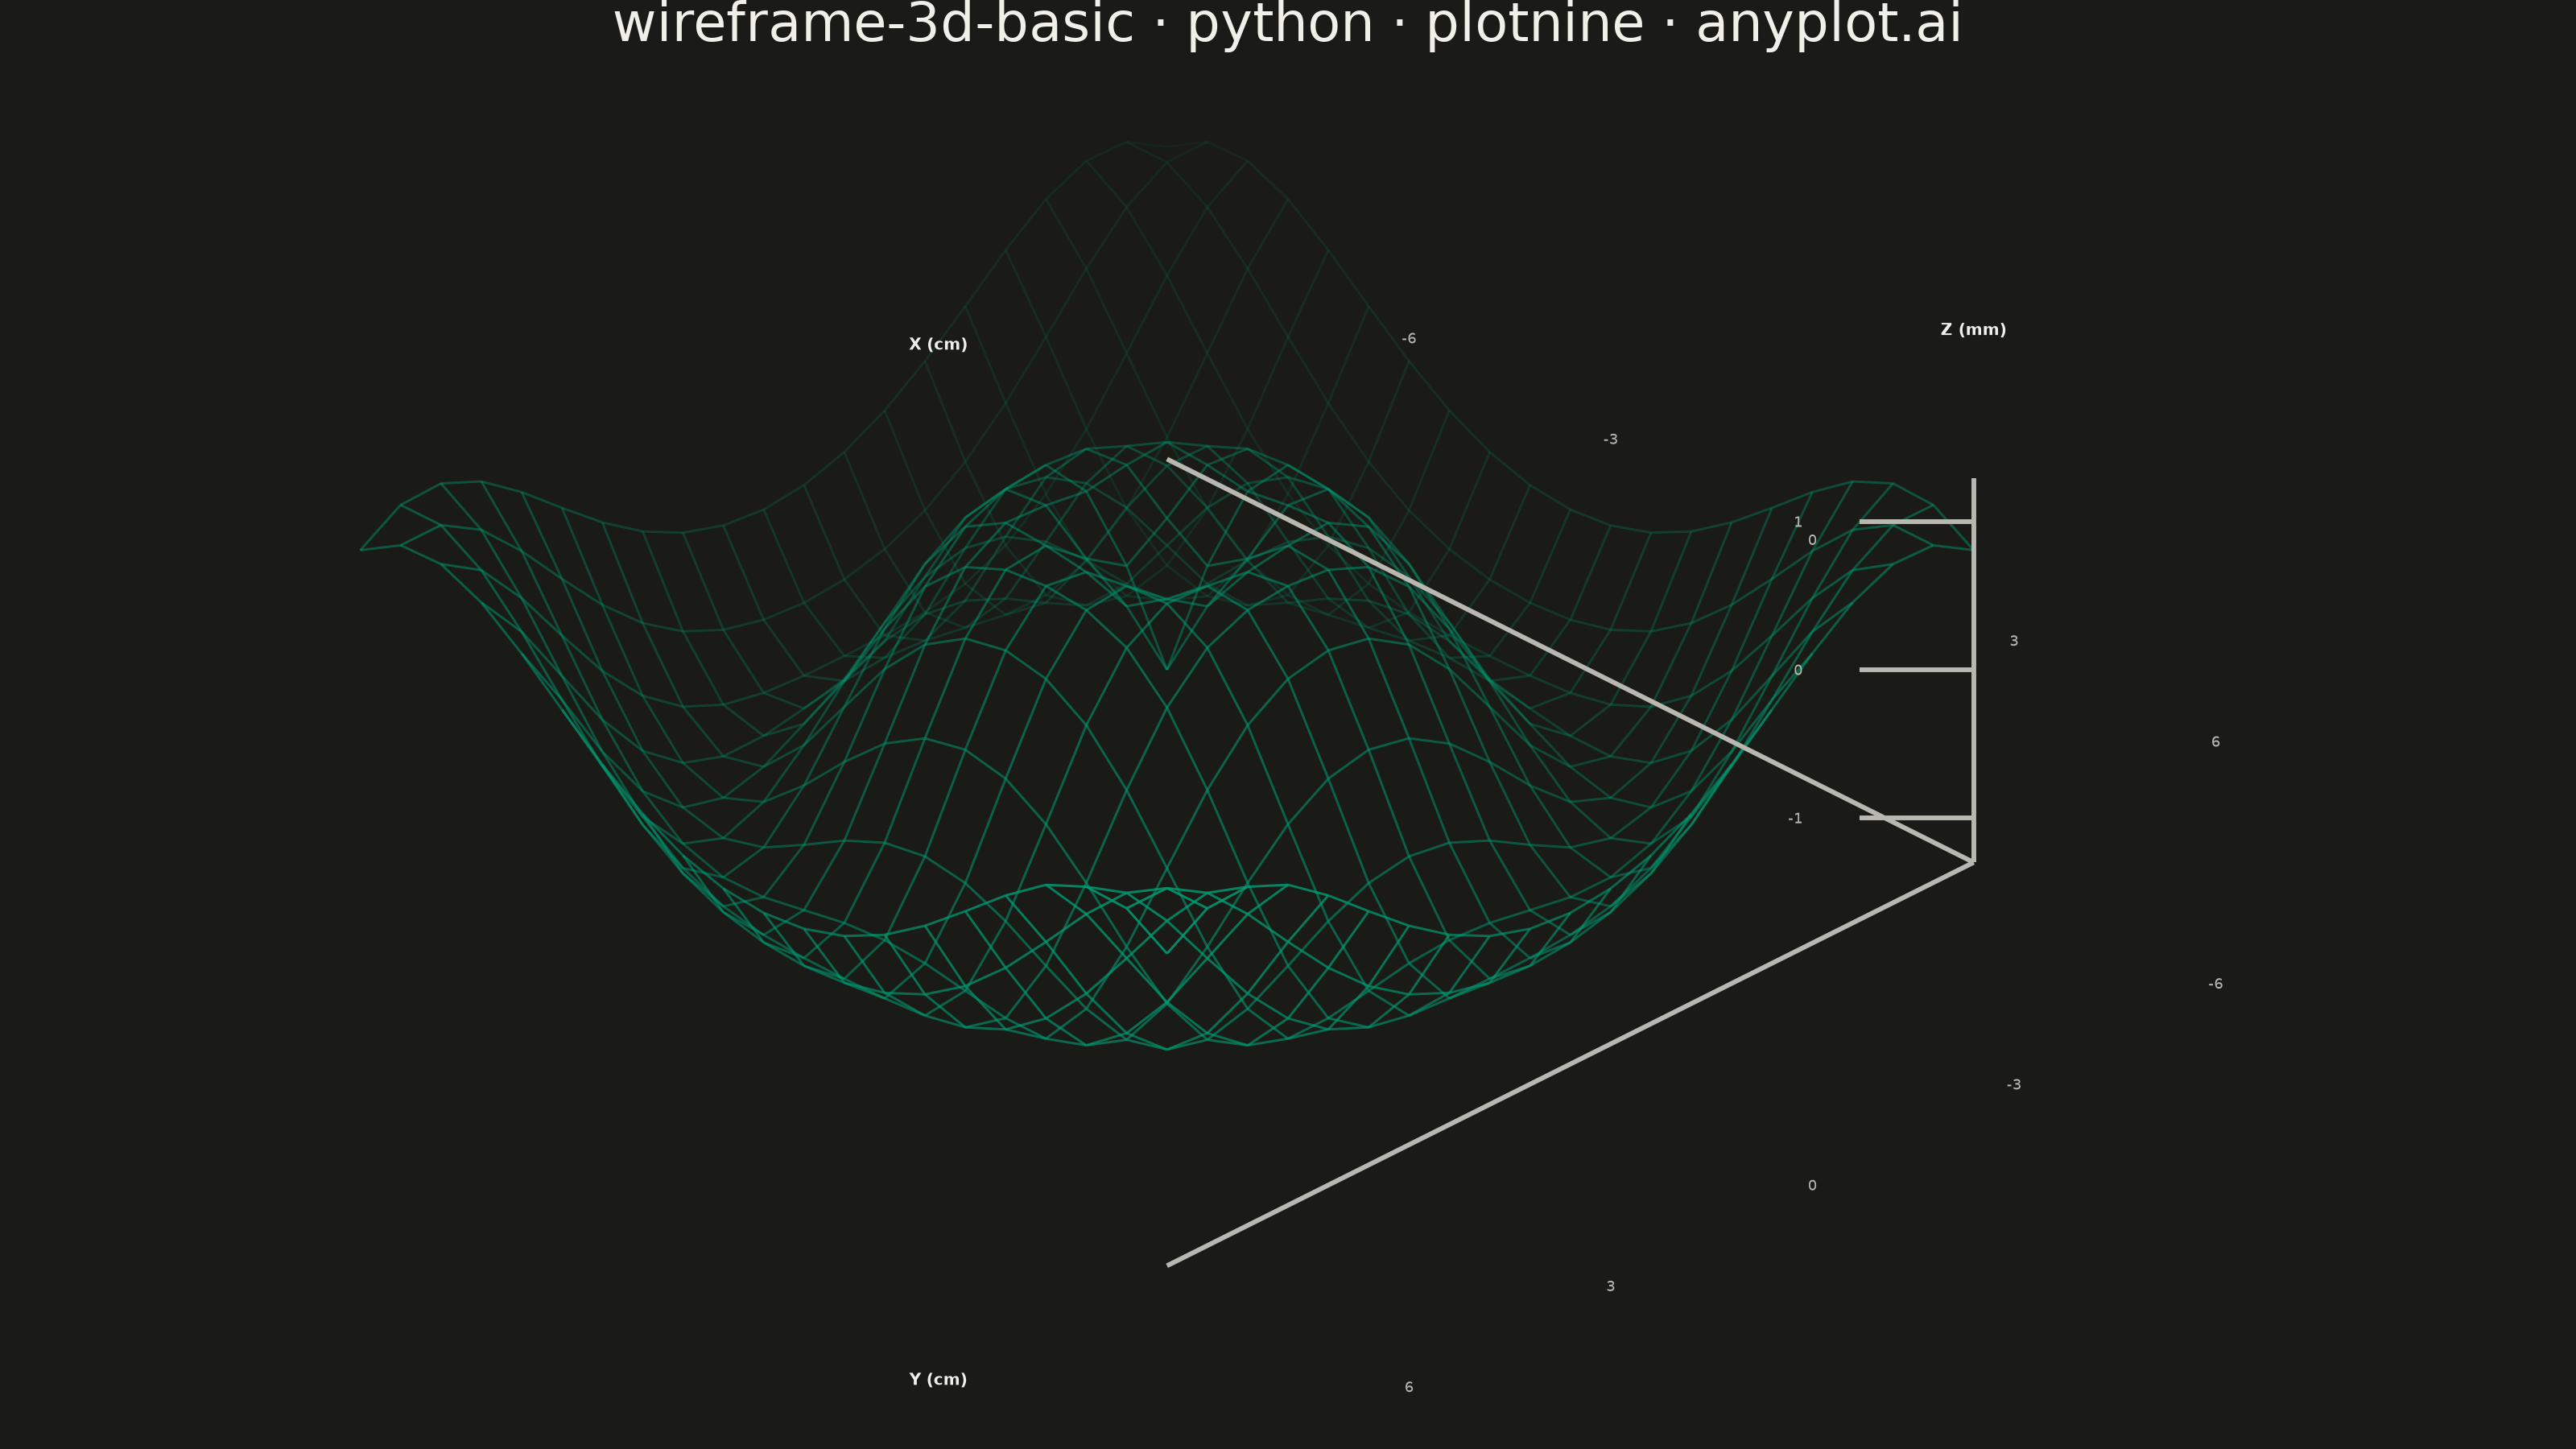
A 3D wireframe plot displays a mathematical surface as a mesh of lines connecting grid points in three-dimensional space. Unlike solid surface plots, wireframes render only the edges between grid points, creating a see-through visualization that reveals the underlying structure and allows viewing parts of the surface that would otherwise be hidden. This makes wireframes ideal for understanding the topology and shape of 3D functions.
""" anyplot.ai
wireframe-3d-basic: Basic 3D Wireframe Plot
Library: plotnine 0.15.8 | Python 3.13.15
Quality: 85/100 | Created: 2026-09-10
"""

import os

import numpy as np
import pandas as pd
from plotnine import (
    aes,
    coord_fixed,
    element_rect,
    element_text,
    geom_segment,
    geom_text,
    ggplot,
    labs,
    scale_alpha_continuous,
    theme,
    theme_void,
)


# Theme tokens
THEME = os.getenv("ANYPLOT_THEME", "light")
PAGE_BG = "#FAF8F1" if THEME == "light" else "#1A1A17"
INK = "#1A1A17" if THEME == "light" else "#F0EFE8"
INK_SOFT = "#4A4A44" if THEME == "light" else "#B8B7B0"
BRAND = "#009E73"  # Imprint palette position 1 — ALWAYS first series

# Camera: orthographic projection at elevation 30 deg / azimuth 45 deg, per spec.
# plotnine has no 3D grammar, so the mesh is projected to 2D screen coordinates
# ourselves (the same technique any static 3D renderer uses under the hood),
# then drawn with plotnine's own geom_path / geom_segment / geom_text.
elev = np.radians(30)
azim = np.radians(45)

view_dir = np.array([np.cos(elev) * np.cos(azim), np.cos(elev) * np.sin(azim), np.sin(elev)])
world_up = np.array([0.0, 0.0, 1.0])
right_axis = np.cross(view_dir, world_up)
right_axis /= np.linalg.norm(right_axis)
up_axis = np.cross(right_axis, view_dir)

Z_LIFT = 1.8  # visual height exaggeration so the shallow membrane displacement reads clearly


def project(x, y, z):
    px = x * right_axis[0] + y * right_axis[1] + z * Z_LIFT * right_axis[2]
    py = x * up_axis[0] + y * up_axis[1] + z * Z_LIFT * up_axis[2]
    return px, py


def depth(x, y, z):
    """Distance along the camera's view direction — larger means closer to
    the viewer, so it doubles as a painter's-algorithm draw-order key and as
    the source for depth-based alpha (approximates hidden-line suppression
    since plotnine has no real depth buffer)."""
    return x * view_dir[0] + y * view_dir[1] + z * Z_LIFT * view_dir[2]


# Data — circular drumhead vibration mode: displacement z = sin(sqrt(x^2 + y^2))
grid_n = 21  # kept modest (20-22) so depth-faded lines stay legible, not a tangle
x_vals = np.linspace(-6, 6, grid_n)
y_vals = np.linspace(-6, 6, grid_n)
grid_x, grid_y = np.meshgrid(x_vals, y_vals)
grid_z = np.sin(np.sqrt(grid_x**2 + grid_y**2))

z_min, z_max = float(grid_z.min()), float(grid_z.max())
floor_z = z_min - 0.3
ceil_z = z_max + 0.3

grid_px, grid_py = project(grid_x, grid_y, grid_z)
grid_depth = depth(grid_x, grid_y, grid_z)

# Wireframe mesh as individual edges (not whole rows/columns) so each edge can
# carry its own depth-based alpha: far-side edges fade low, near-side edges
# stay opaque, which reads as an approximate hidden-line-suppressed surface
# instead of a flat tangle of fully superimposed lines.
edges = []
for i in range(grid_n):
    for j in range(grid_n - 1):
        edges.append(
            {
                "px": grid_px[i, j],
                "py": grid_py[i, j],
                "pxend": grid_px[i, j + 1],
                "pyend": grid_py[i, j + 1],
                "edge_depth": (grid_depth[i, j] + grid_depth[i, j + 1]) / 2,
            }
        )
for j in range(grid_n):
    for i in range(grid_n - 1):
        edges.append(
            {
                "px": grid_px[i, j],
                "py": grid_py[i, j],
                "pxend": grid_px[i + 1, j],
                "pyend": grid_py[i + 1, j],
                "edge_depth": (grid_depth[i, j] + grid_depth[i + 1, j]) / 2,
            }
        )
# Sort back-to-front so later (nearer, higher-alpha) edges paint over earlier
# (farther, lower-alpha) ones — plotnine draws geom_segment rows in data order.
mesh_edges = pd.DataFrame(edges).sort_values("edge_depth", ignore_index=True)

# Axis box: three edges meeting at the (x=6, y=-6) corner. This corner sits off
# the camera's azimuth-45 view axis (unlike the diagonally opposite (-6, -6)
# corner, which projects to dead screen-center and would drag the axis frame
# straight through the densest part of the mesh), so the frame reads as a
# distinct side reference instead of cutting through the data.
axis_lines = pd.DataFrame(
    {
        "x": [6, 6, 6],
        "y": [-6, -6, -6],
        "z": [floor_z, floor_z, floor_z],
        "xend": [-6, 6, 6],
        "yend": [-6, 6, -6],
        "zend": [floor_z, floor_z, ceil_z],
    }
)
axis_lines["px"], axis_lines["py"] = project(axis_lines["x"], axis_lines["y"], axis_lines["z"])
axis_lines["pxend"], axis_lines["pyend"] = project(axis_lines["xend"], axis_lines["yend"], axis_lines["zend"])

x_breaks = np.array([-6, -3, 0, 3, 6])
y_breaks = np.array([-6, -3, 0, 3, 6])
z_breaks = np.array([-1, 0, 1])

ticks = pd.concat(
    [
        pd.DataFrame({"x": x_breaks, "y": -9.6, "z": floor_z, "label": [f"{v:g}" for v in x_breaks]}),
        pd.DataFrame({"x": 9.6, "y": y_breaks, "z": floor_z, "label": [f"{v:g}" for v in y_breaks]}),
    ],
    ignore_index=True,
)
ticks["px"], ticks["py"] = project(ticks["x"], ticks["y"], ticks["z"])

# Z ticks sit on the vertical axis line itself. A short leader segment (tick
# mark) connects each label back to the axis line so it reads as belonging to
# the Z axis rather than as a stray fourth axis (previously offset -13 with
# no connector, leaving the labels visually stranded).
Z_TICK_LEADER = 1.2
Z_TICK_LABEL_GAP = 0.6
z_axis_px, z_axis_py = project(6, -6, z_breaks)
z_ticks = pd.DataFrame(
    {"px": z_axis_px - Z_TICK_LEADER - Z_TICK_LABEL_GAP, "py": z_axis_py, "label": [f"{v:g}" for v in z_breaks]}
)
z_tick_leaders = pd.DataFrame(
    {"px": z_axis_px, "py": z_axis_py, "pxend": z_axis_px - Z_TICK_LEADER, "pyend": z_axis_py}
)

axis_labels = pd.DataFrame(
    {
        "x": [-9.4, 6, 6],
        "y": [-6, 9.4, -6],
        "z": [floor_z, floor_z, ceil_z + 1.0],
        "label": ["X (cm)", "Y (cm)", "Z (mm)"],
    }
)
axis_labels["px"], axis_labels["py"] = project(axis_labels["x"], axis_labels["y"], axis_labels["z"])

# Plot
plot = (
    ggplot()
    + geom_segment(
        aes(x="px", y="py", xend="pxend", yend="pyend", alpha="edge_depth"),
        mesh_edges,
        color=BRAND,
        size=0.3,
        show_legend=False,
    )
    + scale_alpha_continuous(range=(0.08, 0.85))
    + geom_segment(aes(x="px", y="py", xend="pxend", yend="pyend"), axis_lines, color=INK_SOFT, size=0.6)
    + geom_segment(aes(x="px", y="py", xend="pxend", yend="pyend"), z_tick_leaders, color=INK_SOFT, size=0.6)
    + geom_text(aes("px", "py", label="label"), ticks, color=INK_SOFT, size=3.3)
    + geom_text(aes("px", "py", label="label"), z_ticks, color=INK_SOFT, size=3.3, ha="right")
    + geom_text(aes("px", "py", label="label"), axis_labels, color=INK, size=3.6, fontweight="bold")
    + labs(title="wireframe-3d-basic · python · plotnine · anyplot.ai")
    + coord_fixed(ratio=1)
    + theme_void(base_size=7)
    + theme(
        plot_background=element_rect(fill=PAGE_BG, color=PAGE_BG),
        panel_background=element_rect(fill=PAGE_BG, color=PAGE_BG),
        plot_title=element_text(color=INK, size=12, ha="center"),
        figure_size=(8, 4.5),
    )
)

plot.save(f"plot-{THEME}.png", dpi=400, width=8, height=4.5, units="in")
Runnable source as JSON, for any HTTP client: https://api.anyplot.ai/specs/wireframe-3d-basic/plotnine/code. Any spec id and library id listed in llms-full.txt fit the same URL shape; every URL below is complete and callable.
{
  "spec_id": "wireframe-3d-basic",
  "language": "python",
  "library": "plotnine",
  "page": "https://anyplot.ai/wireframe-3d-basic/python/plotnine",
  "hub": "https://anyplot.ai/wireframe-3d-basic",
  "code_json": "https://api.anyplot.ai/specs/wireframe-3d-basic/plotnine/code",
  "spec_json": "https://api.anyplot.ai/specs/wireframe-3d-basic",
  "render_light_png": "https://storage.googleapis.com/anyplot-images/plots/wireframe-3d-basic/python/plotnine/plot-light.png",
  "render_dark_png": "https://storage.googleapis.com/anyplot-images/plots/wireframe-3d-basic/python/plotnine/plot-dark.png",
  "quality_score": 85.0,
  "license": "MIT",
  "guide": "https://anyplot.ai/llms.txt"
}
Part of Basic 3D Wireframe Plot on anyplot.ai.