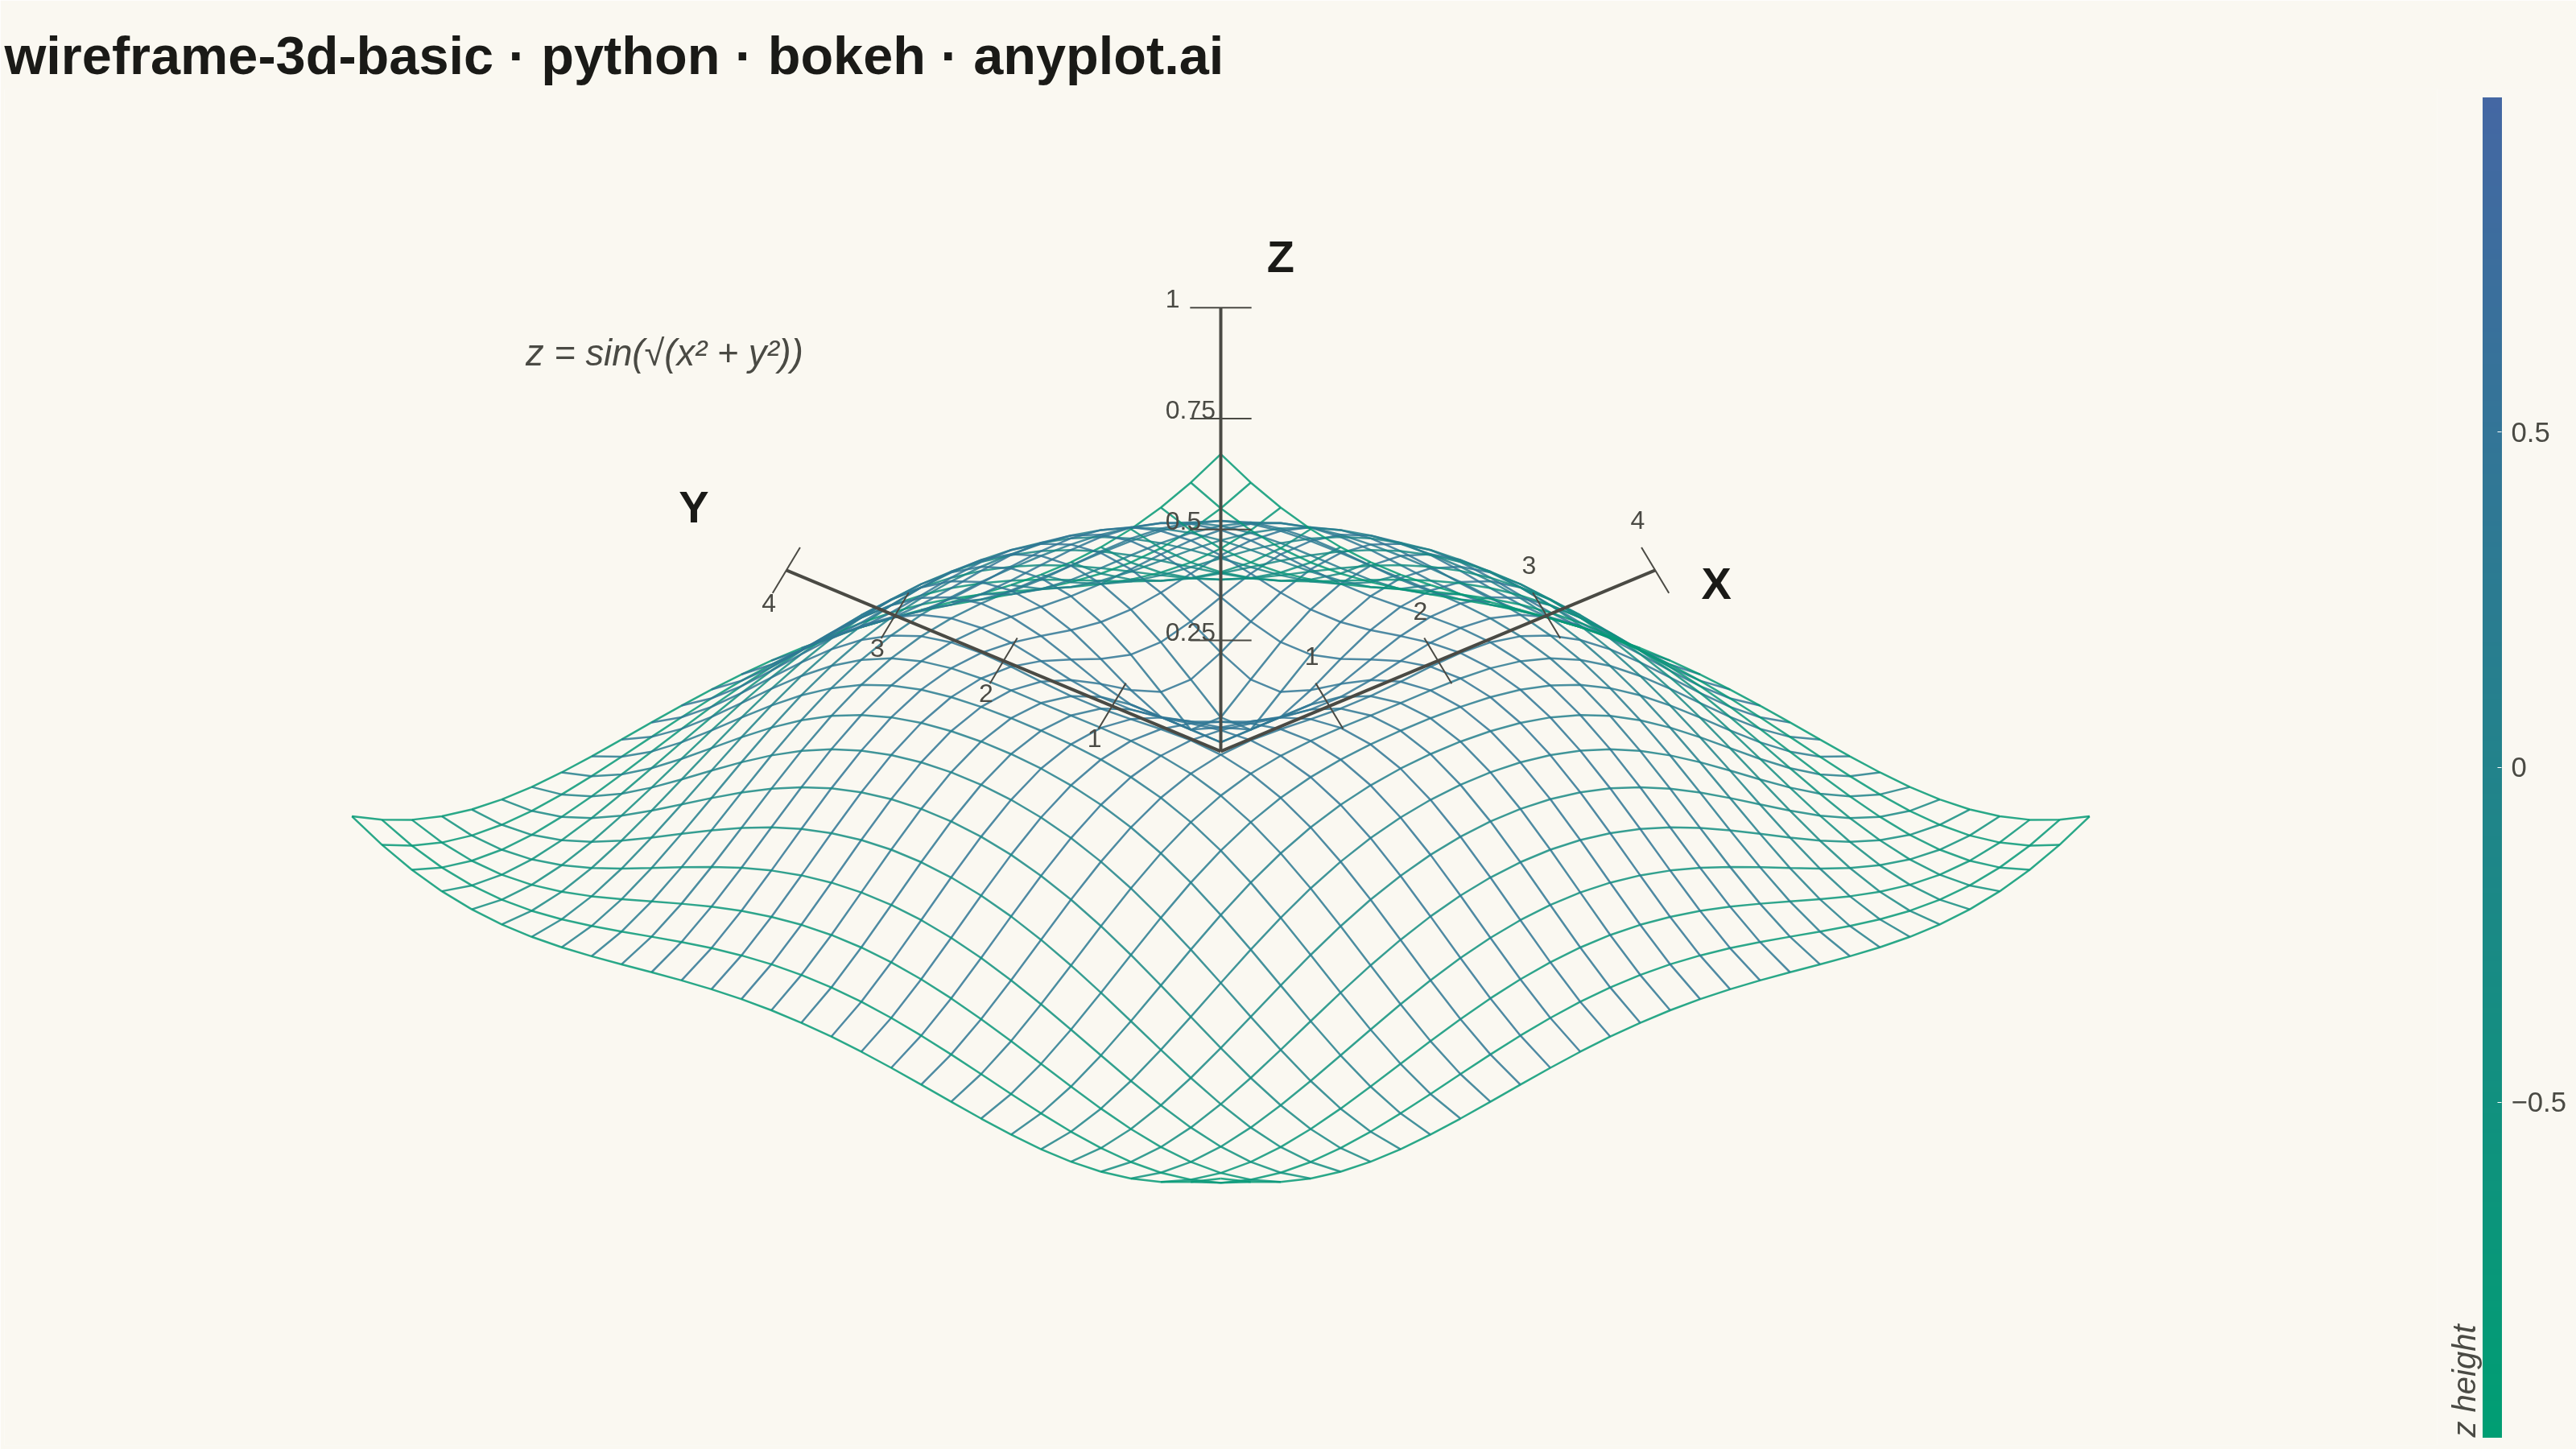
A 3D wireframe plot displays a mathematical surface as a mesh of lines connecting grid points in three-dimensional space. Unlike solid surface plots, wireframes render only the edges between grid points, creating a see-through visualization that reveals the underlying structure and allows viewing parts of the surface that would otherwise be hidden. This makes wireframes ideal for understanding the topology and shape of 3D functions.
""" anyplot.ai
wireframe-3d-basic: Basic 3D Wireframe Plot
Library: bokeh 3.9.2 | Python 3.13.14
Quality: 85/100 | Updated: 2026-08-04
"""

import os
import sys
import time
from pathlib import Path


# Fix shadowing: remove current directory from path before importing bokeh
while sys.path and (sys.path[0] == "" or sys.path[0] == os.path.dirname(__file__)):
    sys.path.pop(0)

import numpy as np
from bokeh.io import output_file, save
from bokeh.models import ColorBar, ColumnDataSource, HoverTool, Label, LinearColorMapper, Range1d
from bokeh.plotting import figure
from bokeh.transform import transform
from selenium import webdriver
from selenium.webdriver.chrome.options import Options


# Theme tokens
THEME = os.getenv("ANYPLOT_THEME", "light")
PAGE_BG = "#FAF8F1" if THEME == "light" else "#1A1A17"
INK = "#1A1A17" if THEME == "light" else "#F0EFE8"
INK_SOFT = "#4A4A44" if THEME == "light" else "#B8B7B0"
BRAND = "#009E73"


def _lerp_hex(c0, c1, t):
    """Interpolate between two hex colors at t in [0, 1]."""
    r0, g0, b0 = (int(c0[i : i + 2], 16) for i in (1, 3, 5))
    r1, g1, b1 = (int(c1[i : i + 2], 16) for i in (1, 3, 5))
    r, g, b = (int(round(a + (b - a) * t)) for a, b in ((r0, r1), (g0, g1), (b0, b1)))
    return f"#{r:02X}{g:02X}{b:02X}"


def project_point(px, py, pz, elev_rad, azim_rad):
    """Project a single 3D point to 2D screen space (azimuth rotation, then elevation tilt)."""
    x_rot = px * np.cos(azim_rad) - py * np.sin(azim_rad)
    y_rot = px * np.sin(azim_rad) + py * np.cos(azim_rad)
    x2d = x_rot
    y2d = y_rot * np.sin(elev_rad) + pz * np.cos(elev_rad)
    return x2d, y2d


def project_grid(gx, gy, gz, elev_rad, azim_rad):
    """Vectorized projection of grid arrays to 2D screen space."""
    x_rot = gx * np.cos(azim_rad) - gy * np.sin(azim_rad)
    y_rot = gx * np.sin(azim_rad) + gy * np.cos(azim_rad)
    x2d = x_rot
    y2d = y_rot * np.sin(elev_rad) + gz * np.cos(elev_rad)
    return x2d, y2d


def draw_axis_ticks(fig, origin_xy, end_xy, axis_max, color, text_color, width, n_ticks=4, tick_length=0.2):
    """Draw evenly-spaced perpendicular tick marks with numeric value labels along a projected 2D axis segment."""
    ox, oy = origin_xy
    ex, ey = end_xy
    direction = np.array([ex - ox, ey - oy])
    norm = np.linalg.norm(direction)
    if norm == 0:
        return
    direction = direction / norm
    perp = np.array([-direction[1], direction[0]])
    for i in range(1, n_ticks + 1):
        t = i / n_ticks
        tx = ox + t * (ex - ox)
        ty = oy + t * (ey - oy)
        fig.line(
            x=[tx - tick_length * perp[0], tx + tick_length * perp[0]],
            y=[ty - tick_length * perp[1], ty + tick_length * perp[1]],
            line_color=color,
            line_width=width,
        )
        fig.add_layout(
            Label(
                x=tx + tick_length * 1.8 * perp[0],
                y=ty + tick_length * 1.8 * perp[1],
                text=f"{axis_max * t:.2g}",
                text_font_size="24pt",
                text_color=text_color,
            )
        )


# Data - ripple surface z = sin(sqrt(x^2 + y^2))
n_points = 30
x = np.linspace(-4, 4, n_points)
y = np.linspace(-4, 4, n_points)
X, Y = np.meshgrid(x, y)
R = np.sqrt(X**2 + Y**2)
Z = np.sin(R)

# 3D to 2D projection (elevation=30, azimuth=45)
elev_rad = np.radians(30)
azim_rad = np.radians(45)
X_proj, Z_proj = project_grid(X, Y, Z, elev_rad, azim_rad)

# Wireframe lines along x-direction (rows) and y-direction (columns)
row_xs = [X_proj[i, :].tolist() for i in range(n_points)]
row_ys = [Z_proj[i, :].tolist() for i in range(n_points)]
col_xs = [X_proj[:, j].tolist() for j in range(n_points)]
col_ys = [Z_proj[:, j].tolist() for j in range(n_points)]

all_xs = row_xs + col_xs
all_ys = row_ys + col_ys

# Height-based coloring: average z per line, mapped through the imprint_seq
# ramp (brand green -> blue) so troughs and peaks of the ripple read at a glance.
row_avg_z = [float(np.mean(Z[i, :])) for i in range(n_points)]
col_avg_z = [float(np.mean(Z[:, j])) for j in range(n_points)]
avg_z = row_avg_z + col_avg_z
directions = ["row (x-slice)"] * n_points + ["column (y-slice)"] * n_points
line_idx = list(range(n_points)) * 2

z_min, z_max = float(Z.min()), float(Z.max())
ANYPLOT_SEQ256 = [_lerp_hex(BRAND, "#4467A3", t / 255.0) for t in range(256)]
color_mapper = LinearColorMapper(palette=ANYPLOT_SEQ256, low=z_min, high=z_max)

source = ColumnDataSource(data={"xs": all_xs, "ys": all_ys, "direction": directions, "idx": line_idx, "avg_z": avg_z})

# Create Bokeh figure - 3200x1800 landscape (canonical canvas)
p = figure(
    width=3200,
    height=1800,
    title="wireframe-3d-basic · python · bokeh · anyplot.ai",
    toolbar_location=None,  # bokeh's default toolbar adds ~30-50px above the canvas
    tools="",
    min_border_top=110,  # room for 50pt title
)

# Hide default axes since we're doing custom 3D axis visualization
p.xaxis.visible = False
p.yaxis.visible = False

# Draw wireframe, colored by average height per line, with hover tooltips
wireframe = p.multi_line(
    xs="xs", ys="ys", source=source, line_color=transform("avg_z", color_mapper), line_width=2.5, line_alpha=0.85
)
p.add_tools(
    HoverTool(
        renderers=[wireframe],
        tooltips=[("Slice", "@direction"), ("Grid index", "@idx"), ("Avg height (z)", "@avg_z{0.00}")],
        line_policy="nearest",
    )
)

color_bar = ColorBar(
    color_mapper=color_mapper,
    title="z height",
    title_text_color=INK_SOFT,
    title_text_font_size="30pt",
    major_label_text_color=INK_SOFT,
    major_label_text_font_size="26pt",
    background_fill_color=PAGE_BG,
    label_standoff=12,
    width=24,
    location=(0, 0),
)
p.add_layout(color_bar, "right")

# Custom 3D axis lines positioned at the projected origin
origin_x, origin_y = project_point(0, 0, 0, elev_rad, azim_rad)

axis_color = INK_SOFT
axis_width = 4

# Draw all three schematic arms at a shared visual length spanning the plotted
# range (matching the x,y data extent) so the compass reads as a real axis
# rather than a tiny floating stub; each arm's tick labels below are scaled
# to that dimension's own true data extent so the numbers stay meaningful.
axis_length = float(np.max(np.abs(X)))
x_extent = float(np.max(np.abs(X)))
y_extent = float(np.max(np.abs(Y)))
z_extent = float(np.max(np.abs(Z)))

x_axis_end_x, x_axis_end_y = project_point(axis_length, 0, 0, elev_rad, azim_rad)
y_axis_end_x, y_axis_end_y = project_point(0, axis_length, 0, elev_rad, azim_rad)
z_axis_end_x, z_axis_end_y = project_point(0, 0, axis_length, elev_rad, azim_rad)

# Set appropriate ranges with padding for axes and labels — must also cover
# the schematic axis arms above, not just the mesh, or the Z arm (tallest
# projected element) gets clipped against the fixed Range1d bounds.
x_min = min(min(min(xs) for xs in all_xs), origin_x, x_axis_end_x, y_axis_end_x, z_axis_end_x)
x_max = max(max(max(xs) for xs in all_xs), origin_x, x_axis_end_x, y_axis_end_x, z_axis_end_x)
y_min = min(min(min(ys) for ys in all_ys), origin_y, x_axis_end_y, y_axis_end_y, z_axis_end_y)
y_max = max(max(max(ys) for ys in all_ys), origin_y, x_axis_end_y, y_axis_end_y, z_axis_end_y)

x_pad = (x_max - x_min) * 0.20
y_pad = (y_max - y_min) * 0.25

p.x_range = Range1d(x_min - x_pad, x_max + x_pad)
p.y_range = Range1d(y_min - y_pad * 1.2, y_max + y_pad)

# Draw axis lines from projected origin
p.line(x=[origin_x, x_axis_end_x], y=[origin_y, x_axis_end_y], line_color=axis_color, line_width=axis_width)
p.line(x=[origin_x, y_axis_end_x], y=[origin_y, y_axis_end_y], line_color=axis_color, line_width=axis_width)
p.line(x=[origin_x, z_axis_end_x], y=[origin_y, z_axis_end_y], line_color=axis_color, line_width=axis_width)

# Add axis tick marks with real coordinate-value labels
origin_xy = (origin_x, origin_y)
draw_axis_ticks(p, origin_xy, (x_axis_end_x, x_axis_end_y), x_extent, axis_color, INK_SOFT, 2)
draw_axis_ticks(p, origin_xy, (y_axis_end_x, y_axis_end_y), y_extent, axis_color, INK_SOFT, 2)
draw_axis_ticks(p, origin_xy, (z_axis_end_x, z_axis_end_y), z_extent, axis_color, INK_SOFT, 2)

# Add axis labels
x_label = Label(
    x=x_axis_end_x + 0.3, y=x_axis_end_y - 0.3, text="X", text_font_size="42pt", text_color=INK, text_font_style="bold"
)
p.add_layout(x_label)

y_label = Label(
    x=y_axis_end_x - 0.7, y=y_axis_end_y + 0.3, text="Y", text_font_size="42pt", text_color=INK, text_font_style="bold"
)
p.add_layout(y_label)

z_label = Label(
    x=z_axis_end_x + 0.3, y=z_axis_end_y + 0.2, text="Z", text_font_size="42pt", text_color=INK, text_font_style="bold"
)
p.add_layout(z_label)

# Add formula annotation in center-left area where it will be visible
formula_label = Label(
    x=x_min + x_pad * 0.5,
    y=y_max - y_pad * 0.3,
    text="z = sin(√(x² + y²))",
    text_font_size="34pt",
    text_color=INK_SOFT,
    text_font_style="italic",
)
p.add_layout(formula_label)

# Styling for 3200x1800 px
p.title.text_font_size = "50pt"
p.title.text_font_style = "bold"
p.title.text_color = INK

# Disable grid for cleaner 3D appearance
p.xgrid.visible = False
p.ygrid.visible = False

# Theme-adaptive background
p.background_fill_color = PAGE_BG
p.border_fill_color = PAGE_BG
p.outline_line_color = None

# Get script directory for saving files
script_dir = Path(__file__).parent
output_dir = script_dir

# Save HTML
html_file = output_dir / f"plot-{THEME}.html"
output_file(str(html_file))
save(p)

# Screenshot with Selenium
W, H = 3200, 1800
opts = Options()
for arg in (
    "--headless=new",
    "--no-sandbox",
    "--disable-dev-shm-usage",
    "--disable-gpu",
    f"--window-size={W},{H}",
    "--hide-scrollbars",
):
    opts.add_argument(arg)
driver = webdriver.Chrome(options=opts)
driver.set_window_size(W, H)
driver.get(f"file://{html_file.resolve()}")
# headless Chrome's --window-size sets the OUTER window, which still reserves a
# phantom title-bar height even headless; pin the viewport exactly via CDP.
driver.execute_cdp_cmd(
    "Emulation.setDeviceMetricsOverride", {"width": W, "height": H, "deviceScaleFactor": 1, "mobile": False}
)
time.sleep(3)
driver.save_screenshot(str(output_dir / f"plot-{THEME}.png"))
driver.quit()
Runnable source as JSON, for any HTTP client: https://api.anyplot.ai/specs/wireframe-3d-basic/bokeh/code. Any spec id and library id listed in llms-full.txt fit the same URL shape; every URL below is complete and callable.
{
  "spec_id": "wireframe-3d-basic",
  "language": "python",
  "library": "bokeh",
  "page": "https://anyplot.ai/wireframe-3d-basic/python/bokeh",
  "hub": "https://anyplot.ai/wireframe-3d-basic",
  "code_json": "https://api.anyplot.ai/specs/wireframe-3d-basic/bokeh/code",
  "spec_json": "https://api.anyplot.ai/specs/wireframe-3d-basic",
  "render_light_png": "https://storage.googleapis.com/anyplot-images/plots/wireframe-3d-basic/python/bokeh/plot-light.png",
  "render_dark_png": "https://storage.googleapis.com/anyplot-images/plots/wireframe-3d-basic/python/bokeh/plot-dark.png",
  "interactive_light_html": "https://storage.googleapis.com/anyplot-images/plots/wireframe-3d-basic/python/bokeh/plot-light.html",
  "interactive_dark_html": "https://storage.googleapis.com/anyplot-images/plots/wireframe-3d-basic/python/bokeh/plot-dark.html",
  "quality_score": 85.0,
  "license": "MIT",
  "guide": "https://anyplot.ai/llms.txt"
}
Part of Basic 3D Wireframe Plot on anyplot.ai.