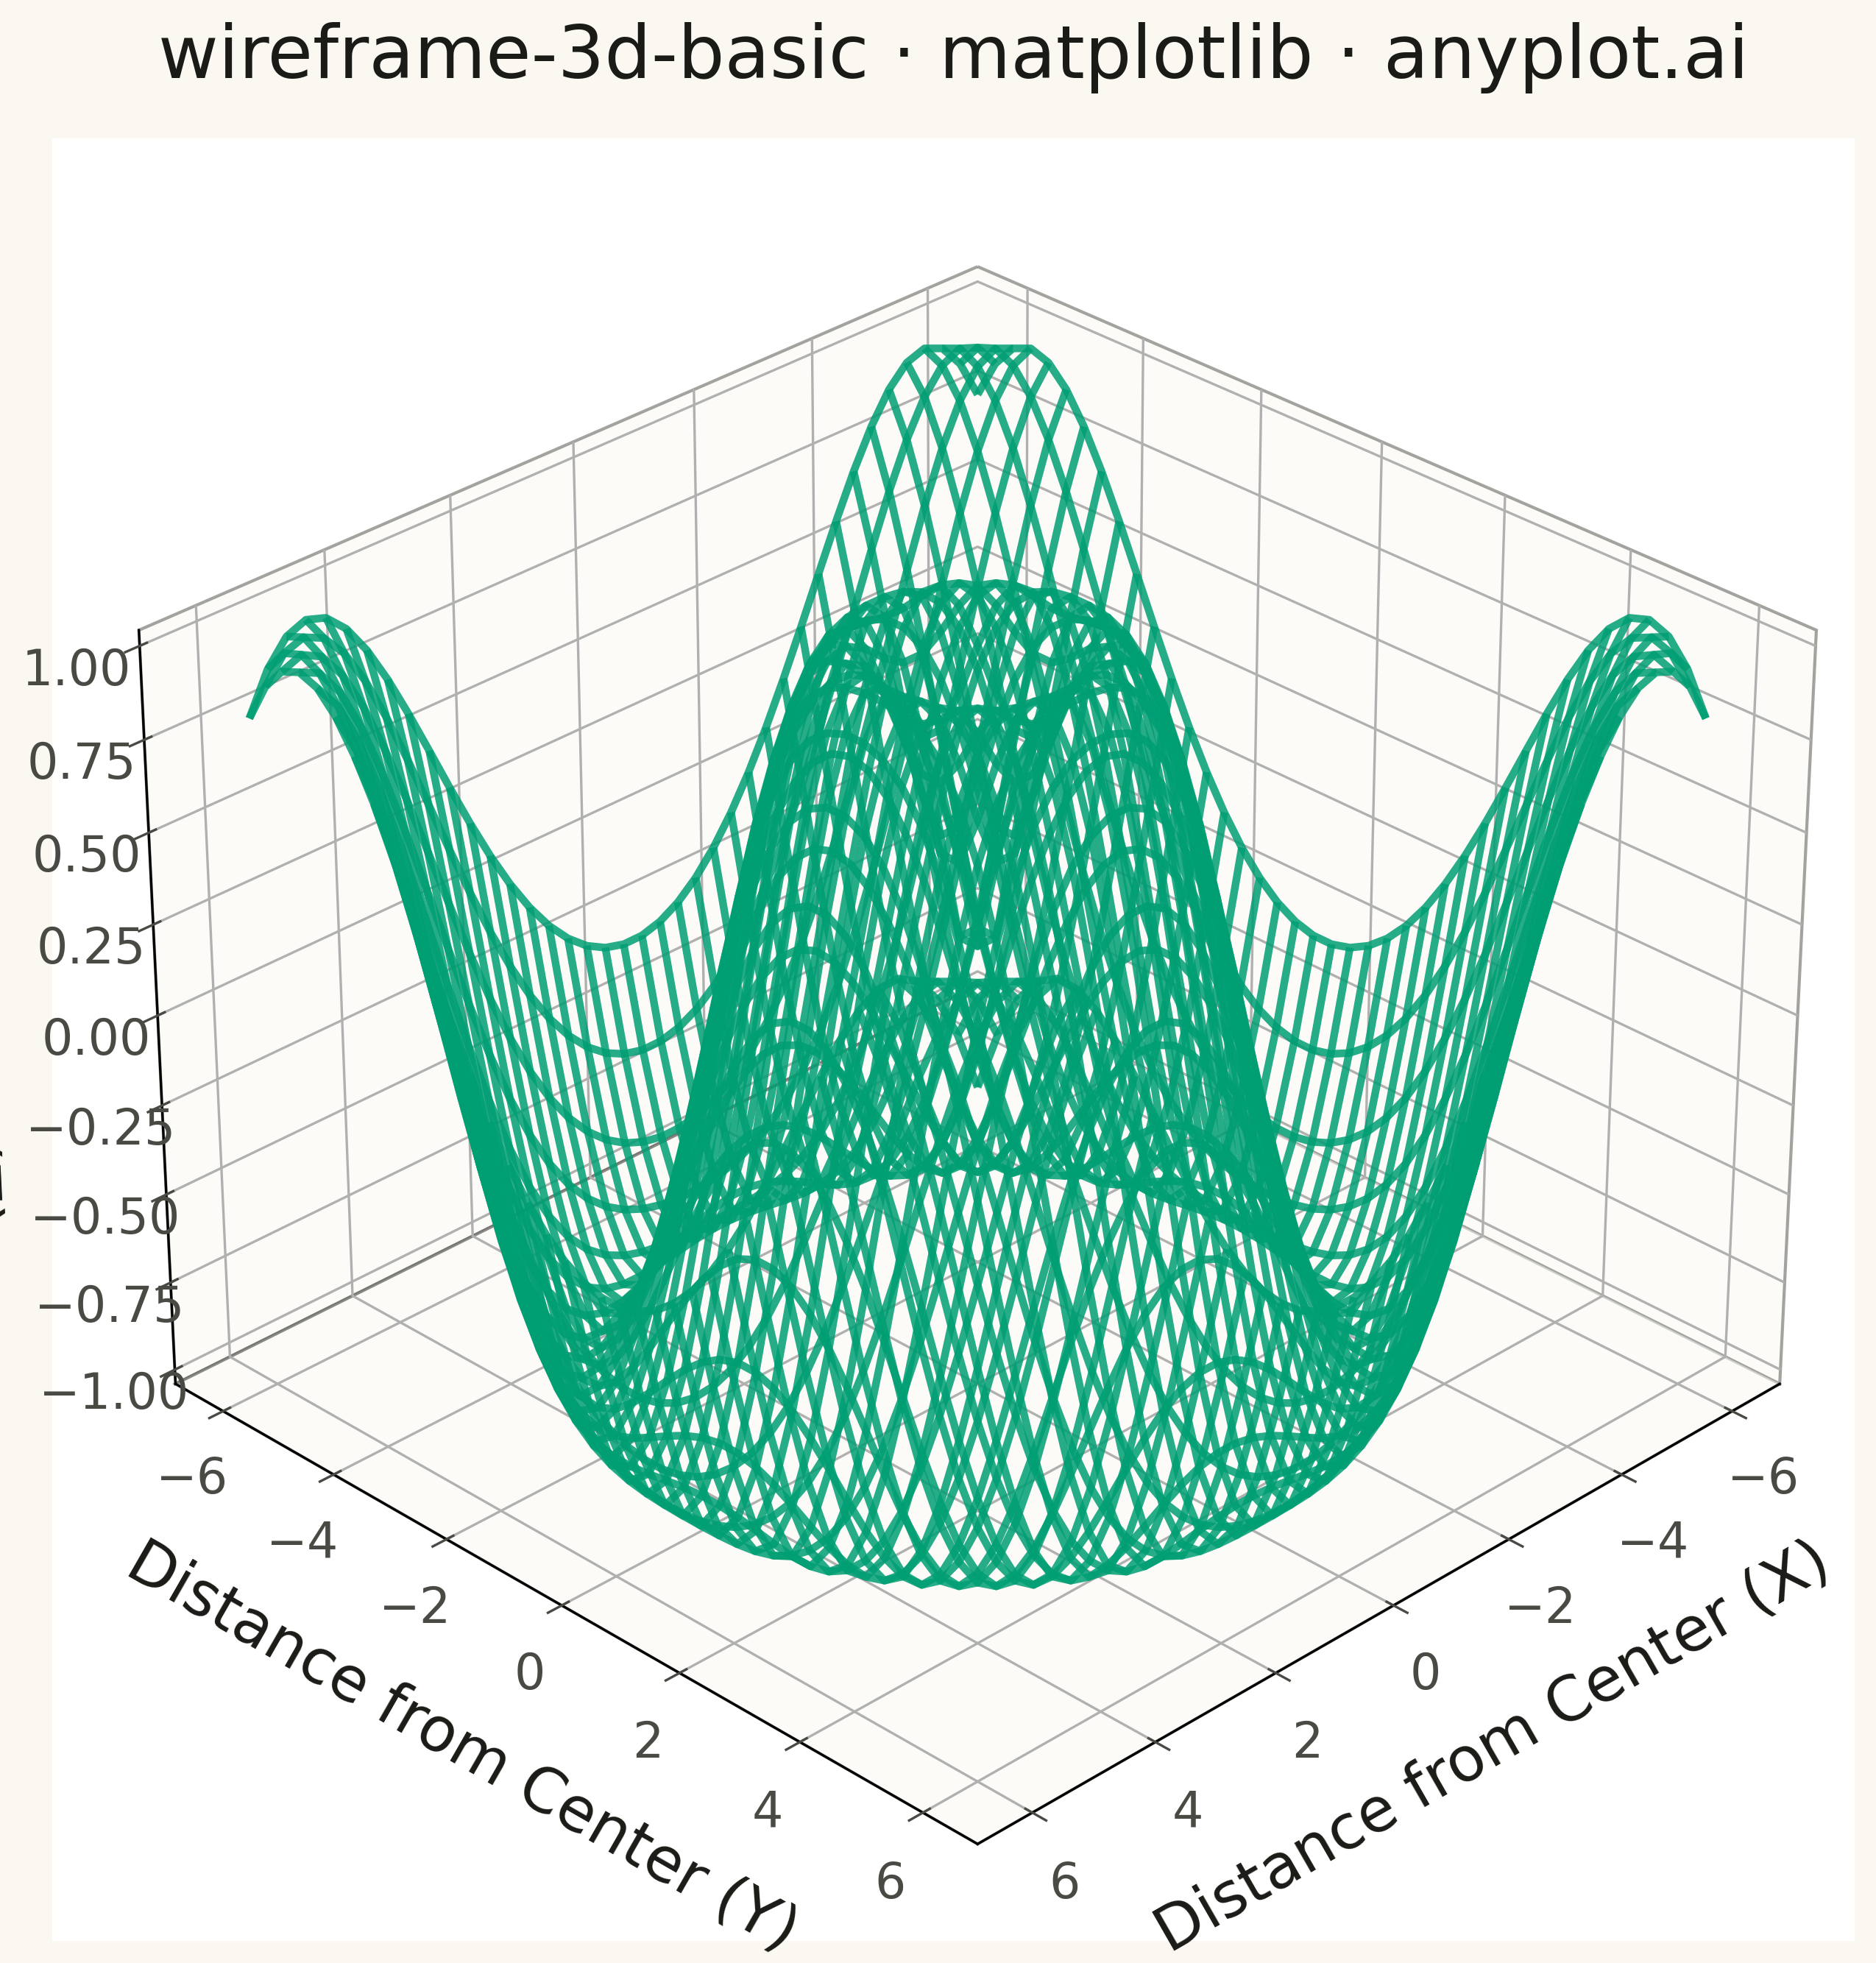
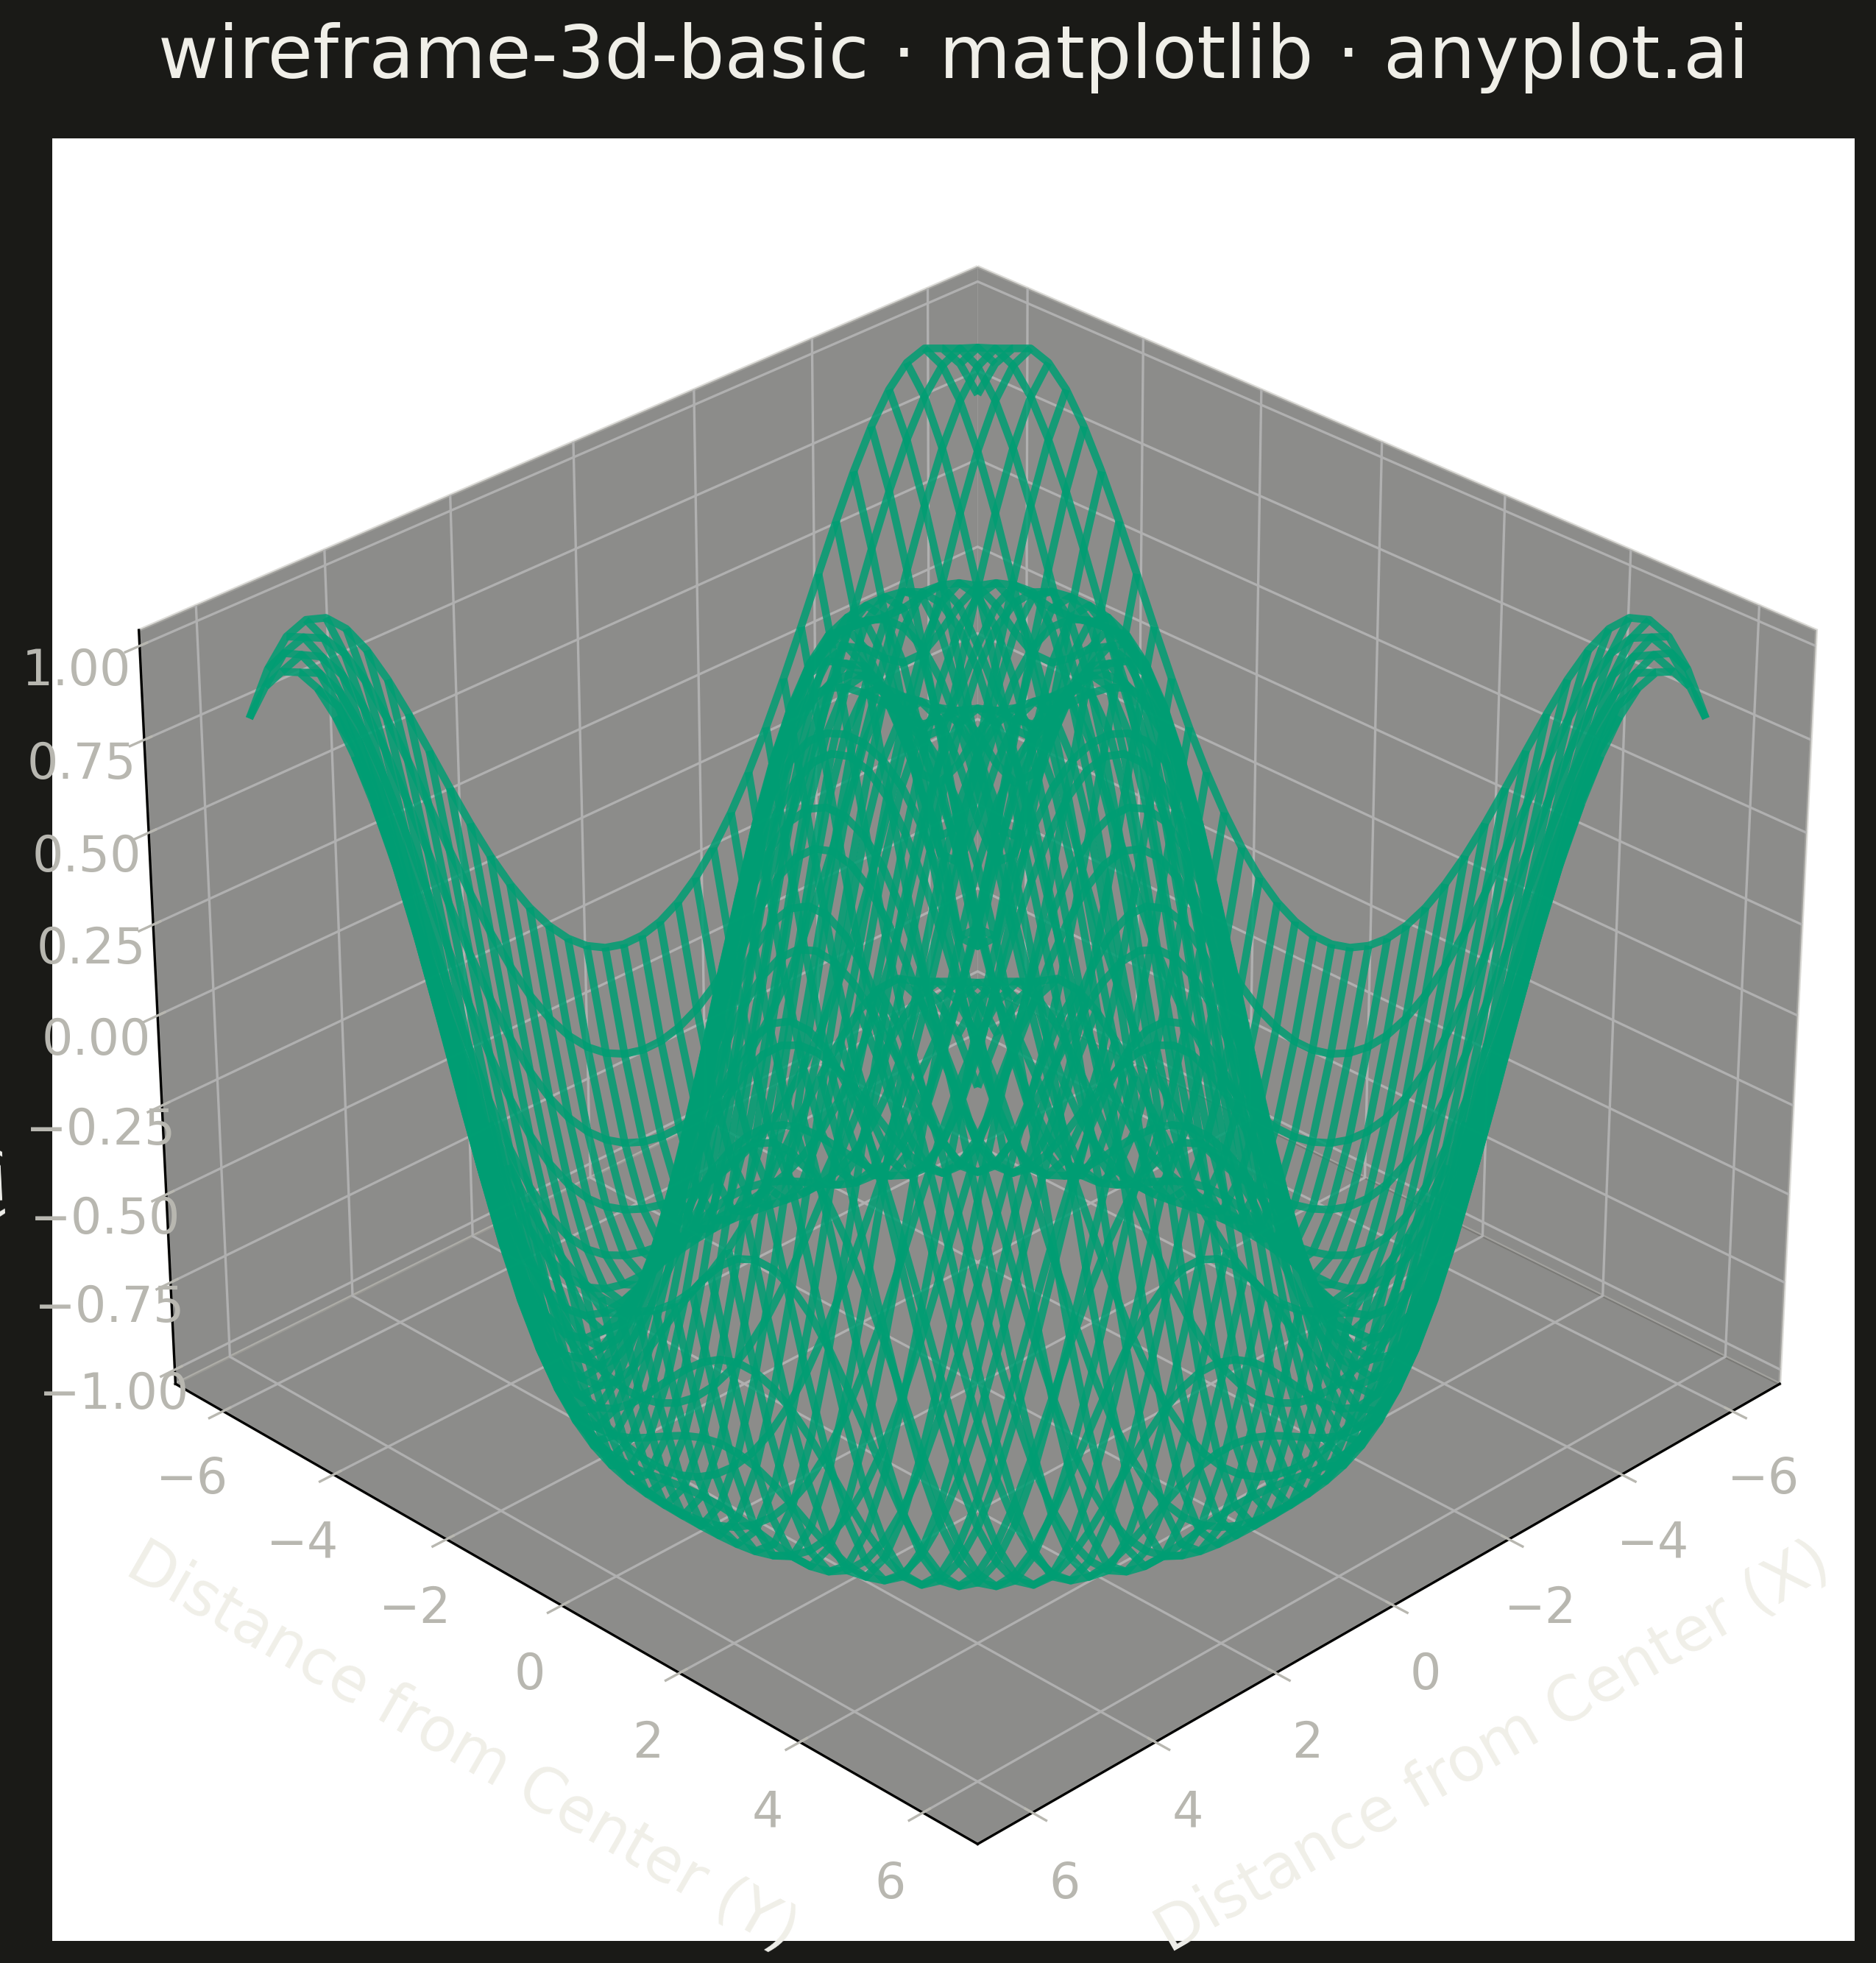
A 3D wireframe plot displays a mathematical surface as a mesh of lines connecting grid points in three-dimensional space. Unlike solid surface plots, wireframes render only the edges between grid points, creating a see-through visualization that reveals the underlying structure and allows viewing parts of the surface that would otherwise be hidden. This makes wireframes ideal for understanding the topology and shape of 3D functions.
""" anyplot.ai
wireframe-3d-basic: Basic 3D Wireframe Plot
Library: matplotlib 3.10.9 | Python 3.13.13
Quality: 91/100 | Updated: 2026-05-06
"""

import os

import matplotlib.pyplot as plt
import numpy as np


# Theme tokens
THEME = os.getenv("ANYPLOT_THEME", "light")
PAGE_BG = "#FAF8F1" if THEME == "light" else "#1A1A17"
INK = "#1A1A17" if THEME == "light" else "#F0EFE8"
INK_SOFT = "#4A4A44" if THEME == "light" else "#B8B7B0"
BRAND = "#009E73"  # Okabe-Ito position 1

# Data - ripple function z = sin(sqrt(x^2 + y^2))
np.random.seed(42)
x = np.linspace(-6, 6, 40)
y = np.linspace(-6, 6, 40)
X, Y = np.meshgrid(x, y)
R = np.sqrt(X**2 + Y**2)
Z = np.sin(R)

# Create 3D plot
fig = plt.figure(figsize=(16, 9), facecolor=PAGE_BG)
ax = fig.add_subplot(111, projection="3d")

# Plot wireframe
ax.plot_wireframe(X, Y, Z, color=BRAND, linewidth=2.5, alpha=0.85)

# Set viewing angle (elevation 30, azimuth 45 as per spec)
ax.view_init(elev=30, azim=45)

# Labels and styling
ax.set_xlabel("Distance from Center (X)", fontsize=20, labelpad=15, color=INK)
ax.set_ylabel("Distance from Center (Y)", fontsize=20, labelpad=15, color=INK)
ax.set_zlabel("Amplitude (Z)", fontsize=20, labelpad=15, color=INK)
ax.set_title("wireframe-3d-basic · matplotlib · anyplot.ai", fontsize=24, pad=20, color=INK)

# Tick parameters
ax.tick_params(axis="both", labelsize=16, colors=INK_SOFT)
ax.tick_params(axis="z", labelsize=16, colors=INK_SOFT)

# Theme-adaptive panes and grid
ax.xaxis.pane.set_facecolor(PAGE_BG)
ax.yaxis.pane.set_facecolor(PAGE_BG)
ax.zaxis.pane.set_facecolor(PAGE_BG)
ax.xaxis.pane.set_edgecolor(INK_SOFT)
ax.yaxis.pane.set_edgecolor(INK_SOFT)
ax.zaxis.pane.set_edgecolor(INK_SOFT)
ax.grid(True, alpha=0.15, linestyle="-", color=INK_SOFT, linewidth=0.8)

plt.tight_layout()
plt.savefig(f"plot-{THEME}.png", dpi=300, bbox_inches="tight", facecolor=PAGE_BG)
Runnable source as JSON, for any HTTP client: https://api.anyplot.ai/specs/wireframe-3d-basic/matplotlib/code. Any spec id and library id listed in llms-full.txt fit the same URL shape; every URL below is complete and callable.
{
  "spec_id": "wireframe-3d-basic",
  "language": "python",
  "library": "matplotlib",
  "page": "https://anyplot.ai/wireframe-3d-basic/python/matplotlib",
  "hub": "https://anyplot.ai/wireframe-3d-basic",
  "code_json": "https://api.anyplot.ai/specs/wireframe-3d-basic/matplotlib/code",
  "spec_json": "https://api.anyplot.ai/specs/wireframe-3d-basic",
  "render_light_png": "https://storage.googleapis.com/anyplot-images/plots/wireframe-3d-basic/python/matplotlib/plot-light.png",
  "render_dark_png": "https://storage.googleapis.com/anyplot-images/plots/wireframe-3d-basic/python/matplotlib/plot-dark.png",
  "quality_score": 91.0,
  "license": "MIT",
  "guide": "https://anyplot.ai/llms.txt"
}
Part of Basic 3D Wireframe Plot on anyplot.ai.