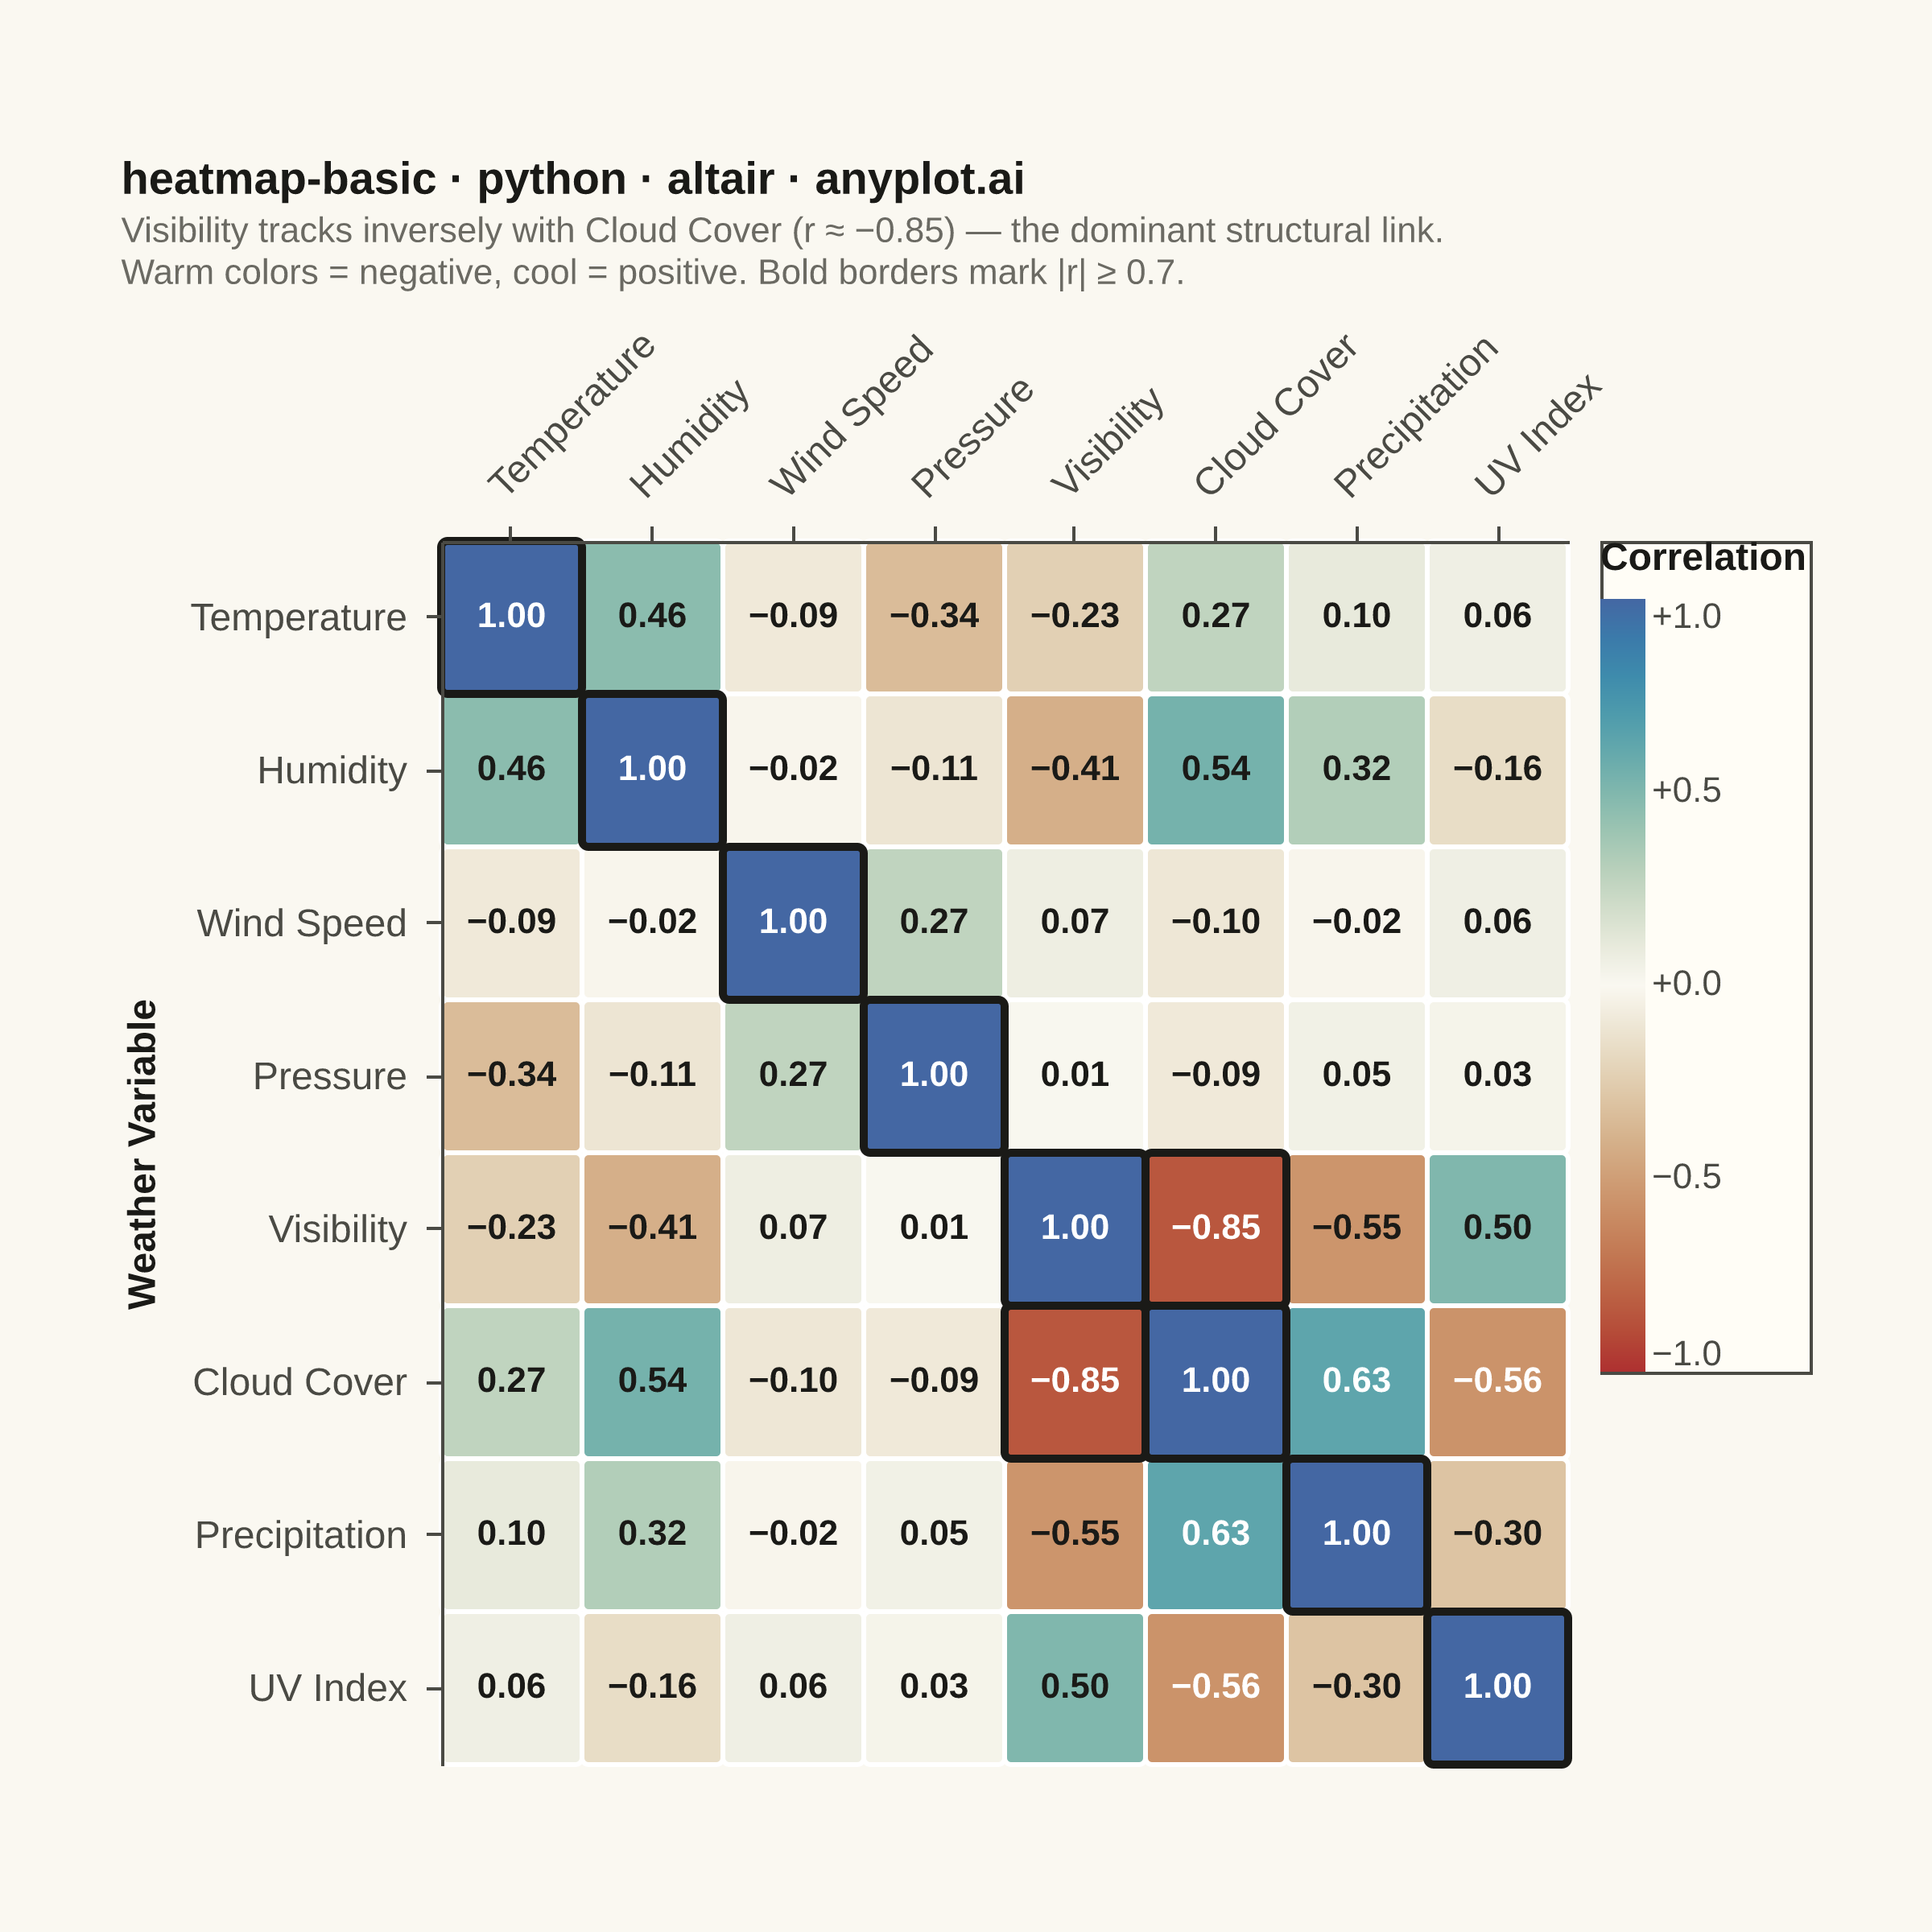
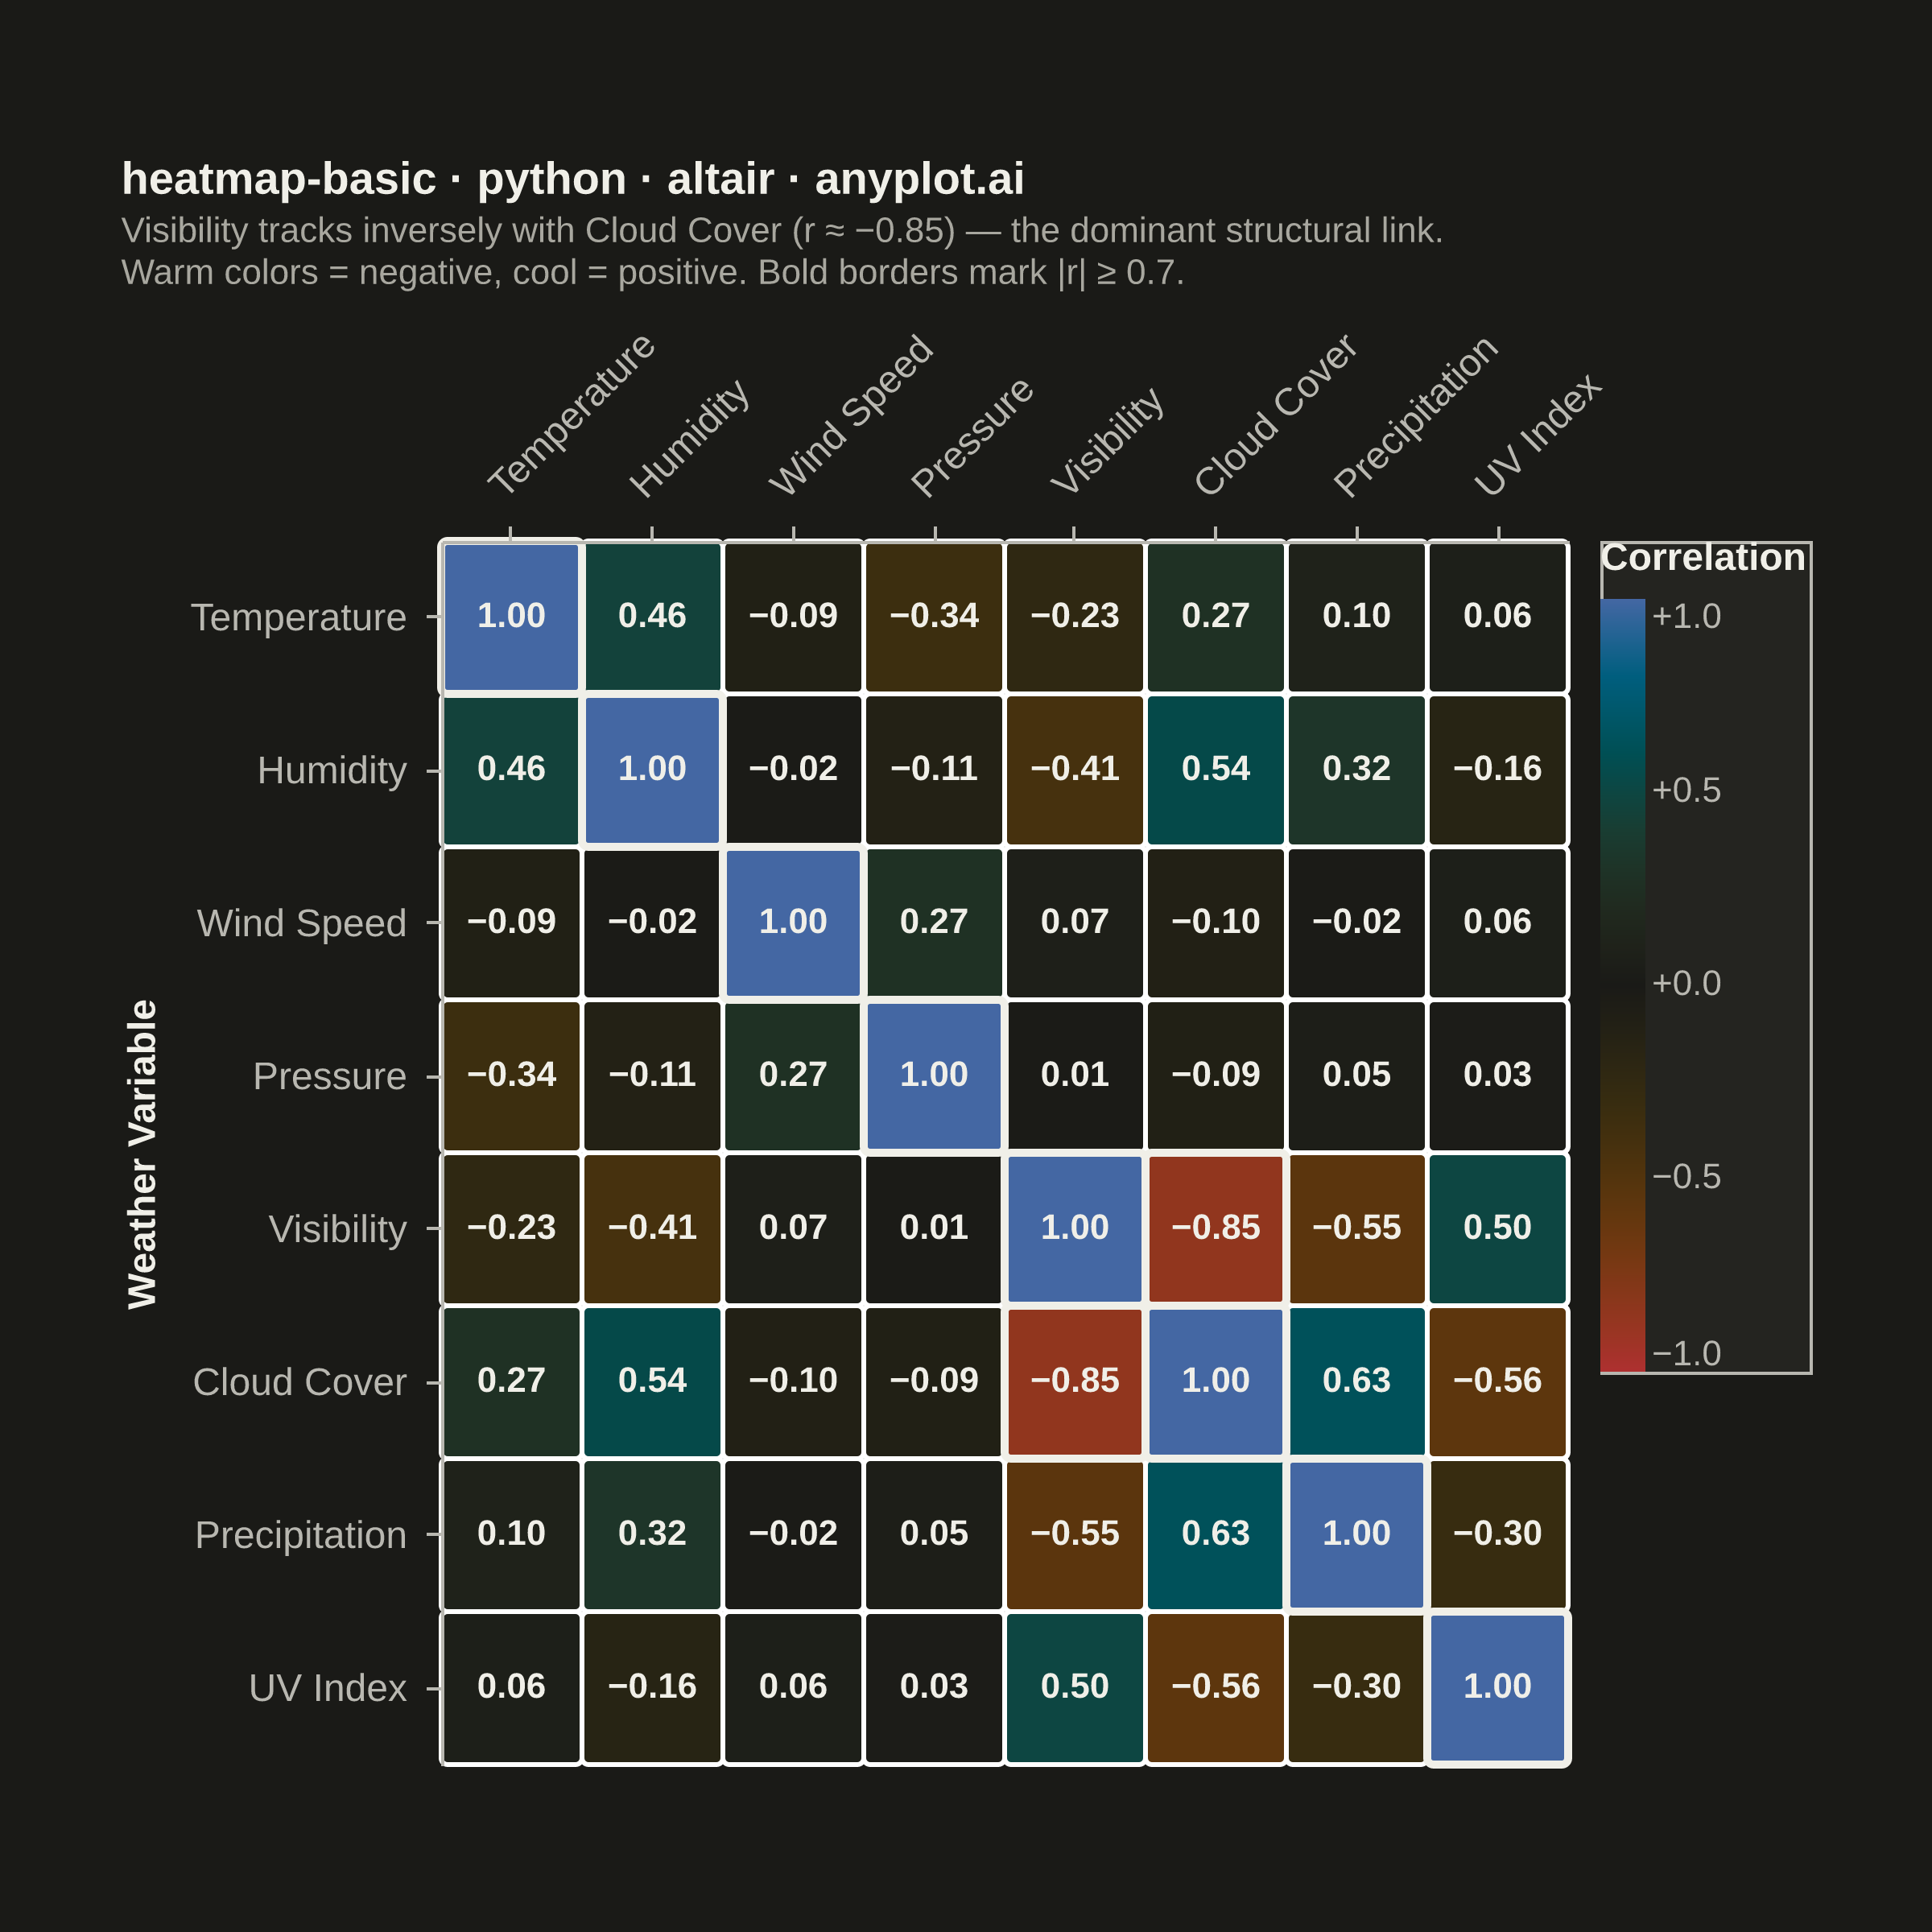
A heatmap displaying values in a matrix format using color intensity. Each cell's color represents the magnitude of the value, making it easy to identify patterns, clusters, and outliers in two-dimensional data. Essential for visualizing correlations, frequencies, and relationships between variables.
Preview render from the Altair implementation.