The same plot in 14 other libraries — Python: Altair, Bokeh, lets-plot, Matplotlib, Plotly, plotnine, Pygal, Seaborn; R: ggplot2; JavaScript: Chart.js, D3.js, Apache ECharts, Highcharts, MUI X Charts. Compare all 15 side by side: Basic Heatmap in Python, R, Julia and JavaScript.
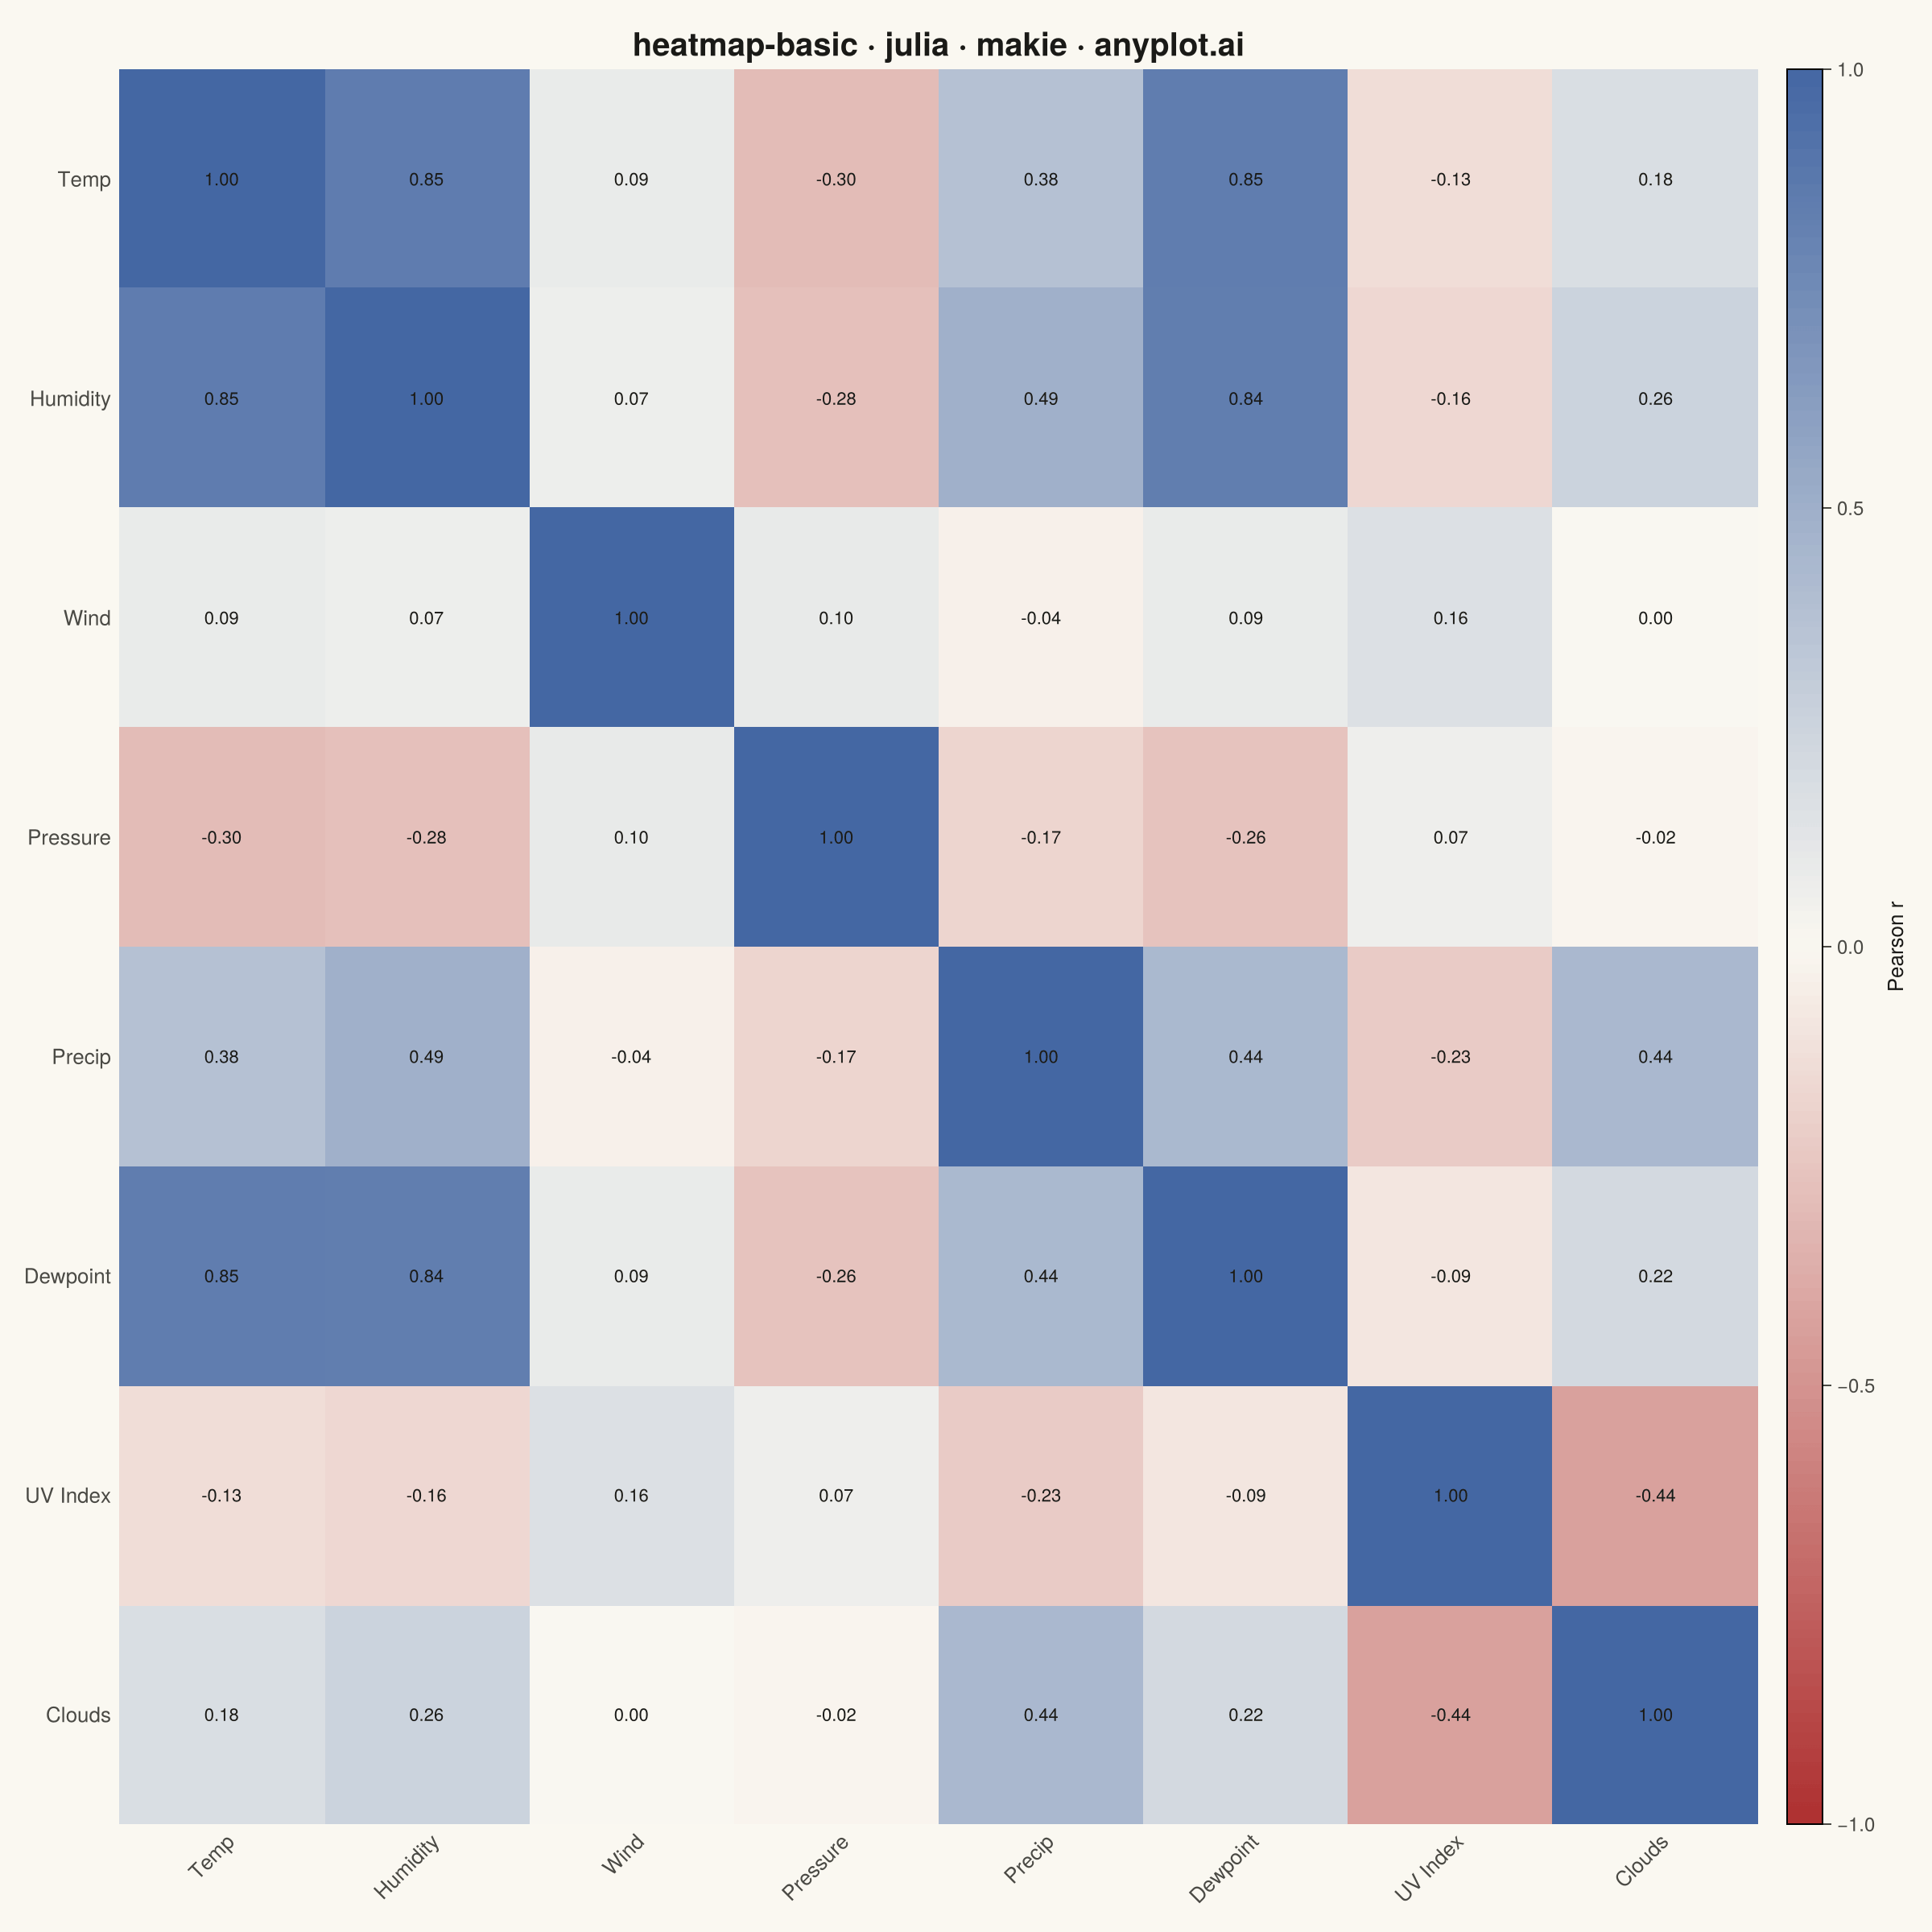
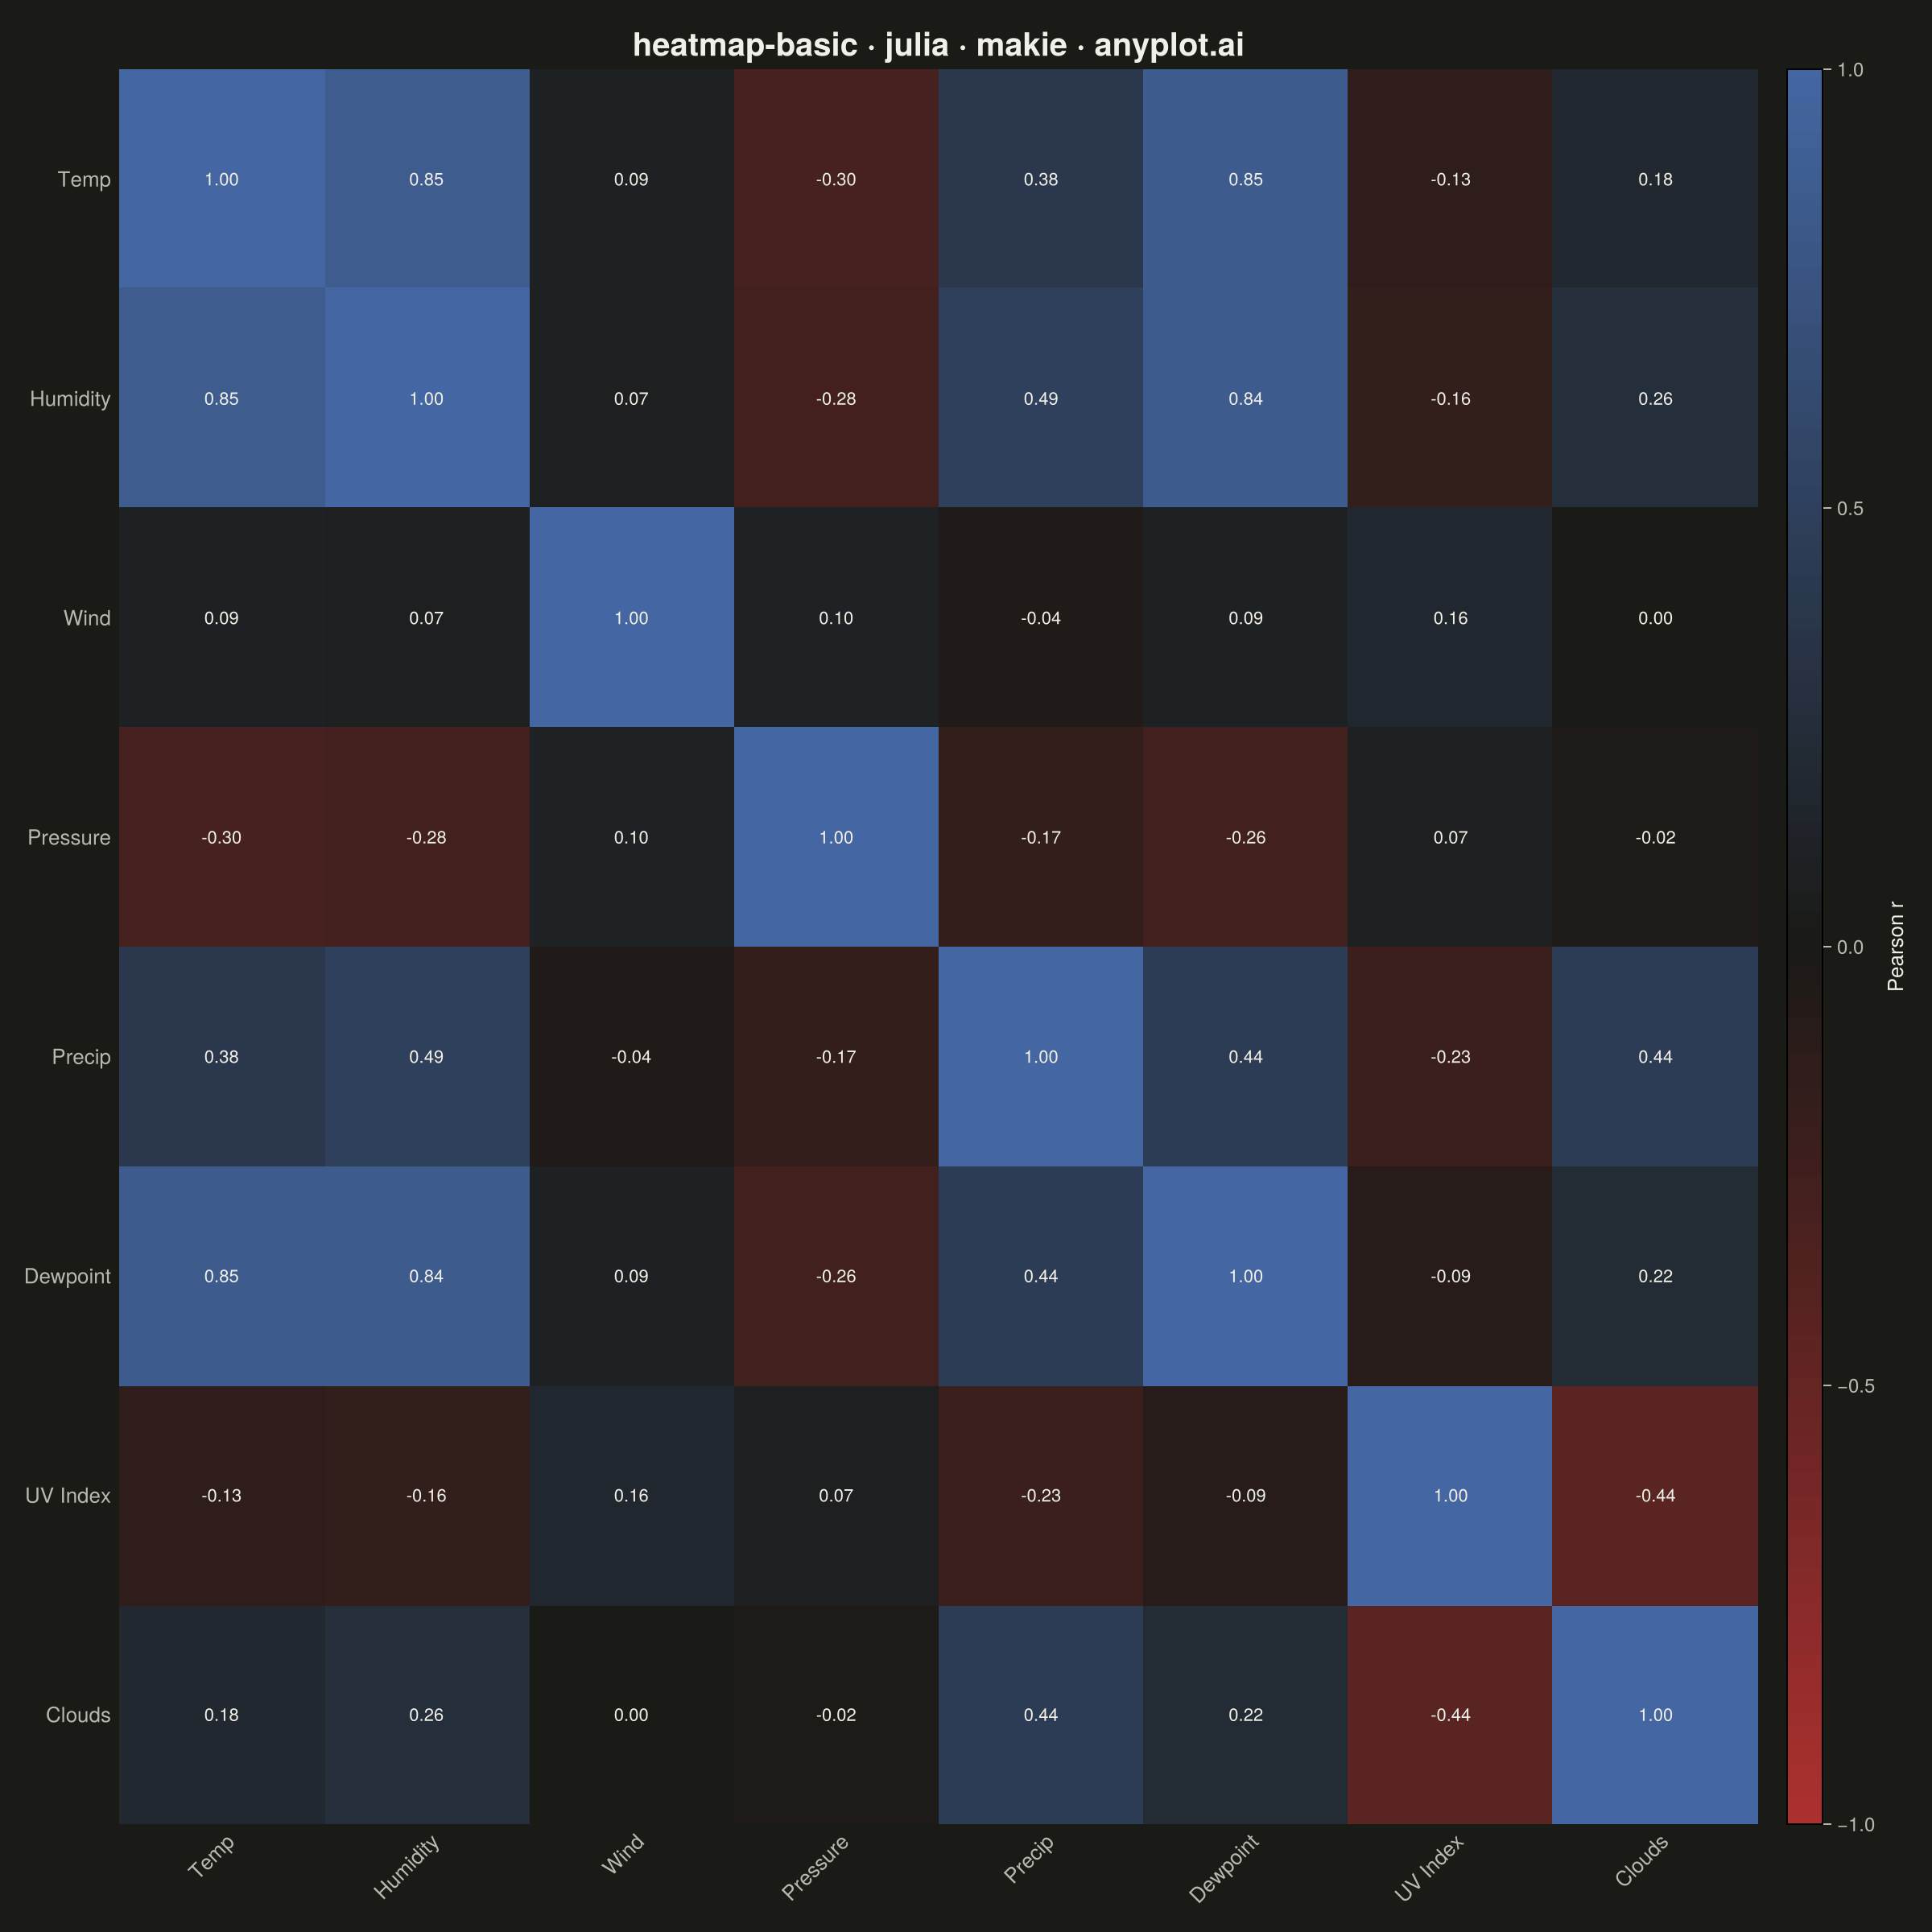
A heatmap displaying values in a matrix format using color intensity. Each cell's color represents the magnitude of the value, making it easy to identify patterns, clusters, and outliers in two-dimensional data. Essential for visualizing correlations, frequencies, and relationships between variables.
# anyplot.ai
# heatmap-basic: Basic Heatmap
# Library: makie 0.22.10 | Julia 1.11.9
# Quality: 88/100 | Created: 2026-05-28

using CairoMakie
using Colors
using Random
using Statistics
using Printf

Random.seed!(42)

# Theme tokens
const THEME    = get(ENV, "ANYPLOT_THEME", "light")
const PAGE_BG  = THEME == "light" ? colorant"#FAF8F1" : colorant"#1A1A17"
const INK      = THEME == "light" ? colorant"#1A1A17" : colorant"#F0EFE8"
const INK_SOFT = THEME == "light" ? colorant"#4A4A44" : colorant"#B8B7B0"

# Imprint diverging colormap (correlation data: meaningful midpoint at zero)
const _midpoint   = THEME == "light" ? colorant"#FAF8F1" : colorant"#1A1A17"
const ANYPLOT_DIV = cgrad([colorant"#AE3030", _midpoint, colorant"#4467A3"])

# Data — climate variables, 200 daily observations
# Grouped by natural cluster for visual story:
#   warm-moisture: Temp, Dewpoint, Humidity, Precip
#   atmospheric:   Wind, Pressure, Clouds, UV Index
var_labels = ["Temp", "Dewpoint", "Humidity", "Precip", "Wind", "Pressure", "Clouds", "UV Index"]
n          = length(var_labels)

obs_raw = zeros(200, 8)
obs_raw[:, 1] = randn(200)                                                             # Temperature
obs_raw[:, 6] = 0.85 .* obs_raw[:, 1] .+ 0.53 .* randn(200)                          # Dewpoint ~ Temp
obs_raw[:, 2] = 0.45 .* obs_raw[:, 1] .+ 0.45 .* obs_raw[:, 6] .+ 0.45 .* randn(200) # Humidity
obs_raw[:, 5] = 0.55 .* obs_raw[:, 2] .+ 0.84 .* randn(200)                          # Precip ~ Humidity
obs_raw[:, 8] = 0.40 .* obs_raw[:, 5] .+ 0.92 .* randn(200)                          # Clouds ~ Precip
obs_raw[:, 7] = -0.55 .* obs_raw[:, 8] .+ 0.84 .* randn(200)                         # UV Index ~ -Clouds
obs_raw[:, 3] = 0.15 .* obs_raw[:, 1] .+ 0.99 .* randn(200)                          # Wind (mostly noise)
obs_raw[:, 4] = -0.25 .* obs_raw[:, 1] .+ 0.97 .* randn(200)                         # Pressure ~ -Temp

# Reorder: [Temp=1, Dewpoint=6, Humidity=2, Precip=5 | Wind=3, Pressure=4, Clouds=8, UV=7]
obs      = obs_raw[:, [1, 6, 2, 5, 3, 4, 8, 7]]
corr_mat = cor(obs)

# Square canvas for symmetric heatmap
fig = Figure(
    size            = (1200, 1200),
    fontsize        = 14,
    backgroundcolor = PAGE_BG,
)

ax = Axis(
    fig[1, 1];
    title              = "heatmap-basic · julia · makie · anyplot.ai",
    titlesize          = 20,
    titlecolor         = INK,
    subtitle           = "Climate Variables · 200 Daily Observations",
    subtitlesize       = 13,
    subtitlecolor      = INK_SOFT,
    xlabel             = "",
    ylabel             = "",
    xticklabelcolor    = INK_SOFT,
    yticklabelcolor    = INK_SOFT,
    xticksize          = 0,
    yticksize          = 0,
    backgroundcolor    = PAGE_BG,
    topspinevisible    = false,
    rightspinevisible  = false,
    leftspinevisible   = false,
    bottomspinevisible = false,
    xgridvisible       = false,
    ygridvisible       = false,
    xticks             = (1:n, var_labels),
    yticks             = (1:n, var_labels),
    xticklabelrotation = π / 4,
    xticklabelsize     = 13,
    yticklabelsize     = 13,
    yreversed          = true,
)

hm = heatmap!(ax, 1:n, 1:n, corr_mat;
    colormap   = ANYPLOT_DIV,
    colorrange = (-1.0, 1.0),
)

# Thin cell grid lines — delineate cells, especially near-zero in dark theme
cell_edges = [i + 0.5 for i in 0:n]
vlines!(ax, cell_edges; color = RGBAf(INK.r, INK.g, INK.b, 0.20), linewidth = 0.6)
hlines!(ax, cell_edges; color = RGBAf(INK.r, INK.g, INK.b, 0.20), linewidth = 0.6)

# Highlight warm-moisture cluster (top-left 4×4 block: Temp/Dewpoint/Humidity/Precip)
lines!(ax,
    [0.5, 4.5, 4.5, 0.5, 0.5],
    [0.5, 0.5, 4.5, 4.5, 0.5];
    color     = colorant"#009E73",
    linewidth = 3.0,
)

# Cell value annotations — fontsize=13 for mobile readability on dense 64-cell grid
positions   = Point2f[]
cell_labels = String[]
for i in 1:n, j in 1:n
    push!(positions, Point2f(i, j))
    push!(cell_labels, @sprintf("%.2f", corr_mat[i, j]))
end
text!(ax, positions; text = cell_labels, align = (:center, :center), color = INK, fontsize = 13)

# Colorbar
Colorbar(fig[1, 2], hm;
    label          = "Pearson r",
    labelcolor     = INK,
    tickcolor      = INK_SOFT,
    ticklabelcolor = INK_SOFT,
    ticklabelsize  = 12,
    labelsize      = 13,
    width          = 22,
)

# Fine-tune gap between heatmap and colorbar
colgap!(fig.layout, 1, 12)

# Save
save("plot-$(THEME).png", fig; px_per_unit = 2)
Runnable source as JSON, for any HTTP client: https://api.anyplot.ai/specs/heatmap-basic/makie/code. Any spec id and library id listed in llms-full.txt fit the same URL shape; every URL below is complete and callable.
{
  "spec_id": "heatmap-basic",
  "language": "julia",
  "library": "makie",
  "page": "https://anyplot.ai/heatmap-basic/julia/makie",
  "hub": "https://anyplot.ai/heatmap-basic",
  "code_json": "https://api.anyplot.ai/specs/heatmap-basic/makie/code",
  "spec_json": "https://api.anyplot.ai/specs/heatmap-basic",
  "render_light_png": "https://storage.googleapis.com/anyplot-images/plots/heatmap-basic/julia/makie/plot-light.png",
  "render_dark_png": "https://storage.googleapis.com/anyplot-images/plots/heatmap-basic/julia/makie/plot-dark.png",
  "quality_score": 88.0,
  "license": "MIT",
  "guide": "https://anyplot.ai/llms.txt"
}
Part of Basic Heatmap on anyplot.ai.