The same plot in 14 other libraries — JavaScript: D3.js, Apache ECharts, Highcharts, MUI X Charts; Python: Altair, Bokeh, lets-plot, Matplotlib, Plotly, plotnine, Pygal, Seaborn; R: ggplot2; Julia: Makie.jl. Compare all 15 side by side: Basic Heatmap in Python, R, Julia and JavaScript.
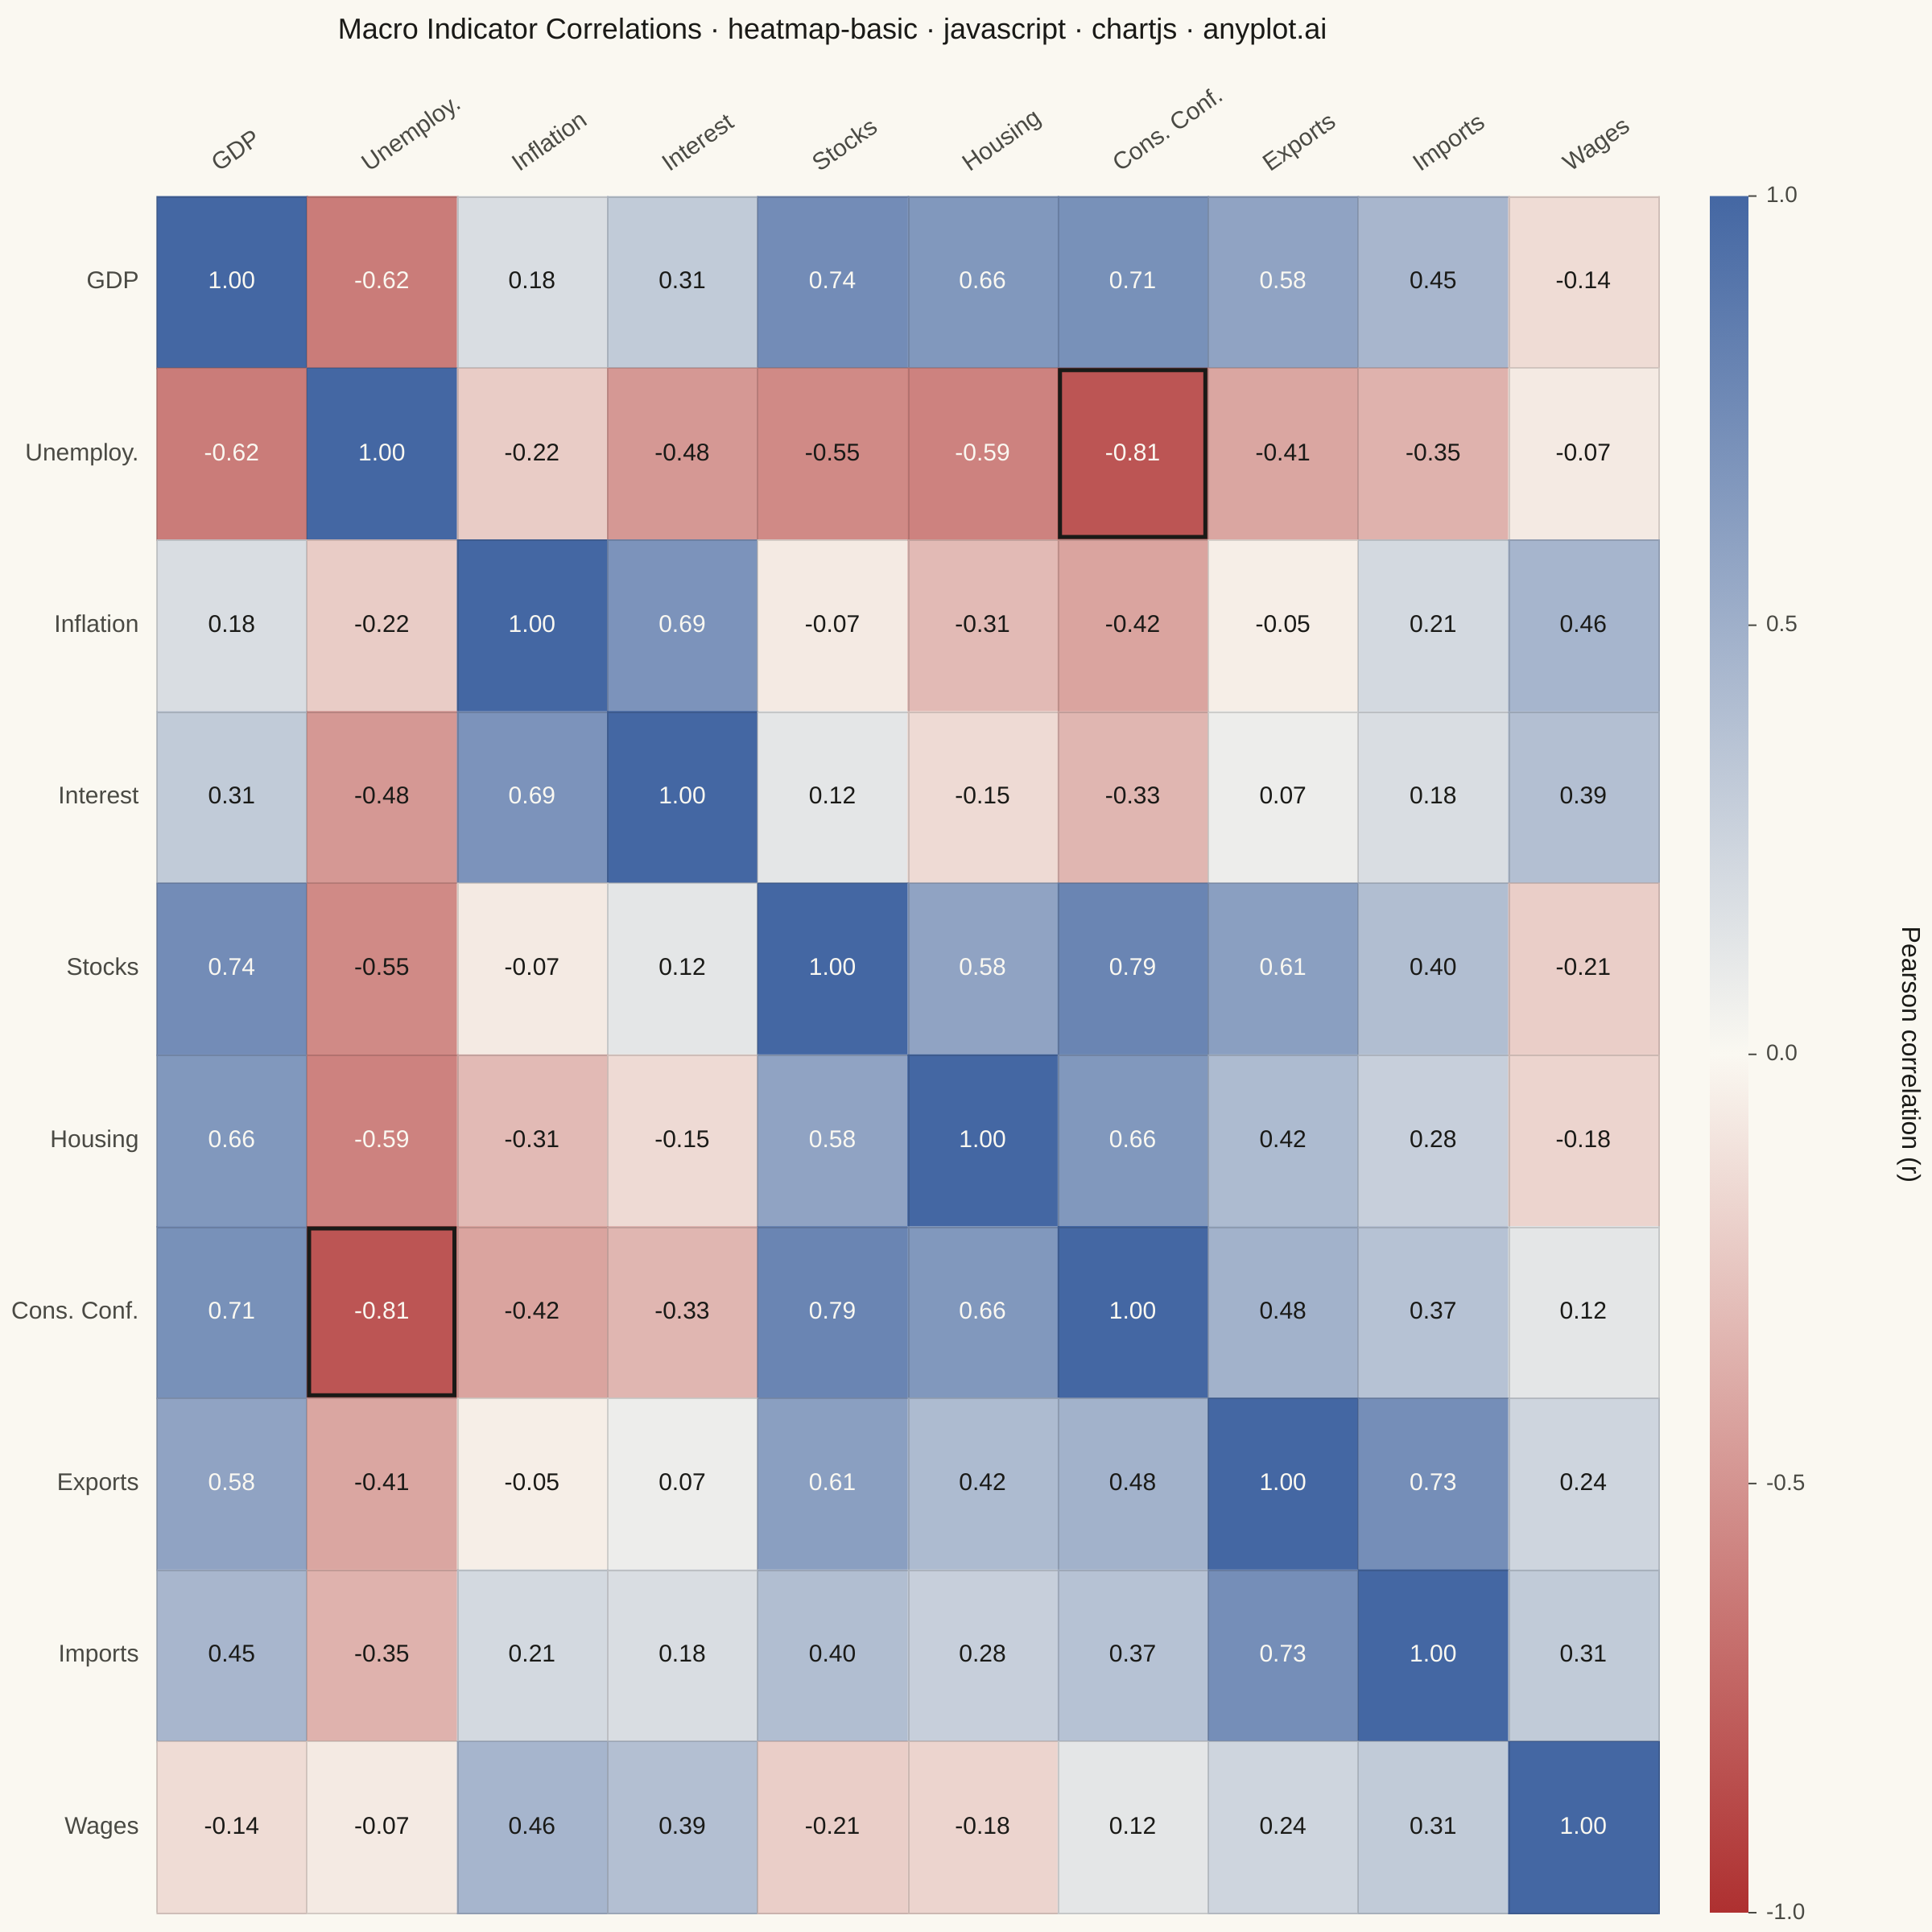
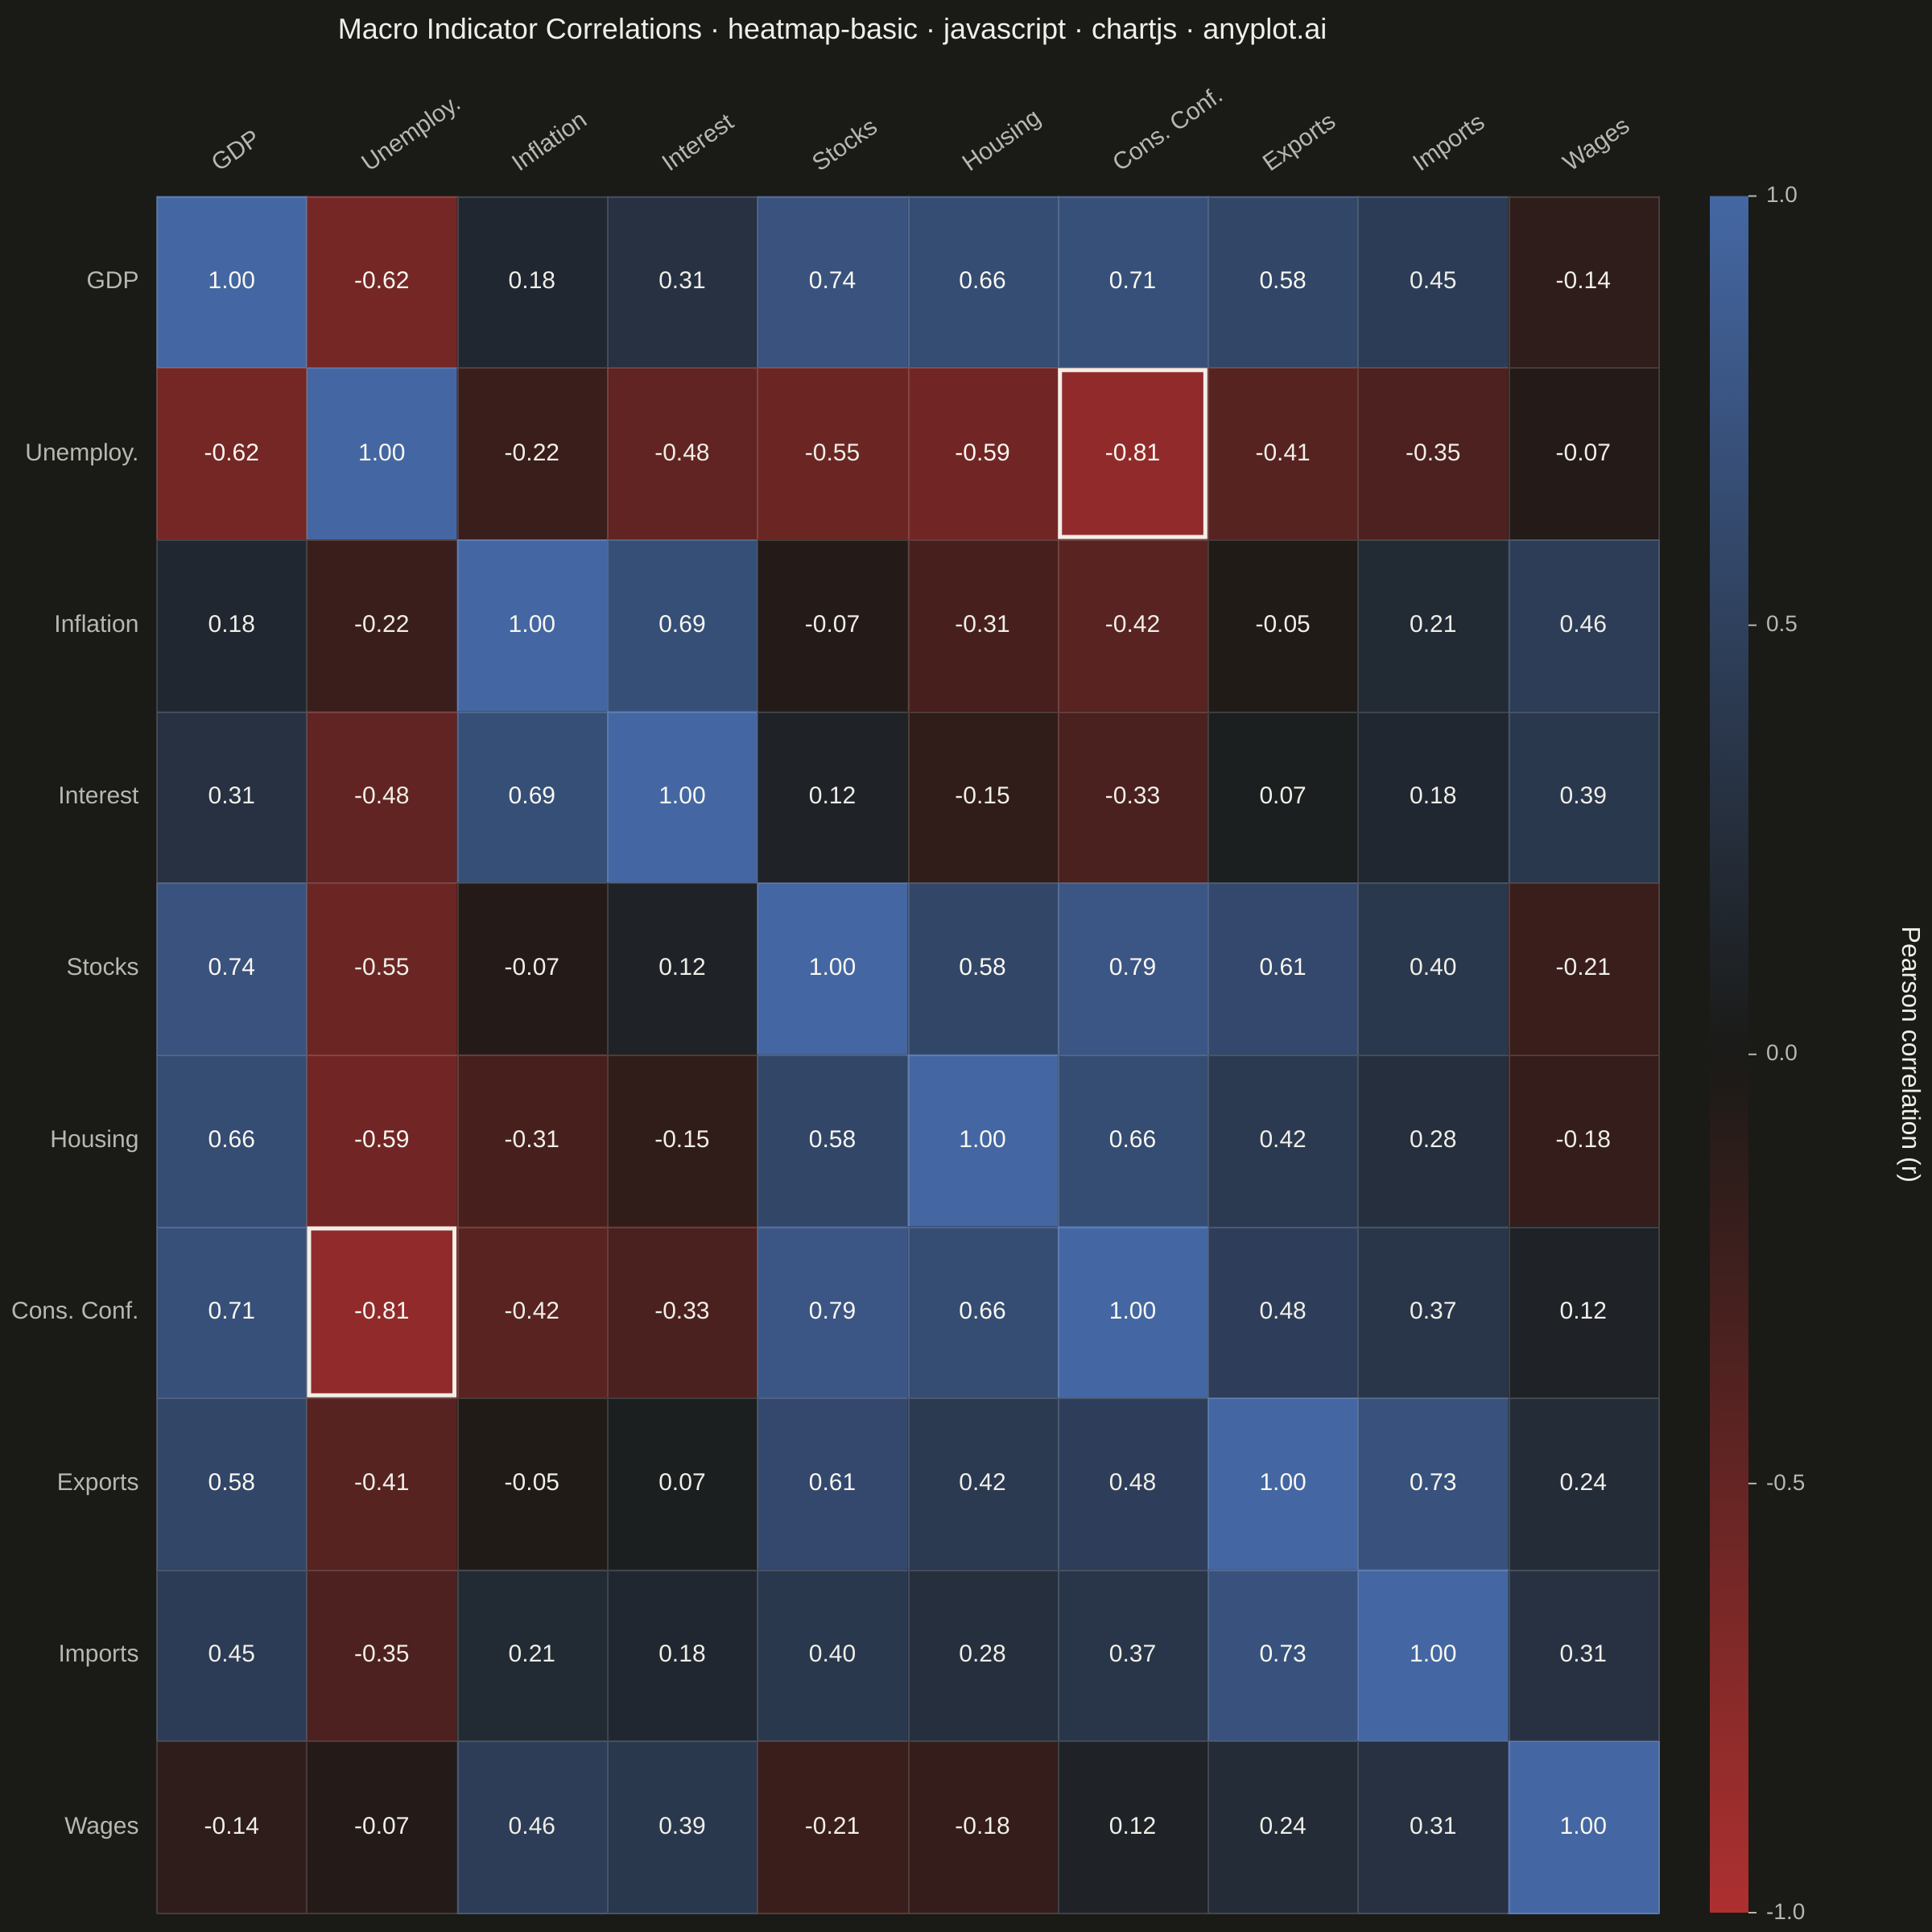
A heatmap displaying values in a matrix format using color intensity. Each cell's color represents the magnitude of the value, making it easy to identify patterns, clusters, and outliers in two-dimensional data. Essential for visualizing correlations, frequencies, and relationships between variables.
// anyplot.ai
// heatmap-basic: Basic Heatmap
// Library: chartjs 4.4.7 | JavaScript 22.22.3
// Quality: 92/100 | Updated: 2026-06-03
//# anyplot-orientation: square

const t = window.ANYPLOT_TOKENS;

// Data — Pearson correlations between 10 macroeconomic indicators.
// Diverging polarity (−1..+1) → Imprint imprint_div colormap is the right fit.
const labels = [
  "GDP",
  "Unemploy.",
  "Inflation",
  "Interest",
  "Stocks",
  "Housing",
  "Cons. Conf.",
  "Exports",
  "Imports",
  "Wages",
];
const N = labels.length;

const matrix = [
  [ 1.00, -0.62,  0.18,  0.31,  0.74,  0.66,  0.71,  0.58,  0.45, -0.14],
  [-0.62,  1.00, -0.22, -0.48, -0.55, -0.59, -0.81, -0.41, -0.35, -0.07],
  [ 0.18, -0.22,  1.00,  0.69, -0.07, -0.31, -0.42, -0.05,  0.21,  0.46],
  [ 0.31, -0.48,  0.69,  1.00,  0.12, -0.15, -0.33,  0.07,  0.18,  0.39],
  [ 0.74, -0.55, -0.07,  0.12,  1.00,  0.58,  0.79,  0.61,  0.40, -0.21],
  [ 0.66, -0.59, -0.31, -0.15,  0.58,  1.00,  0.66,  0.42,  0.28, -0.18],
  [ 0.71, -0.81, -0.42, -0.33,  0.79,  0.66,  1.00,  0.48,  0.37,  0.12],
  [ 0.58, -0.41, -0.05,  0.07,  0.61,  0.42,  0.48,  1.00,  0.73,  0.24],
  [ 0.45, -0.35,  0.21,  0.18,  0.40,  0.28,  0.37,  0.73,  1.00,  0.31],
  [-0.14, -0.07,  0.46,  0.39, -0.21, -0.18,  0.12,  0.24,  0.31,  1.00],
];

// Focal pair — strongest off-diagonal correlation (Cons. Conf. × Unemploy.
// = -0.81). A heavier t.ink stroke gives the eye a single anchor.
const FOCAL = [[1, 6], [6, 1]];

// imprint_div interpolation (red ↔ theme midpoint ↔ blue) — t.div is already
// theme-adaptive (midpoint = pageBg).
function hexToRgb(hex) {
  const h = hex.replace("#", "");
  return [
    parseInt(h.slice(0, 2), 16),
    parseInt(h.slice(2, 4), 16),
    parseInt(h.slice(4, 6), 16),
  ];
}
const C_LO = hexToRgb(t.div[0]);
const C_MID = hexToRgb(t.div[1]);
const C_HI = hexToRgb(t.div[2]);
function divColor(v) {
  const u = Math.max(0, Math.min(1, (v + 1) / 2));
  const [a, b] = u <= 0.5 ? [C_LO, C_MID] : [C_MID, C_HI];
  const w = u <= 0.5 ? u * 2 : (u - 0.5) * 2;
  return `rgb(${(a[0] + (b[0] - a[0]) * w) | 0},${(a[1] + (b[1] - a[1]) * w) | 0},${(a[2] + (b[2] - a[2]) * w) | 0})`;
}

const FONT_STACK =
  '-apple-system, BlinkMacSystemFont, "Segoe UI", Roboto, Helvetica, Arial, sans-serif';

// Custom Chart.js plugin — paints heatmap cells, writes per-cell correlation
// values, and renders a vertical colorbar in the right-side padding reserved
// via options.layout.padding.
const heatmapPainter = {
  id: "heatmap-painter",
  beforeDatasetsDraw(chart) {
    const { ctx, chartArea } = chart;
    const { left, right, top, bottom } = chartArea;
    const cellW = (right - left) / N;
    const cellH = (bottom - top) / N;

    for (let i = 0; i < N; i++) {
      for (let j = 0; j < N; j++) {
        ctx.fillStyle = divColor(matrix[i][j]);
        ctx.fillRect(
          left + j * cellW,
          top + i * cellH,
          cellW + 1,
          cellH + 1,
        );
      }
    }

    // 1 px t.grid hairline between cells so the matrix structure remains
    // visible in dark mode even where imprint_div fades into pageBg.
    ctx.save();
    ctx.strokeStyle = t.grid;
    ctx.lineWidth = 1;
    ctx.beginPath();
    for (let k = 0; k <= N; k++) {
      const x = Math.round(left + k * cellW) + 0.5;
      ctx.moveTo(x, top);
      ctx.lineTo(x, bottom);
      const y = Math.round(top + k * cellH) + 0.5;
      ctx.moveTo(left, y);
      ctx.lineTo(right, y);
    }
    ctx.stroke();
    ctx.restore();

    // Focal stroke — anchor the eye on the strongest off-diagonal pair.
    ctx.save();
    ctx.strokeStyle = t.ink;
    ctx.lineWidth = 2.5;
    for (const [i, j] of FOCAL) {
      ctx.strokeRect(
        left + j * cellW + 1.5,
        top + i * cellH + 1.5,
        cellW - 3,
        cellH - 3,
      );
    }
    ctx.restore();
  },
  afterDatasetsDraw(chart) {
    const { ctx, chartArea, width } = chart;
    const { left, right, top, bottom } = chartArea;
    const cellW = (right - left) / N;
    const cellH = (bottom - top) / N;

    // Per-cell values. Light text on saturated cells, ink on near-midpoint.
    ctx.save();
    ctx.textAlign = "center";
    ctx.textBaseline = "middle";
    ctx.font = `500 15px ${FONT_STACK}`;
    for (let i = 0; i < N; i++) {
      for (let j = 0; j < N; j++) {
        const v = matrix[i][j];
        ctx.fillStyle = Math.abs(v) > 0.55 ? "#FAF8F1" : t.ink;
        ctx.fillText(
          v.toFixed(2),
          left + (j + 0.5) * cellW,
          top + (i + 0.5) * cellH,
        );
      }
    }
    ctx.restore();

    // Colorbar — vertical gradient in the right-side padding.
    const cbGap = 32;
    const cbW = 24;
    const cbLeft = right + cbGap;
    const cbTop = top;
    const cbBottom = bottom;
    const cbH = cbBottom - cbTop;

    const grad = ctx.createLinearGradient(0, cbTop, 0, cbBottom);
    grad.addColorStop(0.0, divColor(1));
    grad.addColorStop(0.5, divColor(0));
    grad.addColorStop(1.0, divColor(-1));
    ctx.fillStyle = grad;
    ctx.fillRect(cbLeft, cbTop, cbW, cbH);

    // Colorbar tick labels.
    ctx.save();
    ctx.font = `400 14px ${FONT_STACK}`;
    ctx.fillStyle = t.inkSoft;
    ctx.strokeStyle = t.inkSoft;
    ctx.lineWidth = 1;
    ctx.textAlign = "left";
    ctx.textBaseline = "middle";
    for (const v of [1, 0.5, 0, -0.5, -1]) {
      const y = cbTop + (1 - (v + 1) / 2) * cbH;
      ctx.beginPath();
      ctx.moveTo(cbLeft + cbW, y);
      ctx.lineTo(cbLeft + cbW + 5, y);
      ctx.stroke();
      ctx.fillText(v.toFixed(1), cbLeft + cbW + 11, y);
    }
    ctx.restore();

    // Colorbar title (rotated 90° clockwise, sitting against the canvas edge).
    ctx.save();
    ctx.fillStyle = t.ink;
    ctx.font = `500 16px ${FONT_STACK}`;
    ctx.textAlign = "center";
    ctx.textBaseline = "middle";
    ctx.translate(width - 14, (cbTop + cbBottom) / 2);
    ctx.rotate(Math.PI / 2);
    ctx.fillText("Pearson correlation (r)", 0, 0);
    ctx.restore();
  },
};

// Mount
const canvas = document.createElement("canvas");
document.getElementById("container").appendChild(canvas);

// Chart — scatter base purely for axis layout (no data points drawn); cells
// and colorbar are rendered by heatmapPainter against the resolved chartArea.
new Chart(canvas, {
  type: "scatter",
  data: {
    datasets: [
      {
        data: [],
        pointRadius: 0,
      },
    ],
  },
  options: {
    responsive: true,
    maintainAspectRatio: false,
    animation: false,
    layout: { padding: { top: 4, right: 170, bottom: 4, left: 4 } },
    plugins: {
      title: {
        display: true,
        text: "Macro Indicator Correlations · heatmap-basic · javascript · chartjs · anyplot.ai",
        color: t.ink,
        font: { size: 18, weight: "500" },
        padding: { top: 4, bottom: 18 },
      },
      legend: { display: false },
      tooltip: { enabled: false },
    },
    scales: {
      x: {
        type: "linear",
        min: -0.5,
        max: N - 0.5,
        position: "top",
        offset: false,
        afterBuildTicks: (axis) => {
          axis.ticks = Array.from({ length: N }, (_, i) => ({ value: i }));
        },
        ticks: {
          color: t.inkSoft,
          font: { size: 15 },
          autoSkip: false,
          callback: (v) =>
            Number.isInteger(v) && v >= 0 && v < N ? labels[v] : "",
          maxRotation: 35,
          minRotation: 35,
        },
        grid: { display: false },
        border: { display: false },
      },
      y: {
        type: "linear",
        min: -0.5,
        max: N - 0.5,
        reverse: true,
        offset: false,
        afterBuildTicks: (axis) => {
          axis.ticks = Array.from({ length: N }, (_, i) => ({ value: i }));
        },
        ticks: {
          color: t.inkSoft,
          font: { size: 15 },
          autoSkip: false,
          callback: (v) =>
            Number.isInteger(v) && v >= 0 && v < N ? labels[v] : "",
        },
        grid: { display: false },
        border: { display: false },
      },
    },
  },
  plugins: [heatmapPainter],
});
Runnable source as JSON, for any HTTP client: https://api.anyplot.ai/specs/heatmap-basic/chartjs/code. Any spec id and library id listed in llms-full.txt fit the same URL shape; every URL below is complete and callable.
{
  "spec_id": "heatmap-basic",
  "language": "javascript",
  "library": "chartjs",
  "page": "https://anyplot.ai/heatmap-basic/javascript/chartjs",
  "hub": "https://anyplot.ai/heatmap-basic",
  "code_json": "https://api.anyplot.ai/specs/heatmap-basic/chartjs/code",
  "spec_json": "https://api.anyplot.ai/specs/heatmap-basic",
  "render_light_png": "https://storage.googleapis.com/anyplot-images/plots/heatmap-basic/javascript/chartjs/plot-light.png",
  "render_dark_png": "https://storage.googleapis.com/anyplot-images/plots/heatmap-basic/javascript/chartjs/plot-dark.png",
  "interactive_light_html": "https://storage.googleapis.com/anyplot-images/plots/heatmap-basic/javascript/chartjs/plot-light.html",
  "interactive_dark_html": "https://storage.googleapis.com/anyplot-images/plots/heatmap-basic/javascript/chartjs/plot-dark.html",
  "quality_score": 92.0,
  "license": "MIT",
  "guide": "https://anyplot.ai/llms.txt"
}
Part of Basic Heatmap on anyplot.ai.