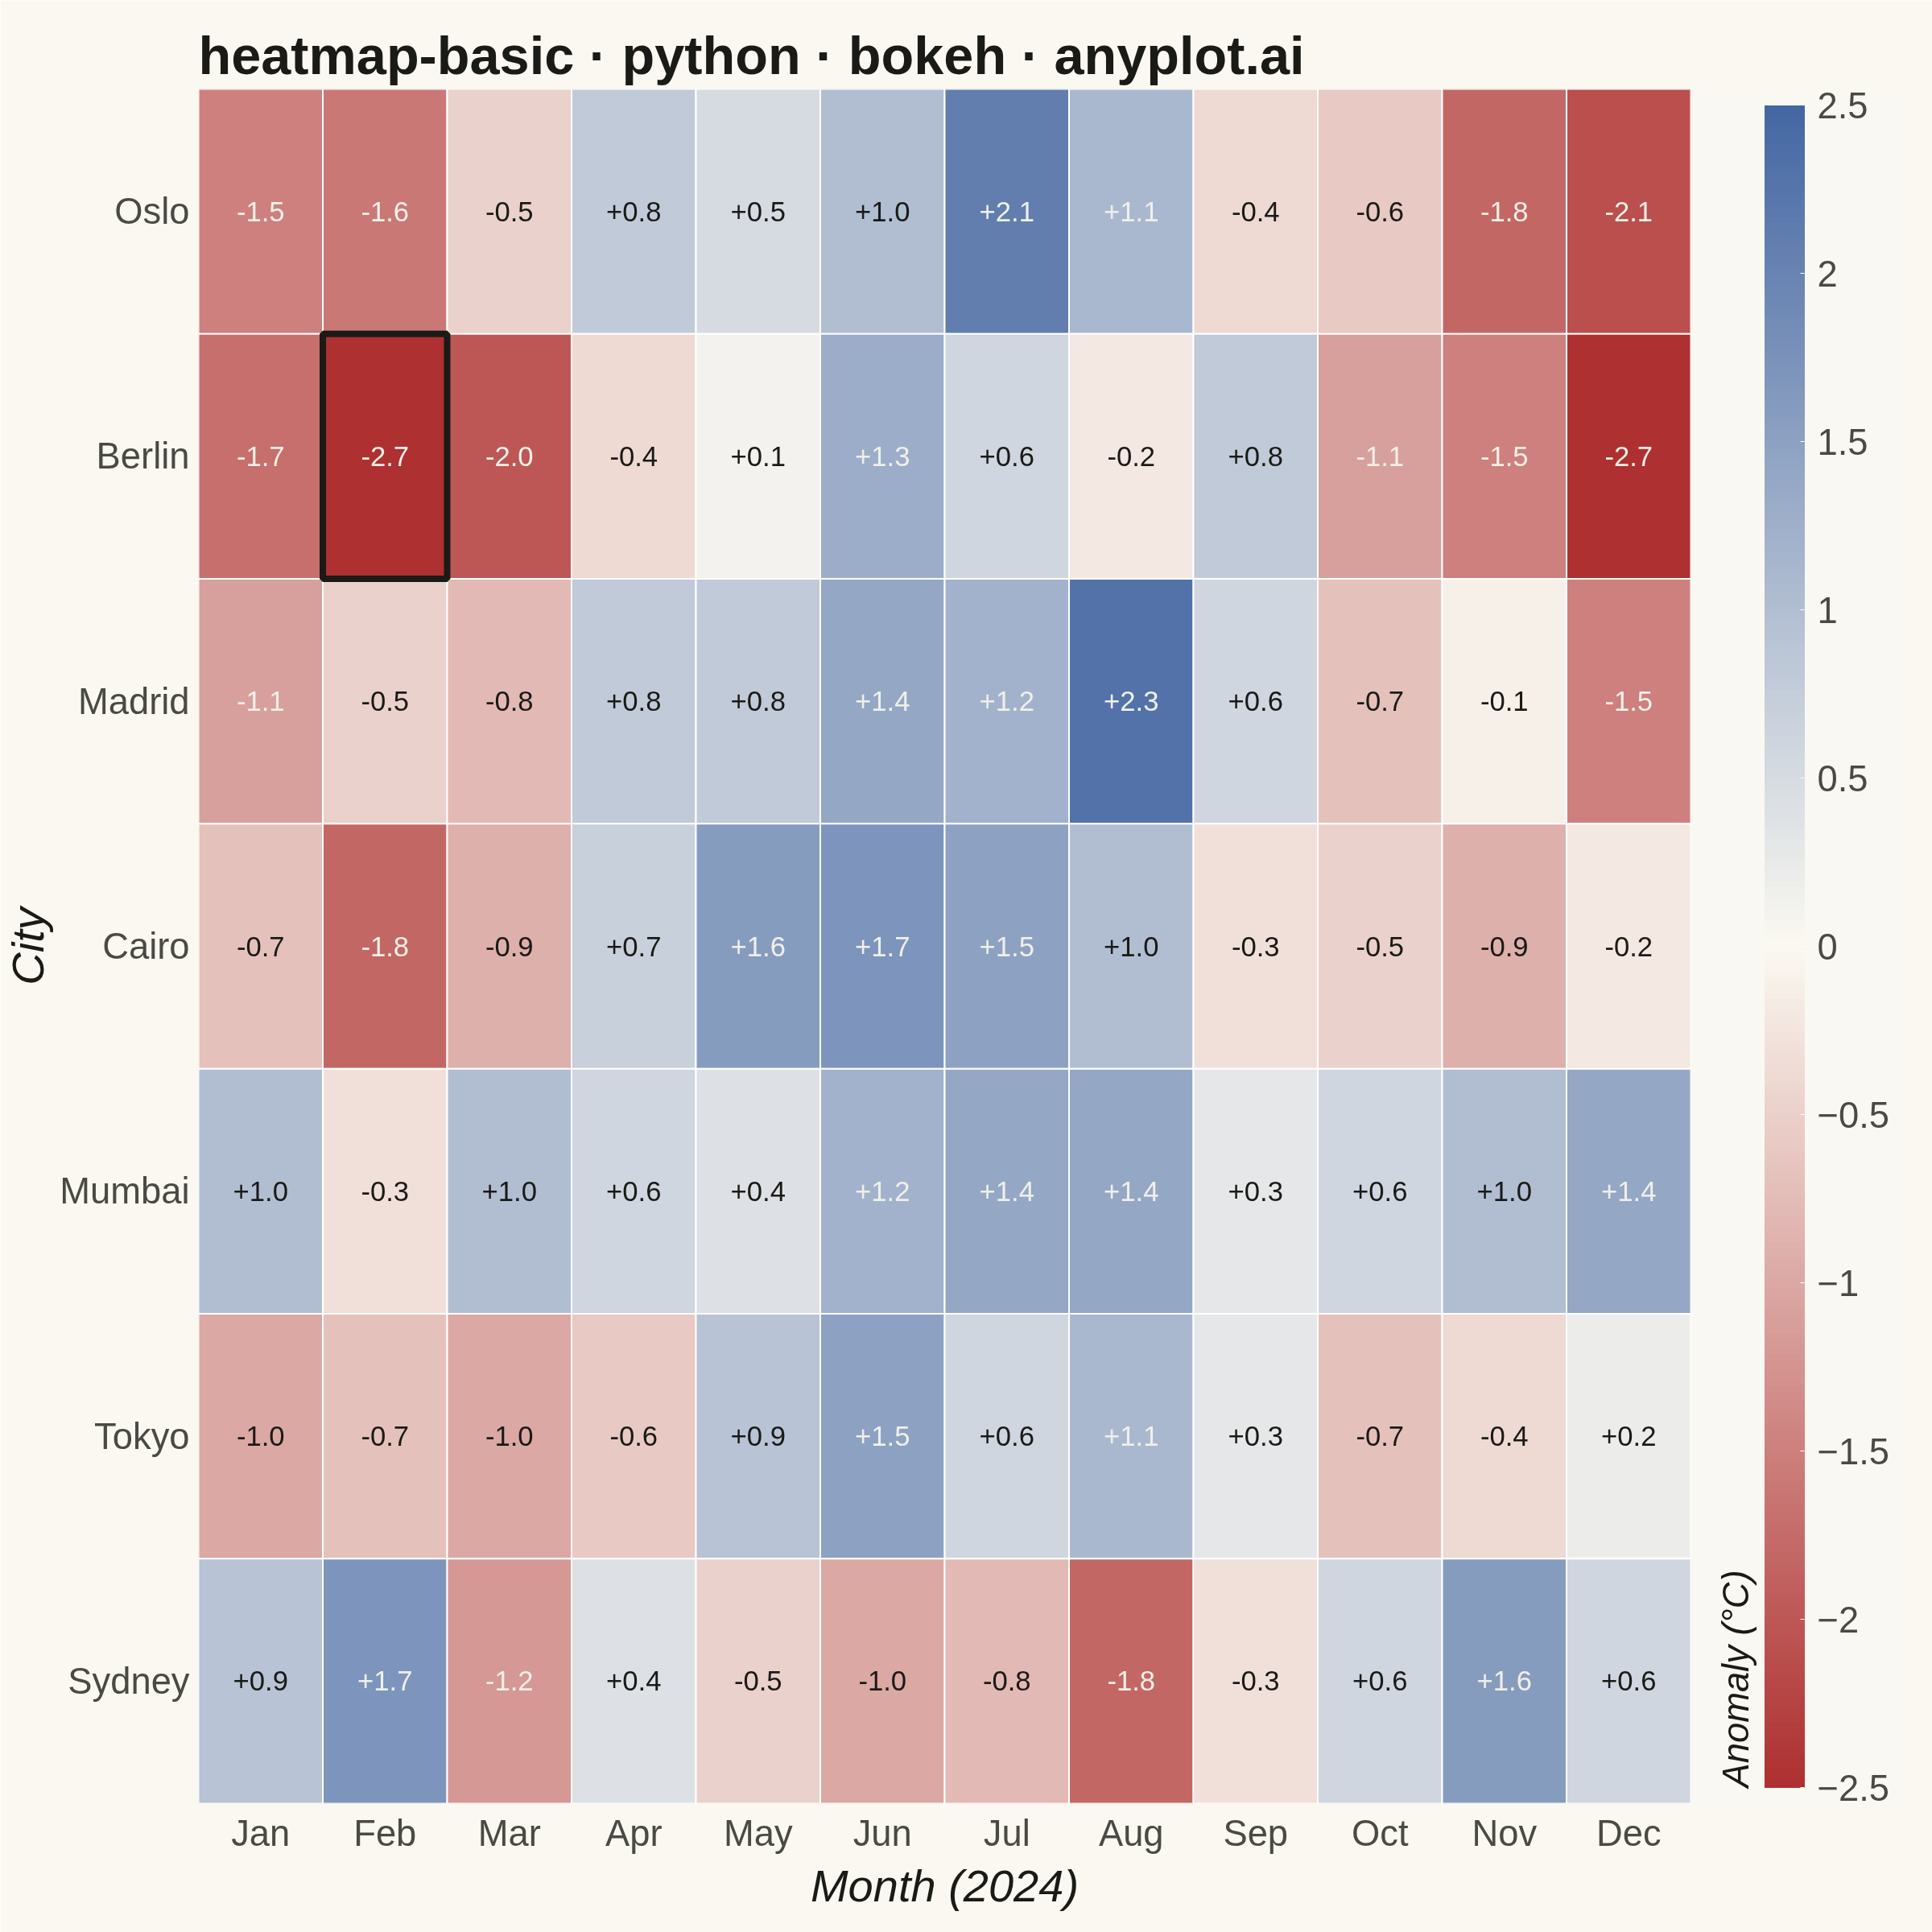
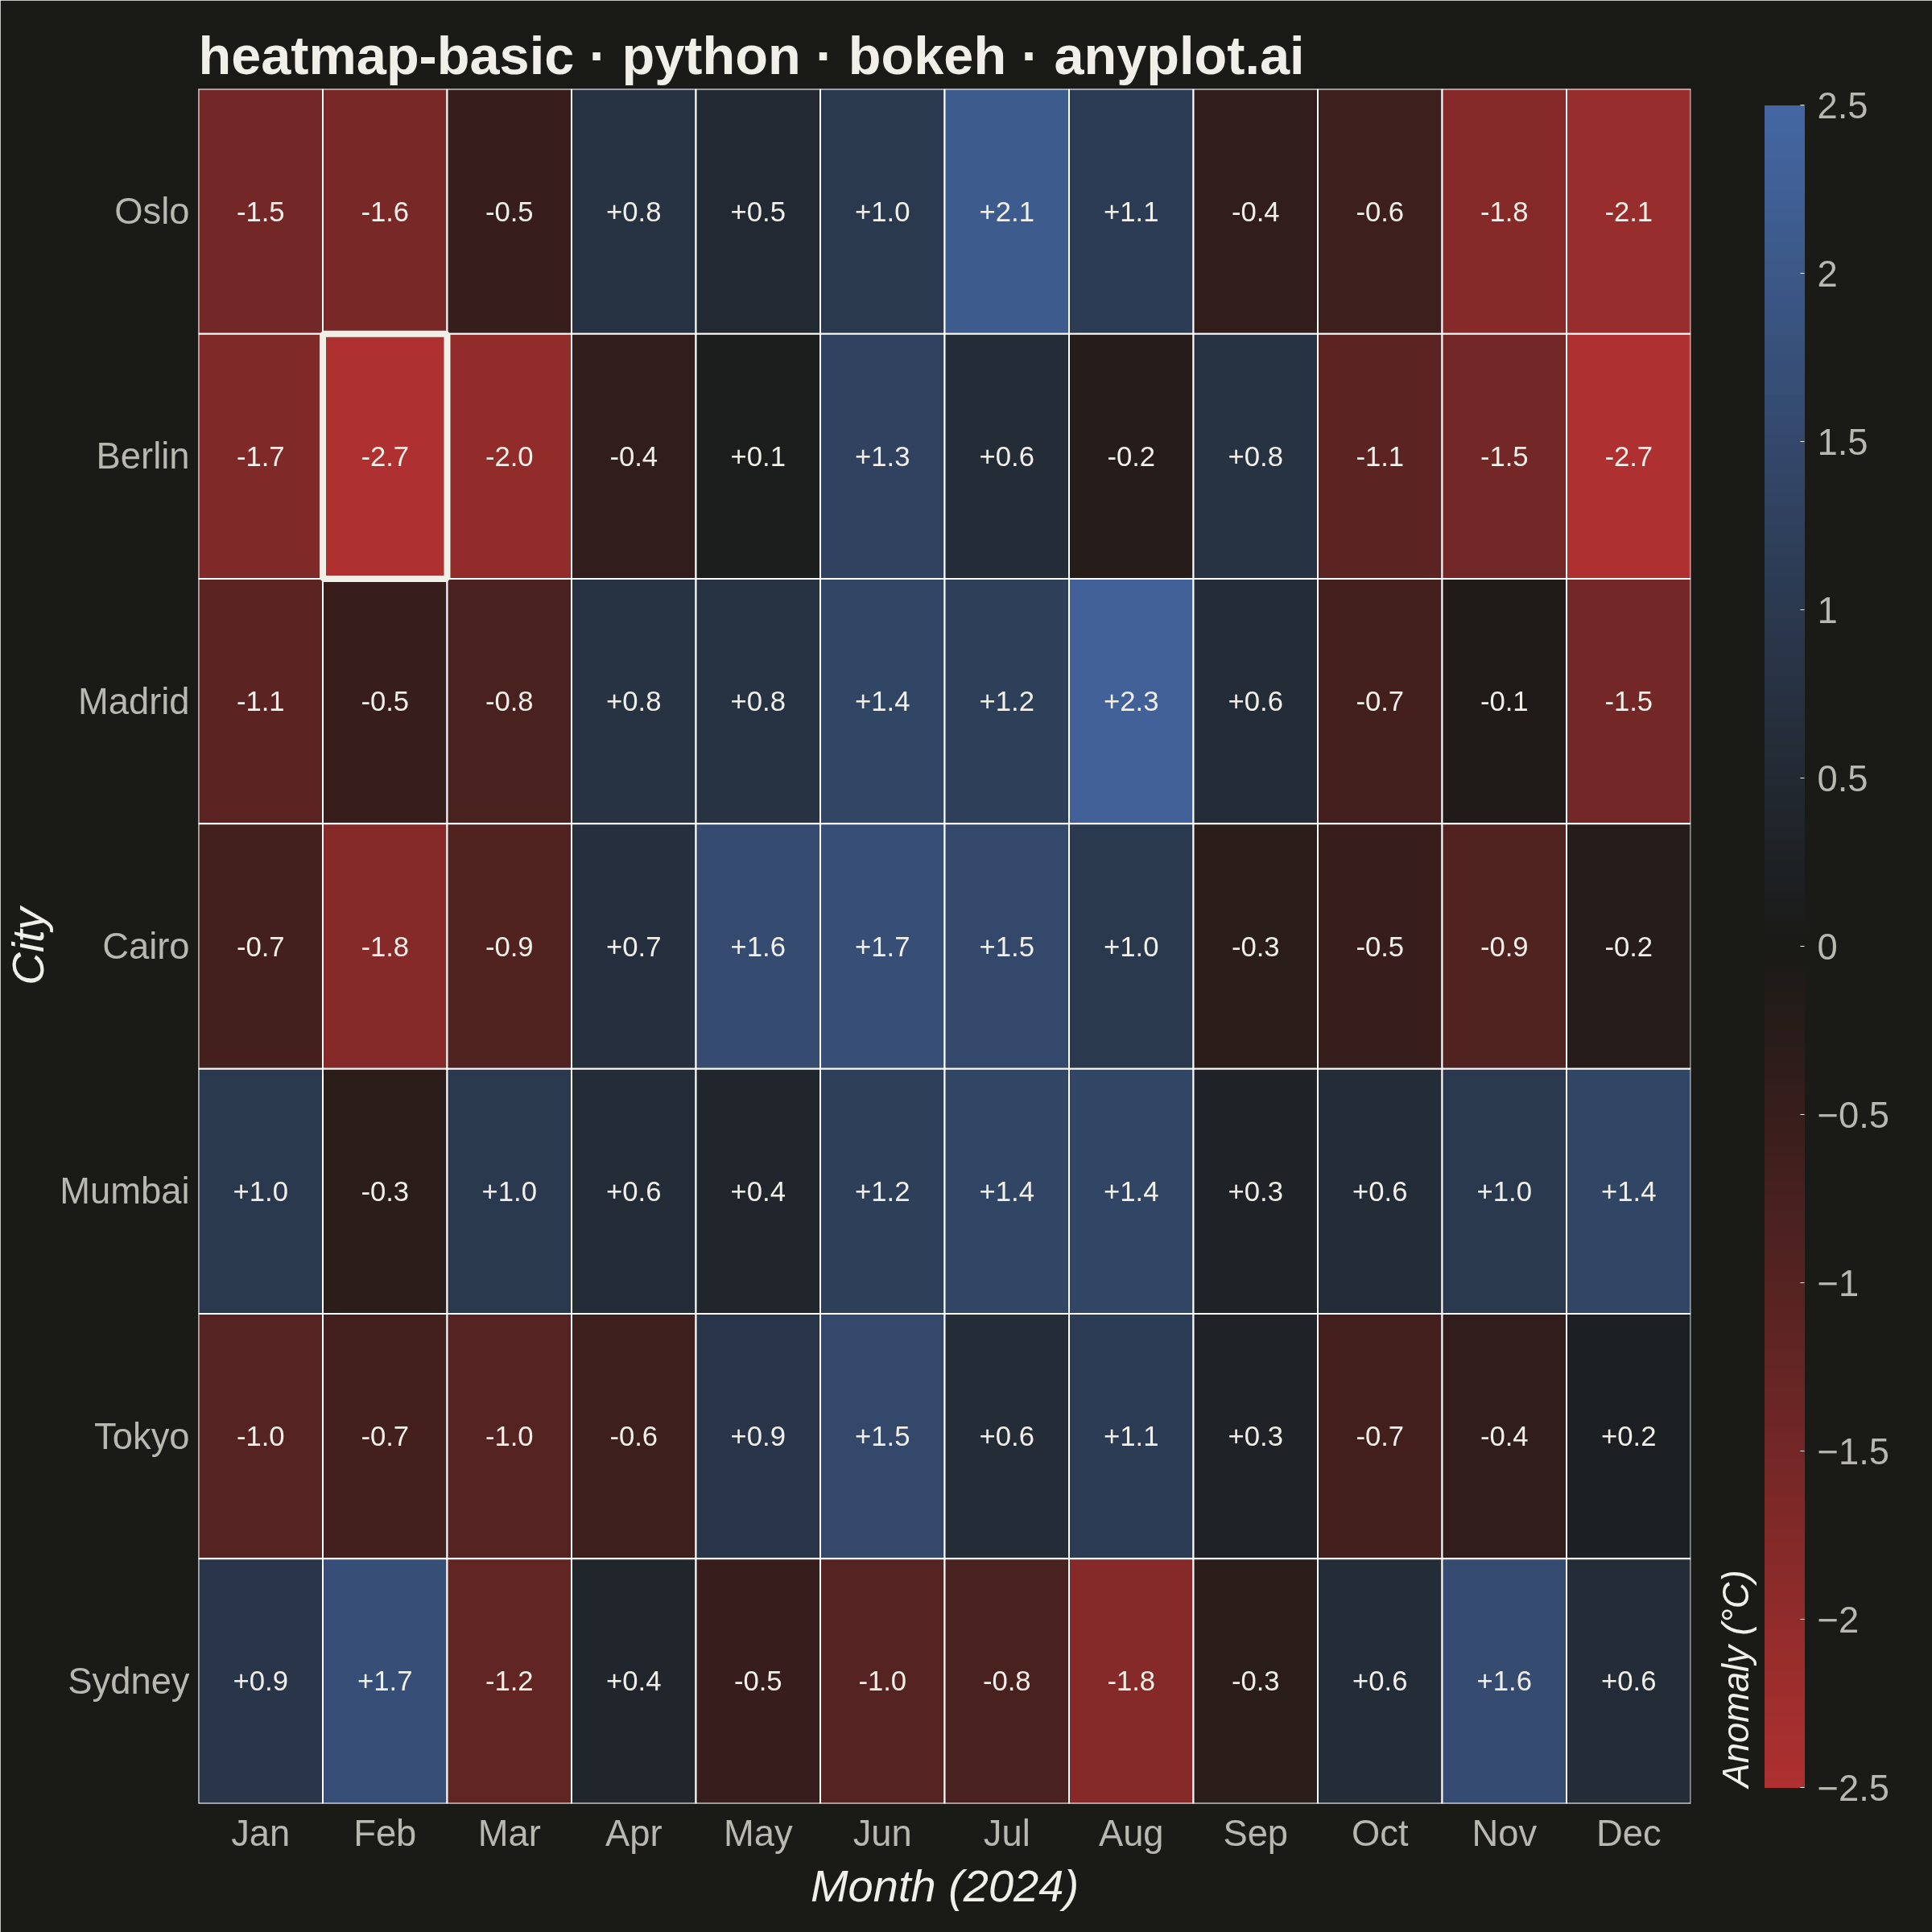
A heatmap displaying values in a matrix format using color intensity. Each cell's color represents the magnitude of the value, making it easy to identify patterns, clusters, and outliers in two-dimensional data. Essential for visualizing correlations, frequencies, and relationships between variables.
""" anyplot.ai
heatmap-basic: Basic Heatmap
Library: bokeh 3.9.0 | Python 3.13.13
Quality: 88/100 | Updated: 2026-05-28
"""

import base64
import io
import os
import sys
import time
from pathlib import Path


# Remove this script's directory from sys.path so "bokeh.py" doesn't shadow the bokeh package
_this_dir = os.path.dirname(os.path.abspath(__file__))
sys.path = [p for p in sys.path if os.path.abspath(p) != _this_dir]

import numpy as np
import pandas as pd
from bokeh.io import output_file, save
from bokeh.models import BasicTicker, ColumnDataSource, HoverTool, LabelSet
from bokeh.plotting import figure
from bokeh.transform import linear_cmap
from PIL import Image
from selenium import webdriver
from selenium.webdriver.chrome.options import Options


# Theme tokens
THEME = os.getenv("ANYPLOT_THEME", "light")
PAGE_BG = "#FAF8F1" if THEME == "light" else "#1A1A17"
ELEVATED_BG = "#FFFDF6" if THEME == "light" else "#242420"
INK = "#1A1A17" if THEME == "light" else "#F0EFE8"
INK_SOFT = "#4A4A44" if THEME == "light" else "#B8B7B0"


# Imprint diverging colormap — 256-stop ramp, theme-adaptive midpoint (red → neutral → blue)
def _lerp_hex(c0, c1, t):
    r0, g0, b0 = (int(c0[i : i + 2], 16) for i in (1, 3, 5))
    r1, g1, b1 = (int(c1[i : i + 2], 16) for i in (1, 3, 5))
    r, g, b = (int(round(a + (b - a) * t)) for a, b in ((r0, r1), (g0, g1), (b0, b1)))
    return f"#{r:02X}{g:02X}{b:02X}"


_mid = "#FAF8F1" if THEME == "light" else "#1A1A17"
IMPRINT_DIV256 = [_lerp_hex("#AE3030", _mid, t / 127.0) for t in range(128)] + [
    _lerp_hex(_mid, "#4467A3", t / 127.0) for t in range(128)
]

# Data — monthly temperature anomalies (°C) for 7 cities across all 12 months
np.random.seed(42)
months = ["Jan", "Feb", "Mar", "Apr", "May", "Jun", "Jul", "Aug", "Sep", "Oct", "Nov", "Dec"]
cities = ["Oslo", "Berlin", "Madrid", "Cairo", "Mumbai", "Tokyo", "Sydney"]

base_anomalies = np.random.randn(len(cities), len(months)) * 0.6
for i, city in enumerate(cities):
    seasonal = np.sin(np.linspace(-np.pi / 2, 3 * np.pi / 2, len(months)))
    if city in ("Oslo", "Berlin"):
        base_anomalies[i] += seasonal * 1.5 - 0.3
    elif city in ("Madrid", "Cairo"):
        base_anomalies[i] += seasonal * 1.2 + 0.4
    elif city == "Mumbai":
        base_anomalies[i] += 0.8
    elif city == "Sydney":
        base_anomalies[i] -= seasonal * 0.9
    elif city == "Tokyo":
        base_anomalies[i] += seasonal * 0.7

values = np.round(base_anomalies, 1)

records = []
for i, city in enumerate(cities):
    for j, month in enumerate(months):
        val = values[i, j]
        # Light theme: dark text on near-zero (cream) cells, light text on deep red/blue cells
        tc = ("#F0EFE8" if abs(val) > 1.0 else "#1A1A17") if THEME == "light" else "#F0EFE8"
        records.append({"month": month, "city": city, "anomaly": val, "label": f"{val:+.1f}", "text_color": tc})

source = ColumnDataSource(pd.DataFrame(records))

# Color mapping — Imprint diverging palette
cmap = linear_cmap("anomaly", IMPRINT_DIV256, low=-2.5, high=2.5)

# Figure — square canvas for symmetric grid
title = "heatmap-basic · python · bokeh · anyplot.ai"
p = figure(
    width=2400,
    height=2400,
    x_range=months,
    y_range=list(reversed(cities)),
    title=title,
    x_axis_label="Month (2024)",
    y_axis_label="City",
    toolbar_location=None,
    tools="",
    min_border_bottom=160,
    min_border_left=180,
    min_border_top=110,
    min_border_right=300,
)

# Heatmap rectangles
r = p.rect(x="month", y="city", width=1, height=1, source=source, fill_color=cmap, line_color="white", line_width=2)

# Cell value annotations
labels = LabelSet(
    x="month",
    y="city",
    text="label",
    text_color="text_color",
    source=source,
    text_align="center",
    text_baseline="middle",
    text_font_size="26pt",
)
p.add_layout(labels)

# Storytelling callout: highlight the most extreme anomaly cell with a bold border + label
extreme_idx = np.unravel_index(np.argmax(np.abs(values)), values.shape)
extreme_city = cities[extreme_idx[0]]
extreme_month = months[extreme_idx[1]]
extreme_val = values[extreme_idx[0], extreme_idx[1]]
p.rect(
    x=[extreme_month], y=[extreme_city], width=1, height=1, fill_color=None, fill_alpha=0, line_color=INK, line_width=8
)

# Color bar (construct from renderer — idiomatic Bokeh)
color_bar = r.construct_color_bar(
    width=50,
    ticker=BasicTicker(desired_num_ticks=10),
    label_standoff=16,
    major_label_text_font_size="34pt",
    major_label_text_color=INK_SOFT,
    border_line_color=None,
    padding=20,
    title="Anomaly (°C)",
    title_text_font_size="34pt",
    title_text_color=INK,
    title_standoff=20,
    background_fill_color=PAGE_BG,
)
p.add_layout(color_bar, "right")

# HoverTool for interactive HTML
hover = HoverTool(tooltips=[("City", "@city"), ("Month", "@month"), ("Anomaly", "@anomaly{+0.0} °C")], renderers=[r])
p.add_tools(hover)

# Theme-adaptive chrome
p.background_fill_color = PAGE_BG
p.border_fill_color = PAGE_BG
p.outline_line_color = None

p.title.text_font_size = "50pt"
p.title.text_color = INK

p.xaxis.axis_label_text_font_size = "42pt"
p.yaxis.axis_label_text_font_size = "42pt"
p.xaxis.axis_label_text_color = INK
p.yaxis.axis_label_text_color = INK

p.xaxis.major_label_text_font_size = "34pt"
p.yaxis.major_label_text_font_size = "34pt"
p.xaxis.major_label_text_color = INK_SOFT
p.yaxis.major_label_text_color = INK_SOFT

p.xaxis.axis_line_color = None
p.yaxis.axis_line_color = None
p.xaxis.major_tick_line_color = None
p.yaxis.major_tick_line_color = None
p.xgrid.grid_line_color = None
p.ygrid.grid_line_color = None

# Save interactive HTML
output_file(f"plot-{THEME}.html")
save(p)

# Save PNG via headless Chrome (Selenium — export_png unavailable in this env)
W, H = 2400, 2400
opts = Options()
for arg in (
    "--headless=new",
    "--no-sandbox",
    "--disable-dev-shm-usage",
    "--disable-gpu",
    f"--window-size={W},{H}",
    "--hide-scrollbars",
):
    opts.add_argument(arg)
driver = webdriver.Chrome(options=opts)
driver.set_window_size(W, H)
driver.get(f"file://{Path(f'plot-{THEME}.html').resolve()}")
time.sleep(3)
screenshot = driver.execute_cdp_cmd("Page.captureScreenshot", {"format": "png", "captureBeyondViewport": True})
driver.quit()
Image.open(io.BytesIO(base64.b64decode(screenshot["data"]))).crop((0, 0, W, H)).save(f"plot-{THEME}.png")
Runnable source as JSON, for any HTTP client: https://api.anyplot.ai/specs/heatmap-basic/bokeh/code. Any spec id and library id listed in llms-full.txt fit the same URL shape; every URL below is complete and callable.
{
  "spec_id": "heatmap-basic",
  "language": "python",
  "library": "bokeh",
  "page": "https://anyplot.ai/heatmap-basic/python/bokeh",
  "hub": "https://anyplot.ai/heatmap-basic",
  "code_json": "https://api.anyplot.ai/specs/heatmap-basic/bokeh/code",
  "spec_json": "https://api.anyplot.ai/specs/heatmap-basic",
  "render_light_png": "https://storage.googleapis.com/anyplot-images/plots/heatmap-basic/python/bokeh/plot-light.png",
  "render_dark_png": "https://storage.googleapis.com/anyplot-images/plots/heatmap-basic/python/bokeh/plot-dark.png",
  "interactive_light_html": "https://storage.googleapis.com/anyplot-images/plots/heatmap-basic/python/bokeh/plot-light.html",
  "interactive_dark_html": "https://storage.googleapis.com/anyplot-images/plots/heatmap-basic/python/bokeh/plot-dark.html",
  "quality_score": 88.0,
  "license": "MIT",
  "guide": "https://anyplot.ai/llms.txt"
}
Part of Basic Heatmap on anyplot.ai.