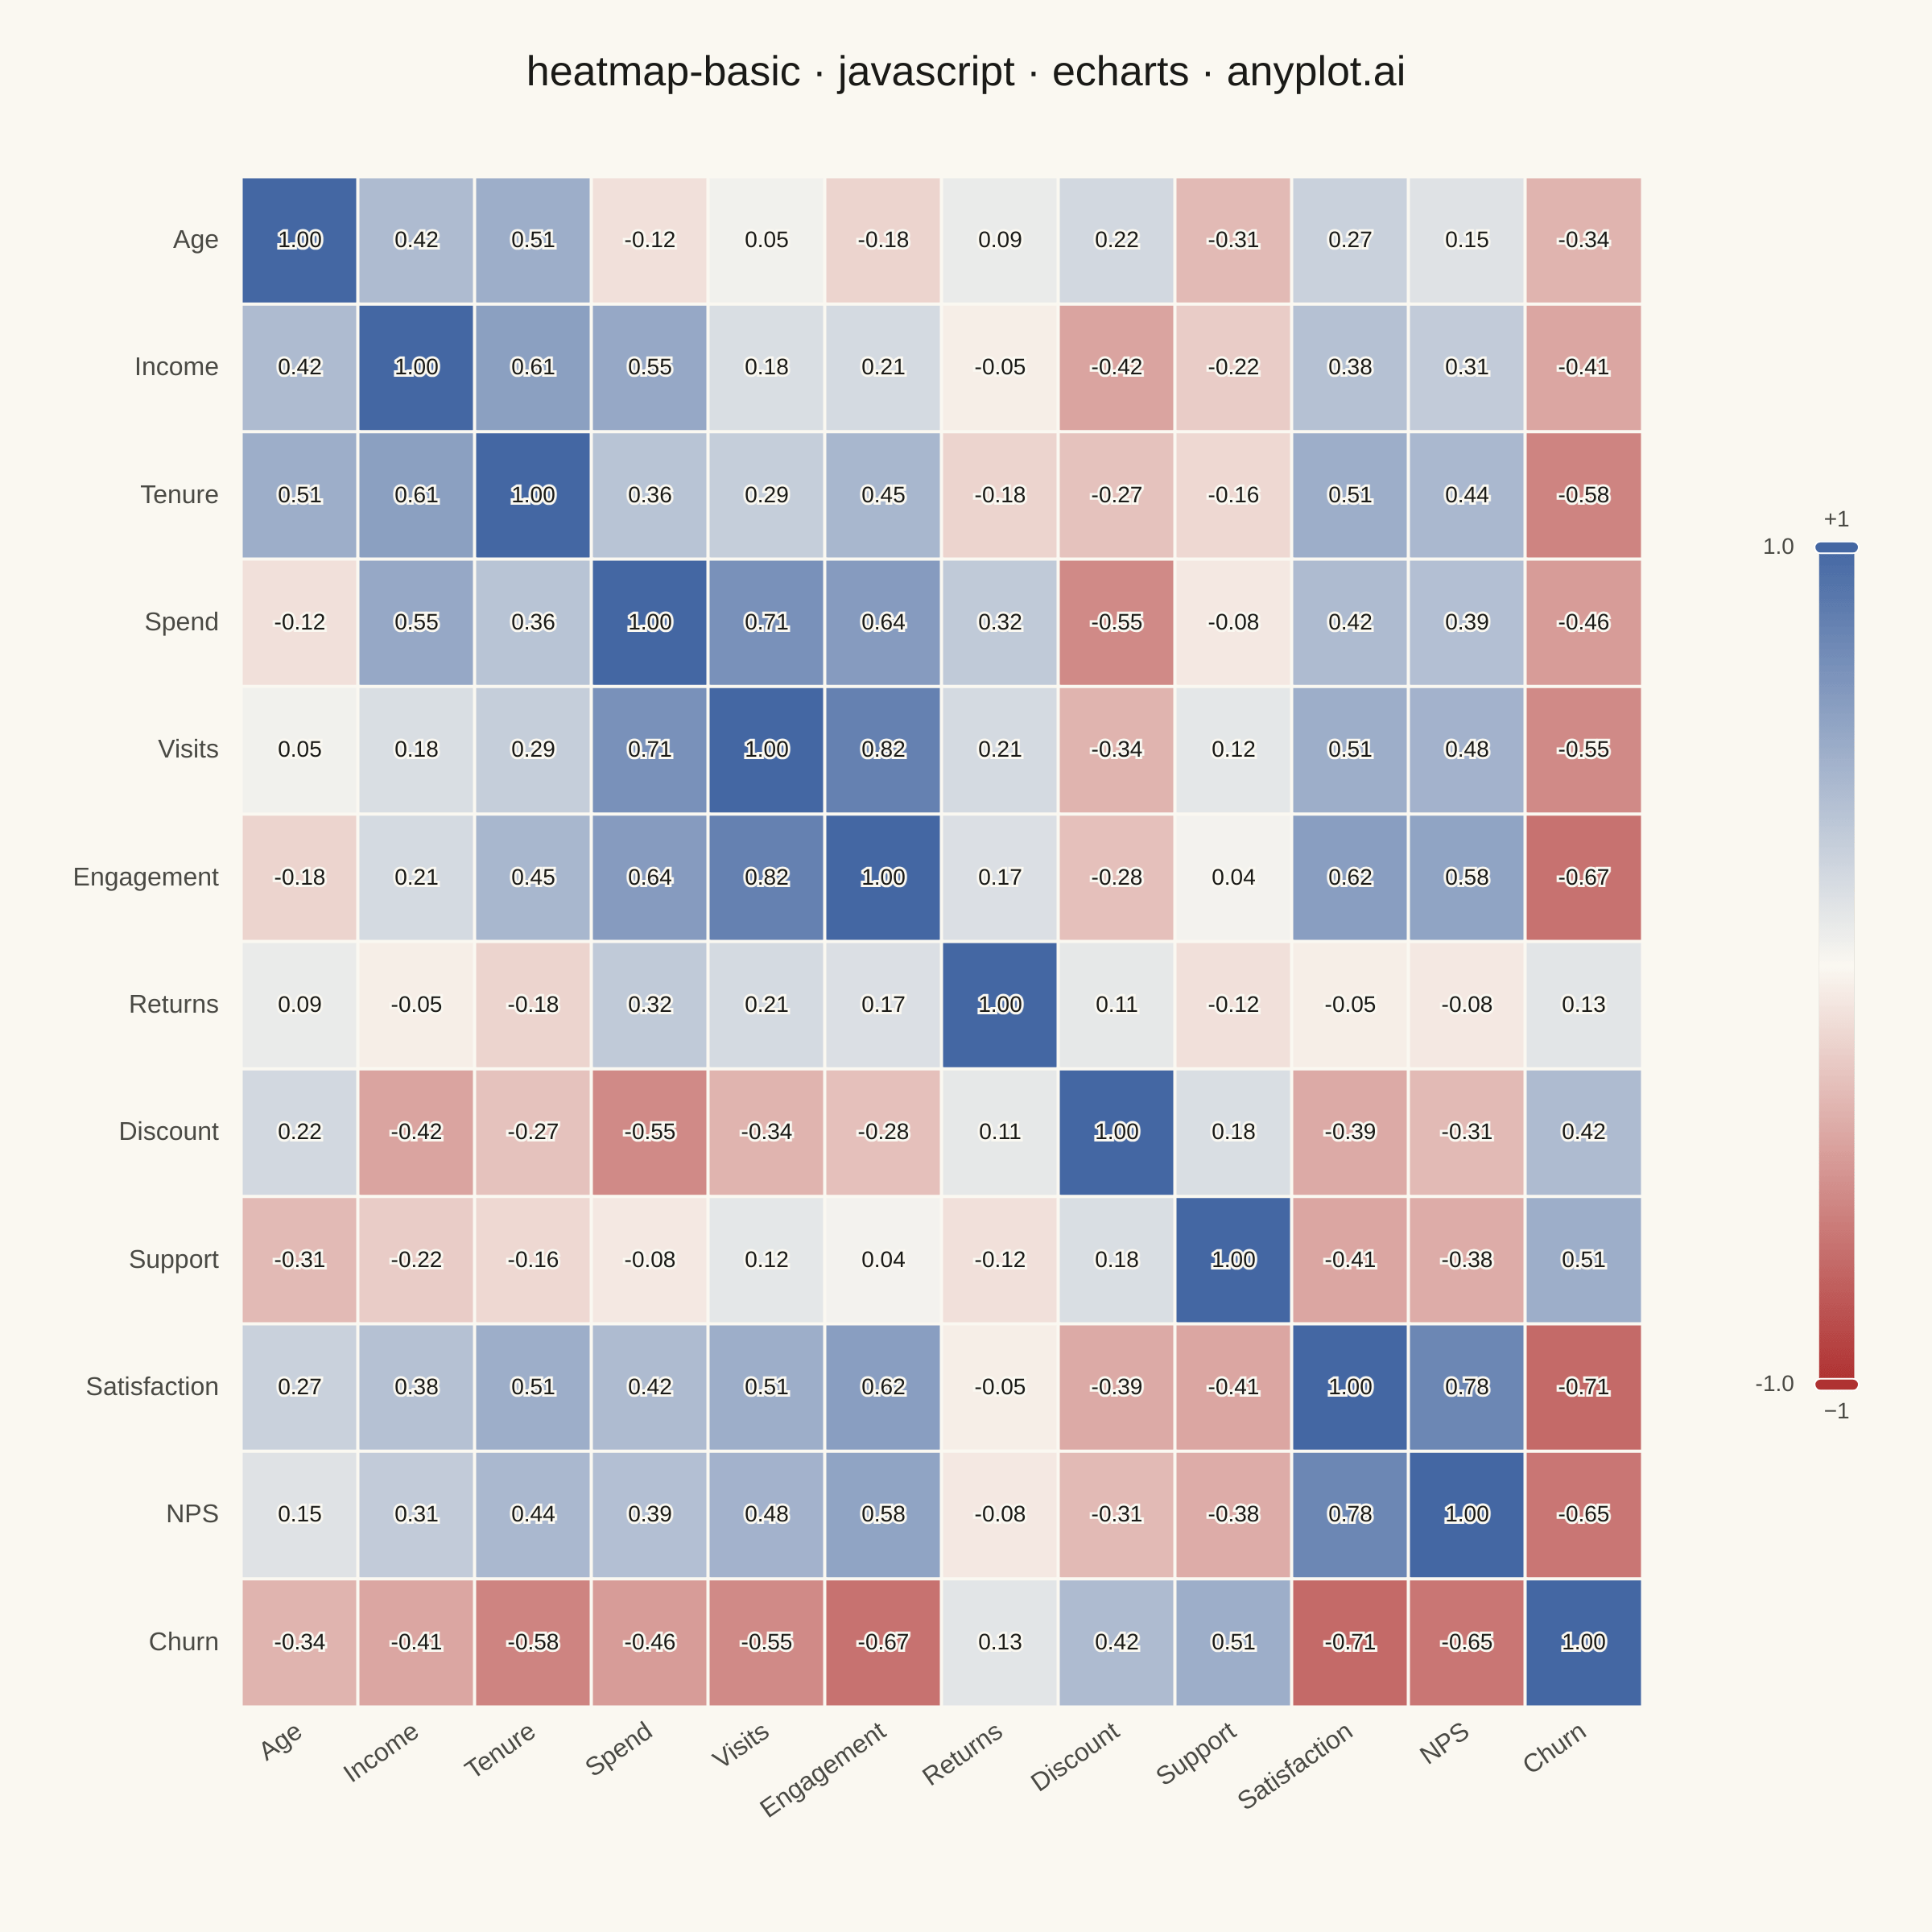
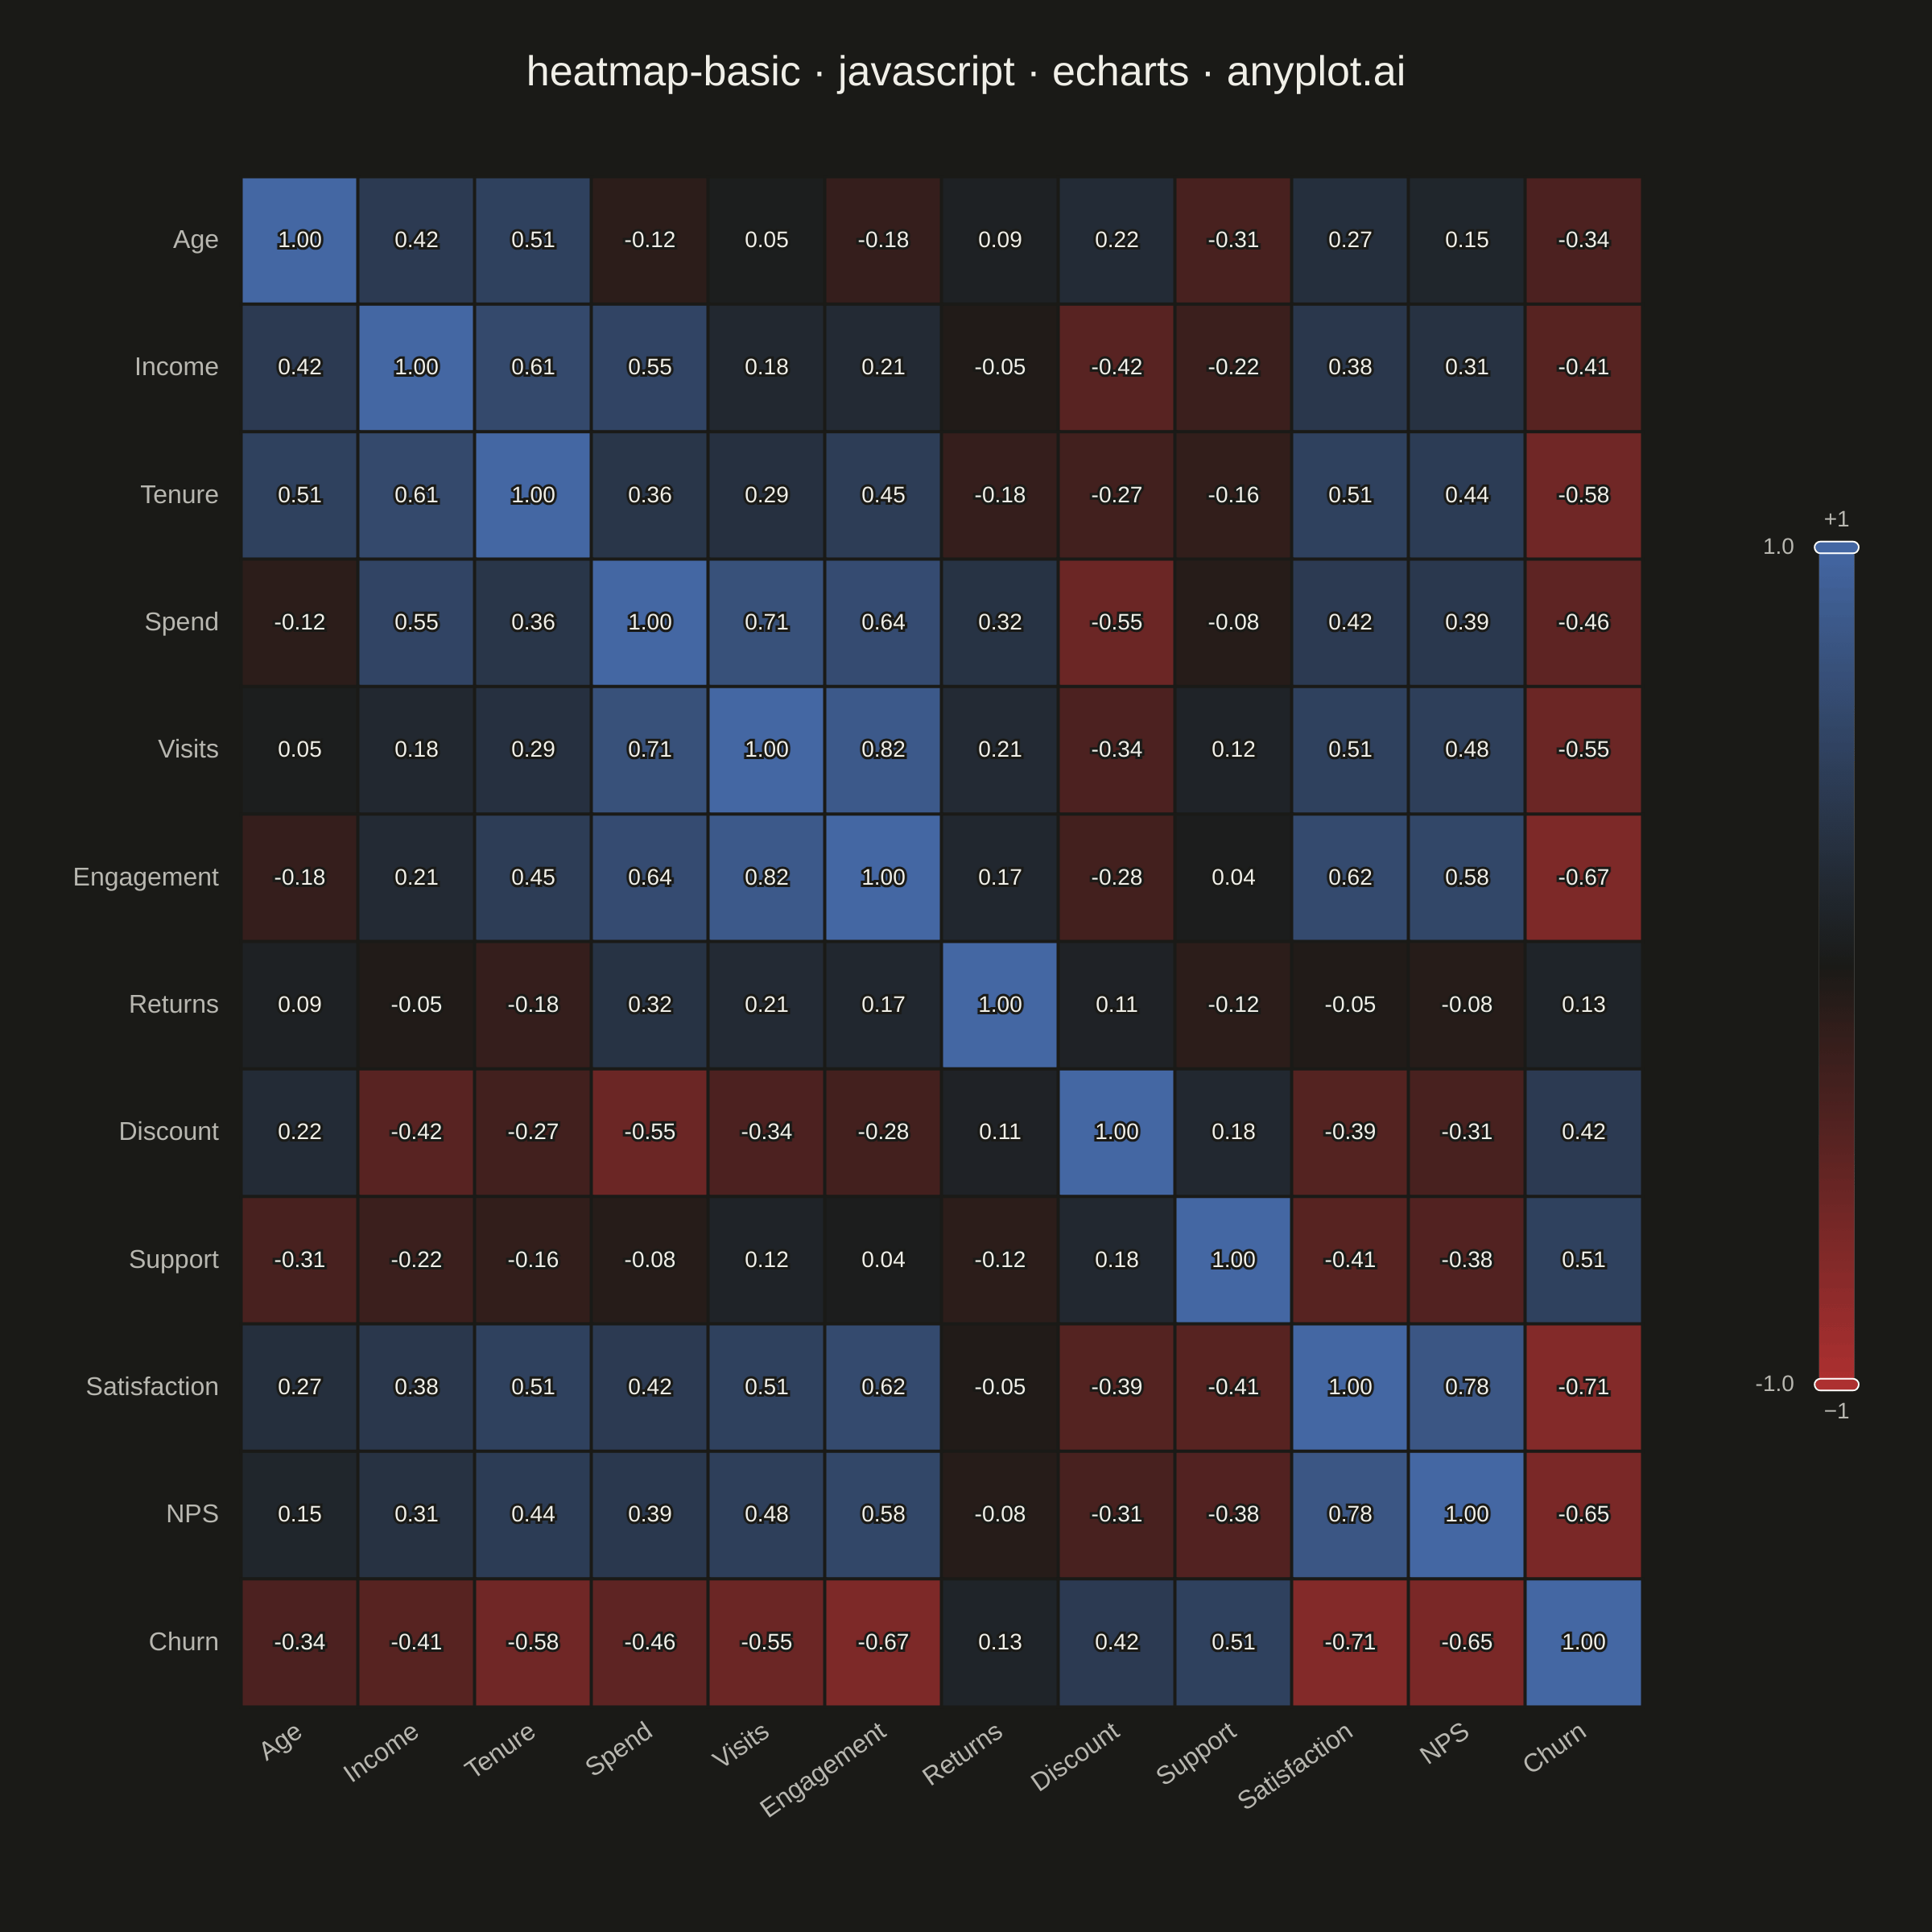
The same plot in 14 other libraries — JavaScript: Chart.js, D3.js, Highcharts, MUI X Charts; Python: Altair, Bokeh, lets-plot, Matplotlib, Plotly, plotnine, Pygal, Seaborn; R: ggplot2; Julia: Makie.jl. Compare all 15 side by side: Basic Heatmap in Python, R, Julia and JavaScript.
A heatmap displaying values in a matrix format using color intensity. Each cell's color represents the magnitude of the value, making it easy to identify patterns, clusters, and outliers in two-dimensional data. Essential for visualizing correlations, frequencies, and relationships between variables.
// anyplot.ai
// heatmap-basic: Basic Heatmap
// Library: echarts 5.5.1 | JavaScript 22.22.3
// Quality: 90/100 | Created: 2026-06-02
//# anyplot-orientation: square
// anyplot.ai
// heatmap-basic: Basic Heatmap
// Library: echarts 5.5.1 | JavaScript 22
// Quality: pending | Created: 2026-06-02

const t = window.ANYPLOT_TOKENS;

// --- Data: customer-feature correlation matrix (12 features) ---------------
// Features grouped semantically so block structure shows up: demographics,
// engagement, friction, and outcomes. Diagonal = 1.0 by construction.
const features = [
  "Age", "Income", "Tenure",
  "Spend", "Visits", "Engagement",
  "Returns", "Discount", "Support",
  "Satisfaction", "NPS", "Churn",
];

const corr = [
  [ 1.00,  0.42,  0.51, -0.12,  0.05, -0.18,  0.09,  0.22, -0.31,  0.27,  0.15, -0.34],
  [ 0.42,  1.00,  0.61,  0.55,  0.18,  0.21, -0.05, -0.42, -0.22,  0.38,  0.31, -0.41],
  [ 0.51,  0.61,  1.00,  0.36,  0.29,  0.45, -0.18, -0.27, -0.16,  0.51,  0.44, -0.58],
  [-0.12,  0.55,  0.36,  1.00,  0.71,  0.64,  0.32, -0.55, -0.08,  0.42,  0.39, -0.46],
  [ 0.05,  0.18,  0.29,  0.71,  1.00,  0.82,  0.21, -0.34,  0.12,  0.51,  0.48, -0.55],
  [-0.18,  0.21,  0.45,  0.64,  0.82,  1.00,  0.17, -0.28,  0.04,  0.62,  0.58, -0.67],
  [ 0.09, -0.05, -0.18,  0.32,  0.21,  0.17,  1.00,  0.11, -0.12, -0.05, -0.08,  0.13],
  [ 0.22, -0.42, -0.27, -0.55, -0.34, -0.28,  0.11,  1.00,  0.18, -0.39, -0.31,  0.42],
  [-0.31, -0.22, -0.16, -0.08,  0.12,  0.04, -0.12,  0.18,  1.00, -0.41, -0.38,  0.51],
  [ 0.27,  0.38,  0.51,  0.42,  0.51,  0.62, -0.05, -0.39, -0.41,  1.00,  0.78, -0.71],
  [ 0.15,  0.31,  0.44,  0.39,  0.48,  0.58, -0.08, -0.31, -0.38,  0.78,  1.00, -0.65],
  [-0.34, -0.41, -0.58, -0.46, -0.55, -0.67,  0.13,  0.42,  0.51, -0.71, -0.65,  1.00],
];

const data = [];
for (let i = 0; i < features.length; i++) {
  for (let j = 0; j < features.length; j++) {
    data.push([j, i, corr[i][j]]);
  }
}

// --- Init -------------------------------------------------------------------
const chart = echarts.init(document.getElementById("container"));

// --- Option -----------------------------------------------------------------
// Imprint diverging colormap (matte-red → theme midpoint → blue) for signed data.
chart.setOption({
  animation: false,
  color: t.palette,
  backgroundColor: "transparent",
  title: {
    text: "heatmap-basic · javascript · echarts · anyplot.ai",
    left: "center",
    top: 28,
    textStyle: { color: t.ink, fontSize: 26, fontWeight: "normal" },
  },
  grid: { left: 150, right: 180, top: 110, bottom: 140, containLabel: false },
  xAxis: {
    type: "category",
    data: features,
    axisLabel: { color: t.inkSoft, fontSize: 16, rotate: 35, margin: 14 },
    axisLine: { lineStyle: { color: t.inkSoft } },
    axisTick: { show: false },
    splitArea: { show: false },
    splitLine: { show: false },
  },
  yAxis: {
    type: "category",
    data: features,
    inverse: true,
    axisLabel: { color: t.inkSoft, fontSize: 16, margin: 14 },
    axisLine: { lineStyle: { color: t.inkSoft } },
    axisTick: { show: false },
    splitArea: { show: false },
    splitLine: { show: false },
  },
  visualMap: {
    min: -1,
    max: 1,
    precision: 1,
    calculable: true,
    orient: "vertical",
    right: 40,
    top: "center",
    itemHeight: 520,
    itemWidth: 22,
    text: ["+1", "−1"],
    textStyle: { color: t.inkSoft, fontSize: 14 },
    inRange: { color: t.div },
    handleStyle: { color: t.inkSoft },
  },
  series: [{
    name: "Correlation",
    type: "heatmap",
    data: data,
    label: {
      show: true,
      fontSize: 14,
      fontWeight: 500,
      color: t.ink,
      textBorderColor: t.pageBg,
      textBorderWidth: 3,
      formatter: function (p) {
        const v = p.value[2];
        return v.toFixed(2);
      },
    },
    itemStyle: {
      borderColor: t.pageBg,
      borderWidth: 2,
    },
  }],
});

// Signal render-complete so the Playwright harness screenshots a settled frame.
chart.on("finished", function () { window.__anyplotReady = true; });
Runnable source as JSON, for any HTTP client: https://api.anyplot.ai/specs/heatmap-basic/echarts/code. Any spec id and library id listed in llms-full.txt fit the same URL shape; every URL below is complete and callable.
{
  "spec_id": "heatmap-basic",
  "language": "javascript",
  "library": "echarts",
  "page": "https://anyplot.ai/heatmap-basic/javascript/echarts",
  "hub": "https://anyplot.ai/heatmap-basic",
  "code_json": "https://api.anyplot.ai/specs/heatmap-basic/echarts/code",
  "spec_json": "https://api.anyplot.ai/specs/heatmap-basic",
  "render_light_png": "https://storage.googleapis.com/anyplot-images/plots/heatmap-basic/javascript/echarts/plot-light.png",
  "render_dark_png": "https://storage.googleapis.com/anyplot-images/plots/heatmap-basic/javascript/echarts/plot-dark.png",
  "interactive_light_html": "https://storage.googleapis.com/anyplot-images/plots/heatmap-basic/javascript/echarts/plot-light.html",
  "interactive_dark_html": "https://storage.googleapis.com/anyplot-images/plots/heatmap-basic/javascript/echarts/plot-dark.html",
  "quality_score": 90.0,
  "license": "MIT",
  "guide": "https://anyplot.ai/llms.txt"
}
Part of Basic Heatmap on anyplot.ai.