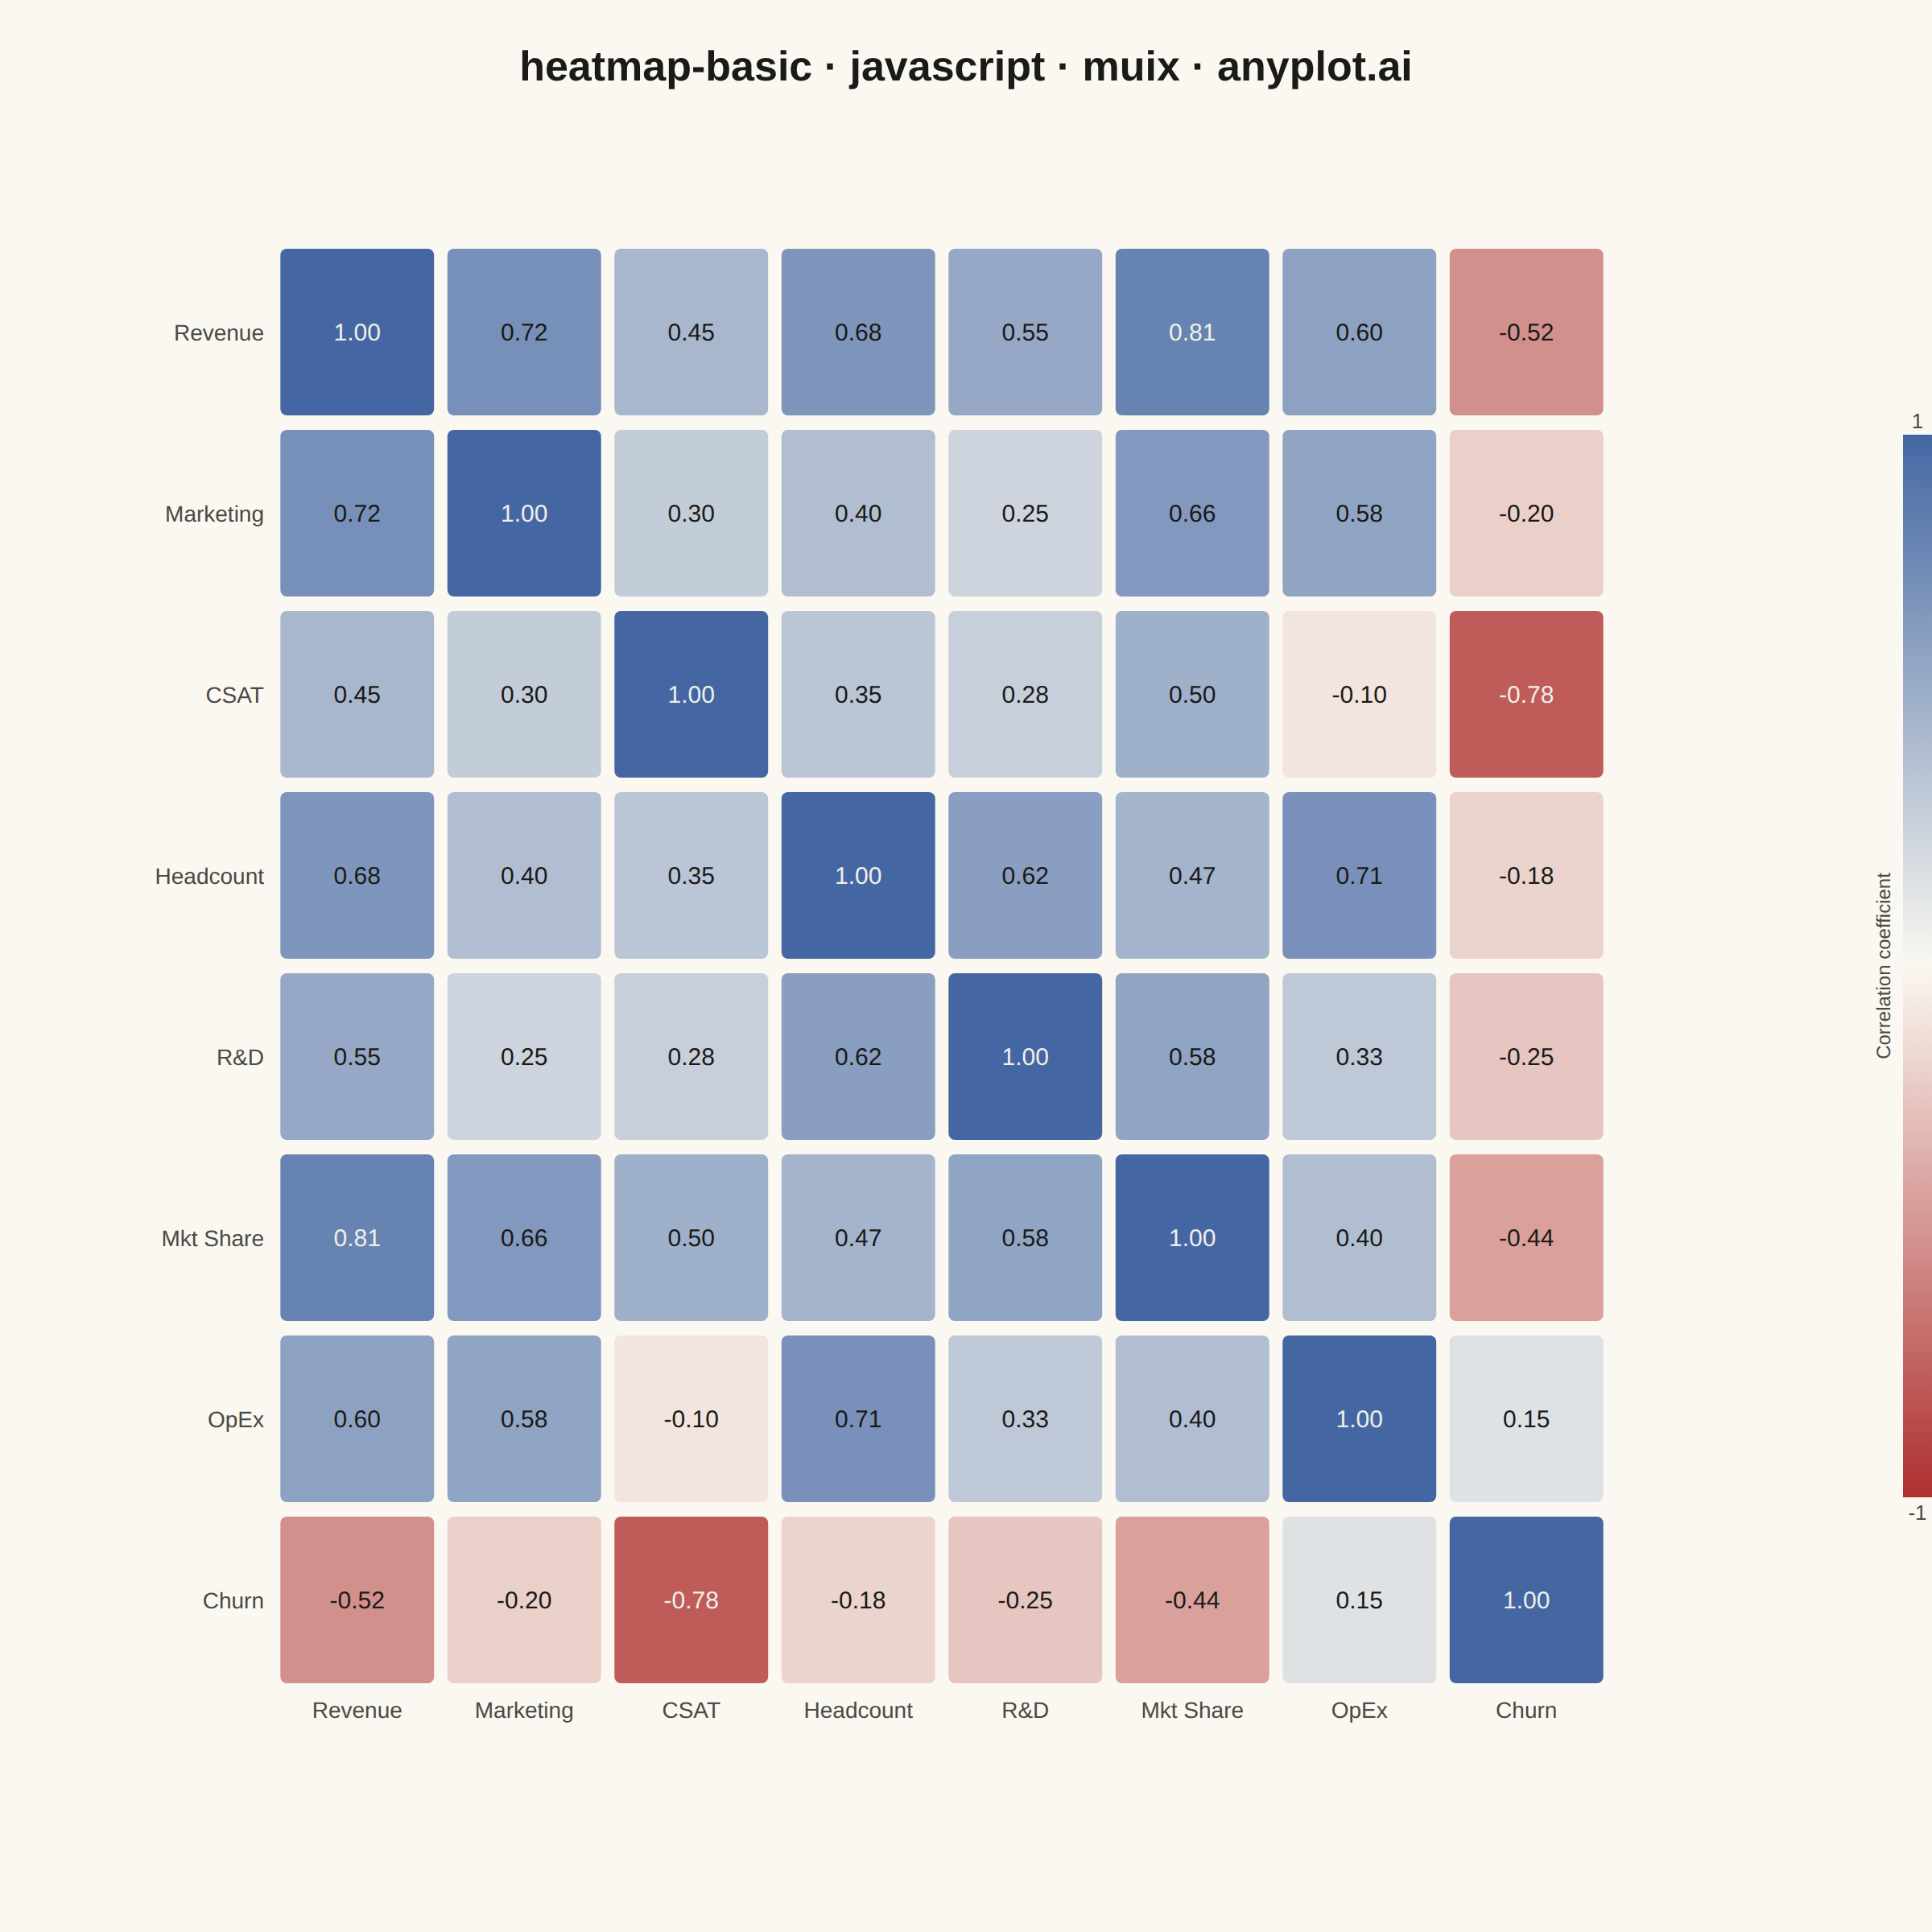
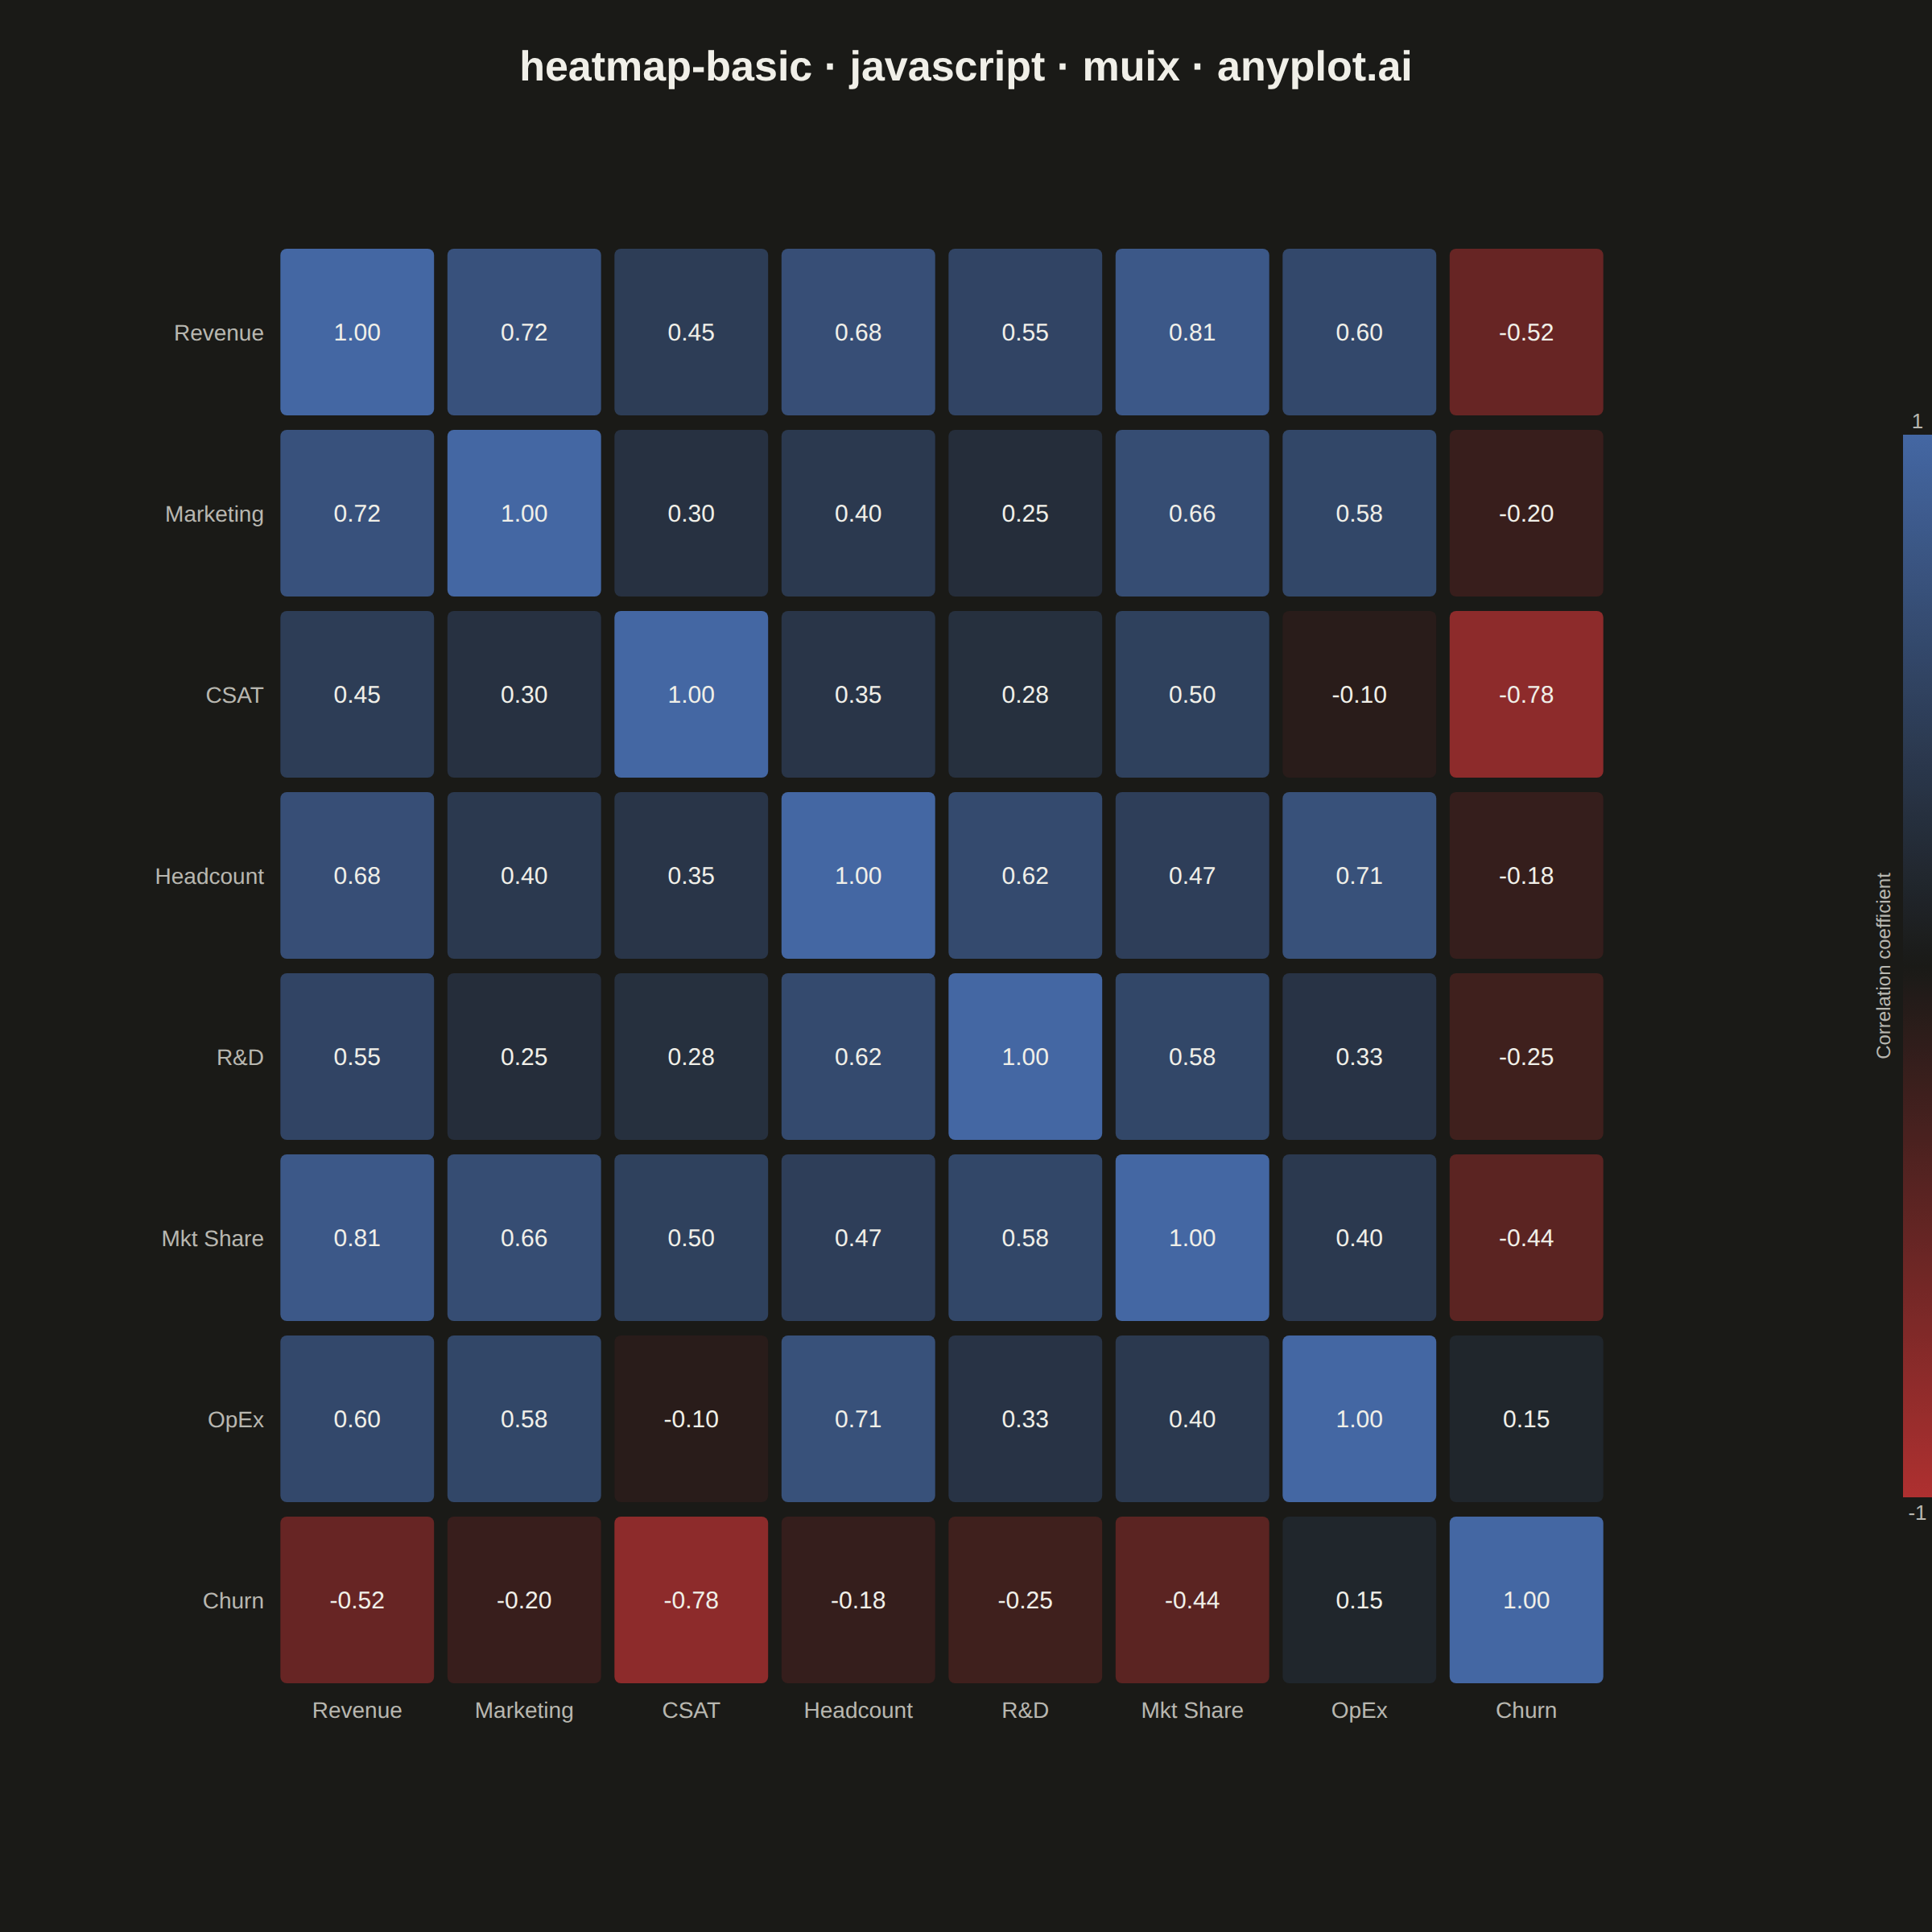
The same plot in 14 other libraries — JavaScript: Chart.js, D3.js, Apache ECharts, Highcharts; Python: Altair, Bokeh, lets-plot, Matplotlib, Plotly, plotnine, Pygal, Seaborn; R: ggplot2; Julia: Makie.jl. Compare all 15 side by side: Basic Heatmap in Python, R, Julia and JavaScript.
A heatmap displaying values in a matrix format using color intensity. Each cell's color represents the magnitude of the value, making it easy to identify patterns, clusters, and outliers in two-dimensional data. Essential for visualizing correlations, frequencies, and relationships between variables.
// anyplot.ai
// heatmap-basic: Basic Heatmap
// Library: muix 7.29.1 | JavaScript 22.23.2
// Quality: 93/100 | Created: 2026-08-20
//# anyplot-orientation: square
// anyplot.ai
// heatmap-basic: Basic Heatmap
// Library: MUI X Charts | React | Node 22
// License: @mui/x-charts — MIT (community). Pro/Premium are out of scope.
// Quality: pending | Created: 2026-08-20
import { ChartContainer } from "@mui/x-charts/ChartContainer";
import { ChartsXAxis } from "@mui/x-charts/ChartsXAxis";
import { ChartsYAxis } from "@mui/x-charts/ChartsYAxis";
import { ChartsText } from "@mui/x-charts/ChartsText";
import { ContinuousColorLegend } from "@mui/x-charts/ChartsLegend";
import { useXScale, useYScale, useZColorScale } from "@mui/x-charts/hooks";

const t = window.ANYPLOT_TOKENS;
const SIZE = window.ANYPLOT_SIZE;

// --- Data: correlation matrix between business metrics (in-memory, deterministic) ---
const metrics = [
  "Revenue",
  "Marketing",
  "CSAT",
  "Headcount",
  "R&D",
  "Mkt Share",
  "OpEx",
  "Churn",
];

// Upper-triangular correlation coefficients (row i vs. columns i+1..n-1); mirrored below.
const upperTriangle = [
  [0.72, 0.45, 0.68, 0.55, 0.81, 0.6, -0.52],
  [0.3, 0.4, 0.25, 0.66, 0.58, -0.2],
  [0.35, 0.28, 0.5, -0.1, -0.78],
  [0.62, 0.47, 0.71, -0.18],
  [0.58, 0.33, -0.25],
  [0.4, -0.44],
  [0.15],
];

const n = metrics.length;
const cells = [];
for (let row = 0; row < n; row += 1) {
  for (let col = 0; col < n; col += 1) {
    const value =
      row === col
        ? 1
        : upperTriangle[Math.min(row, col)][
            Math.max(row, col) - Math.min(row, col) - 1
          ];
    cells.push({
      id: `${row}-${col}`,
      x: metrics[col],
      y: metrics[row],
      value,
    });
  }
}

// --- Colour: diverging Imprint colormap (imprint_div) driven by the z-axis colorMap ---
function hexToRgb(hex) {
  const int = parseInt(hex.slice(1), 16);
  return [(int >> 16) & 255, (int >> 8) & 255, int & 255];
}

function lerp(a, b, ratio) {
  return Math.round(a + (b - a) * ratio);
}

function imprintDivInterpolator(stops) {
  const [low, mid, high] = stops.map(hexToRgb);
  return (position) => {
    const [start, end, localRatio] =
      position < 0.5
        ? [low, mid, position / 0.5]
        : [mid, high, (position - 0.5) / 0.5];
    const [r, g, b] = [0, 1, 2].map((channel) =>
      lerp(start[channel], end[channel], localRatio),
    );
    return `rgb(${r}, ${g}, ${b})`;
  };
}

// Cell text must stay legible against that cell's own fill luminance regardless
// of the current site theme, so pick between the two fixed Imprint ink literals
// (light-mode ink / dark-mode ink) rather than the theme-dependent `t.ink`.
const CELL_TEXT_ON_LIGHT_FILL = "#1A1A17";
const CELL_TEXT_ON_DARK_FILL = "#F0EFE8";

function textColorFor(fill) {
  const [r, g, b] = fill.match(/[\d.]+/g).map(Number);
  const luminance = 0.2126 * r + 0.7152 * g + 0.0722 * b;
  return luminance > 140 ? CELL_TEXT_ON_LIGHT_FILL : CELL_TEXT_ON_DARK_FILL;
}

// --- Cells (custom composition: MUI X band scales + z-axis colour scale) --------------
function HeatmapCells() {
  const xScale = useXScale();
  const yScale = useYScale();
  const colorScale = useZColorScale();

  return (
    <g>
      {cells.map((cell) => {
        const x = xScale(cell.x) ?? 0;
        const y = yScale(cell.y) ?? 0;
        const width = xScale.bandwidth();
        const height = yScale.bandwidth();
        const fill = colorScale(cell.value);
        return (
          <g key={cell.id}>
            <rect
              x={x}
              y={y}
              width={width}
              height={height}
              fill={fill}
              rx={4}
            />
            <ChartsText
              text={cell.value.toFixed(2)}
              x={x + width / 2}
              y={y + height / 2}
              style={{
                fontSize: 15,
                fill: textColorFor(fill),
                textAnchor: "middle",
                dominantBaseline: "central",
              }}
            />
          </g>
        );
      })}
    </g>
  );
}

// --- Chart (default-exported component — the harness mounts it) ----------------------
const TITLE = "heatmap-basic · javascript · muix · anyplot.ai";
const MARGIN = { top: 150, right: 200, bottom: 150, left: 170 };
const LEGEND_CAPTION_X = SIZE.width - 26;
const LEGEND_CAPTION_Y = SIZE.height / 2;

export default function Chart() {
  return (
    <ChartContainer
      width={SIZE.width}
      height={SIZE.height}
      series={[]}
      margin={MARGIN}
      skipAnimation
      xAxis={[
        {
          scaleType: "band",
          data: metrics,
          categoryGapRatio: 0.08,
          disableLine: true,
          disableTicks: true,
          tickLabelStyle: { fontSize: 14, fill: t.inkSoft },
        },
      ]}
      yAxis={[
        {
          scaleType: "band",
          data: metrics,
          categoryGapRatio: 0.08,
          disableLine: true,
          disableTicks: true,
          tickLabelStyle: { fontSize: 14, fill: t.inkSoft },
        },
      ]}
      zAxis={[
        {
          colorMap: {
            type: "continuous",
            min: -1,
            max: 1,
            color: imprintDivInterpolator(t.div),
          },
        },
      ]}
    >
      <HeatmapCells />
      <ChartsXAxis />
      <ChartsYAxis />
      <ContinuousColorLegend
        position={{ horizontal: "right", vertical: "middle" }}
        direction="column"
        length="55%"
        thickness={18}
        labelStyle={{ fontSize: 13, fill: t.inkSoft }}
      />
      <ChartsText
        text="Correlation coefficient"
        x={LEGEND_CAPTION_X}
        y={LEGEND_CAPTION_Y}
        style={{
          fontSize: 12,
          fill: t.inkSoft,
          textAnchor: "middle",
          angle: -90,
        }}
      />
      <ChartsText
        text={TITLE}
        x={SIZE.width / 2}
        y={50}
        style={{
          fontSize: 26,
          fontWeight: 600,
          fill: t.ink,
          textAnchor: "middle",
        }}
      />
    </ChartContainer>
  );
}
Runnable source as JSON, for any HTTP client: https://api.anyplot.ai/specs/heatmap-basic/muix/code. Any spec id and library id listed in llms-full.txt fit the same URL shape; every URL below is complete and callable.
{
  "spec_id": "heatmap-basic",
  "language": "javascript",
  "library": "muix",
  "page": "https://anyplot.ai/heatmap-basic/javascript/muix",
  "hub": "https://anyplot.ai/heatmap-basic",
  "code_json": "https://api.anyplot.ai/specs/heatmap-basic/muix/code",
  "spec_json": "https://api.anyplot.ai/specs/heatmap-basic",
  "render_light_png": "https://storage.googleapis.com/anyplot-images/plots/heatmap-basic/javascript/muix/plot-light.png",
  "render_dark_png": "https://storage.googleapis.com/anyplot-images/plots/heatmap-basic/javascript/muix/plot-dark.png",
  "interactive_light_html": "https://storage.googleapis.com/anyplot-images/plots/heatmap-basic/javascript/muix/plot-light.html",
  "interactive_dark_html": "https://storage.googleapis.com/anyplot-images/plots/heatmap-basic/javascript/muix/plot-dark.html",
  "quality_score": 93.0,
  "license": "MIT",
  "guide": "https://anyplot.ai/llms.txt"
}
Part of Basic Heatmap on anyplot.ai.