The same plot in 14 other libraries — JavaScript: Chart.js, Apache ECharts, Highcharts, MUI X Charts; Python: Altair, Bokeh, lets-plot, Matplotlib, Plotly, plotnine, Pygal, Seaborn; R: ggplot2; Julia: Makie.jl. Compare all 15 side by side: Basic Heatmap in Python, R, Julia and JavaScript.
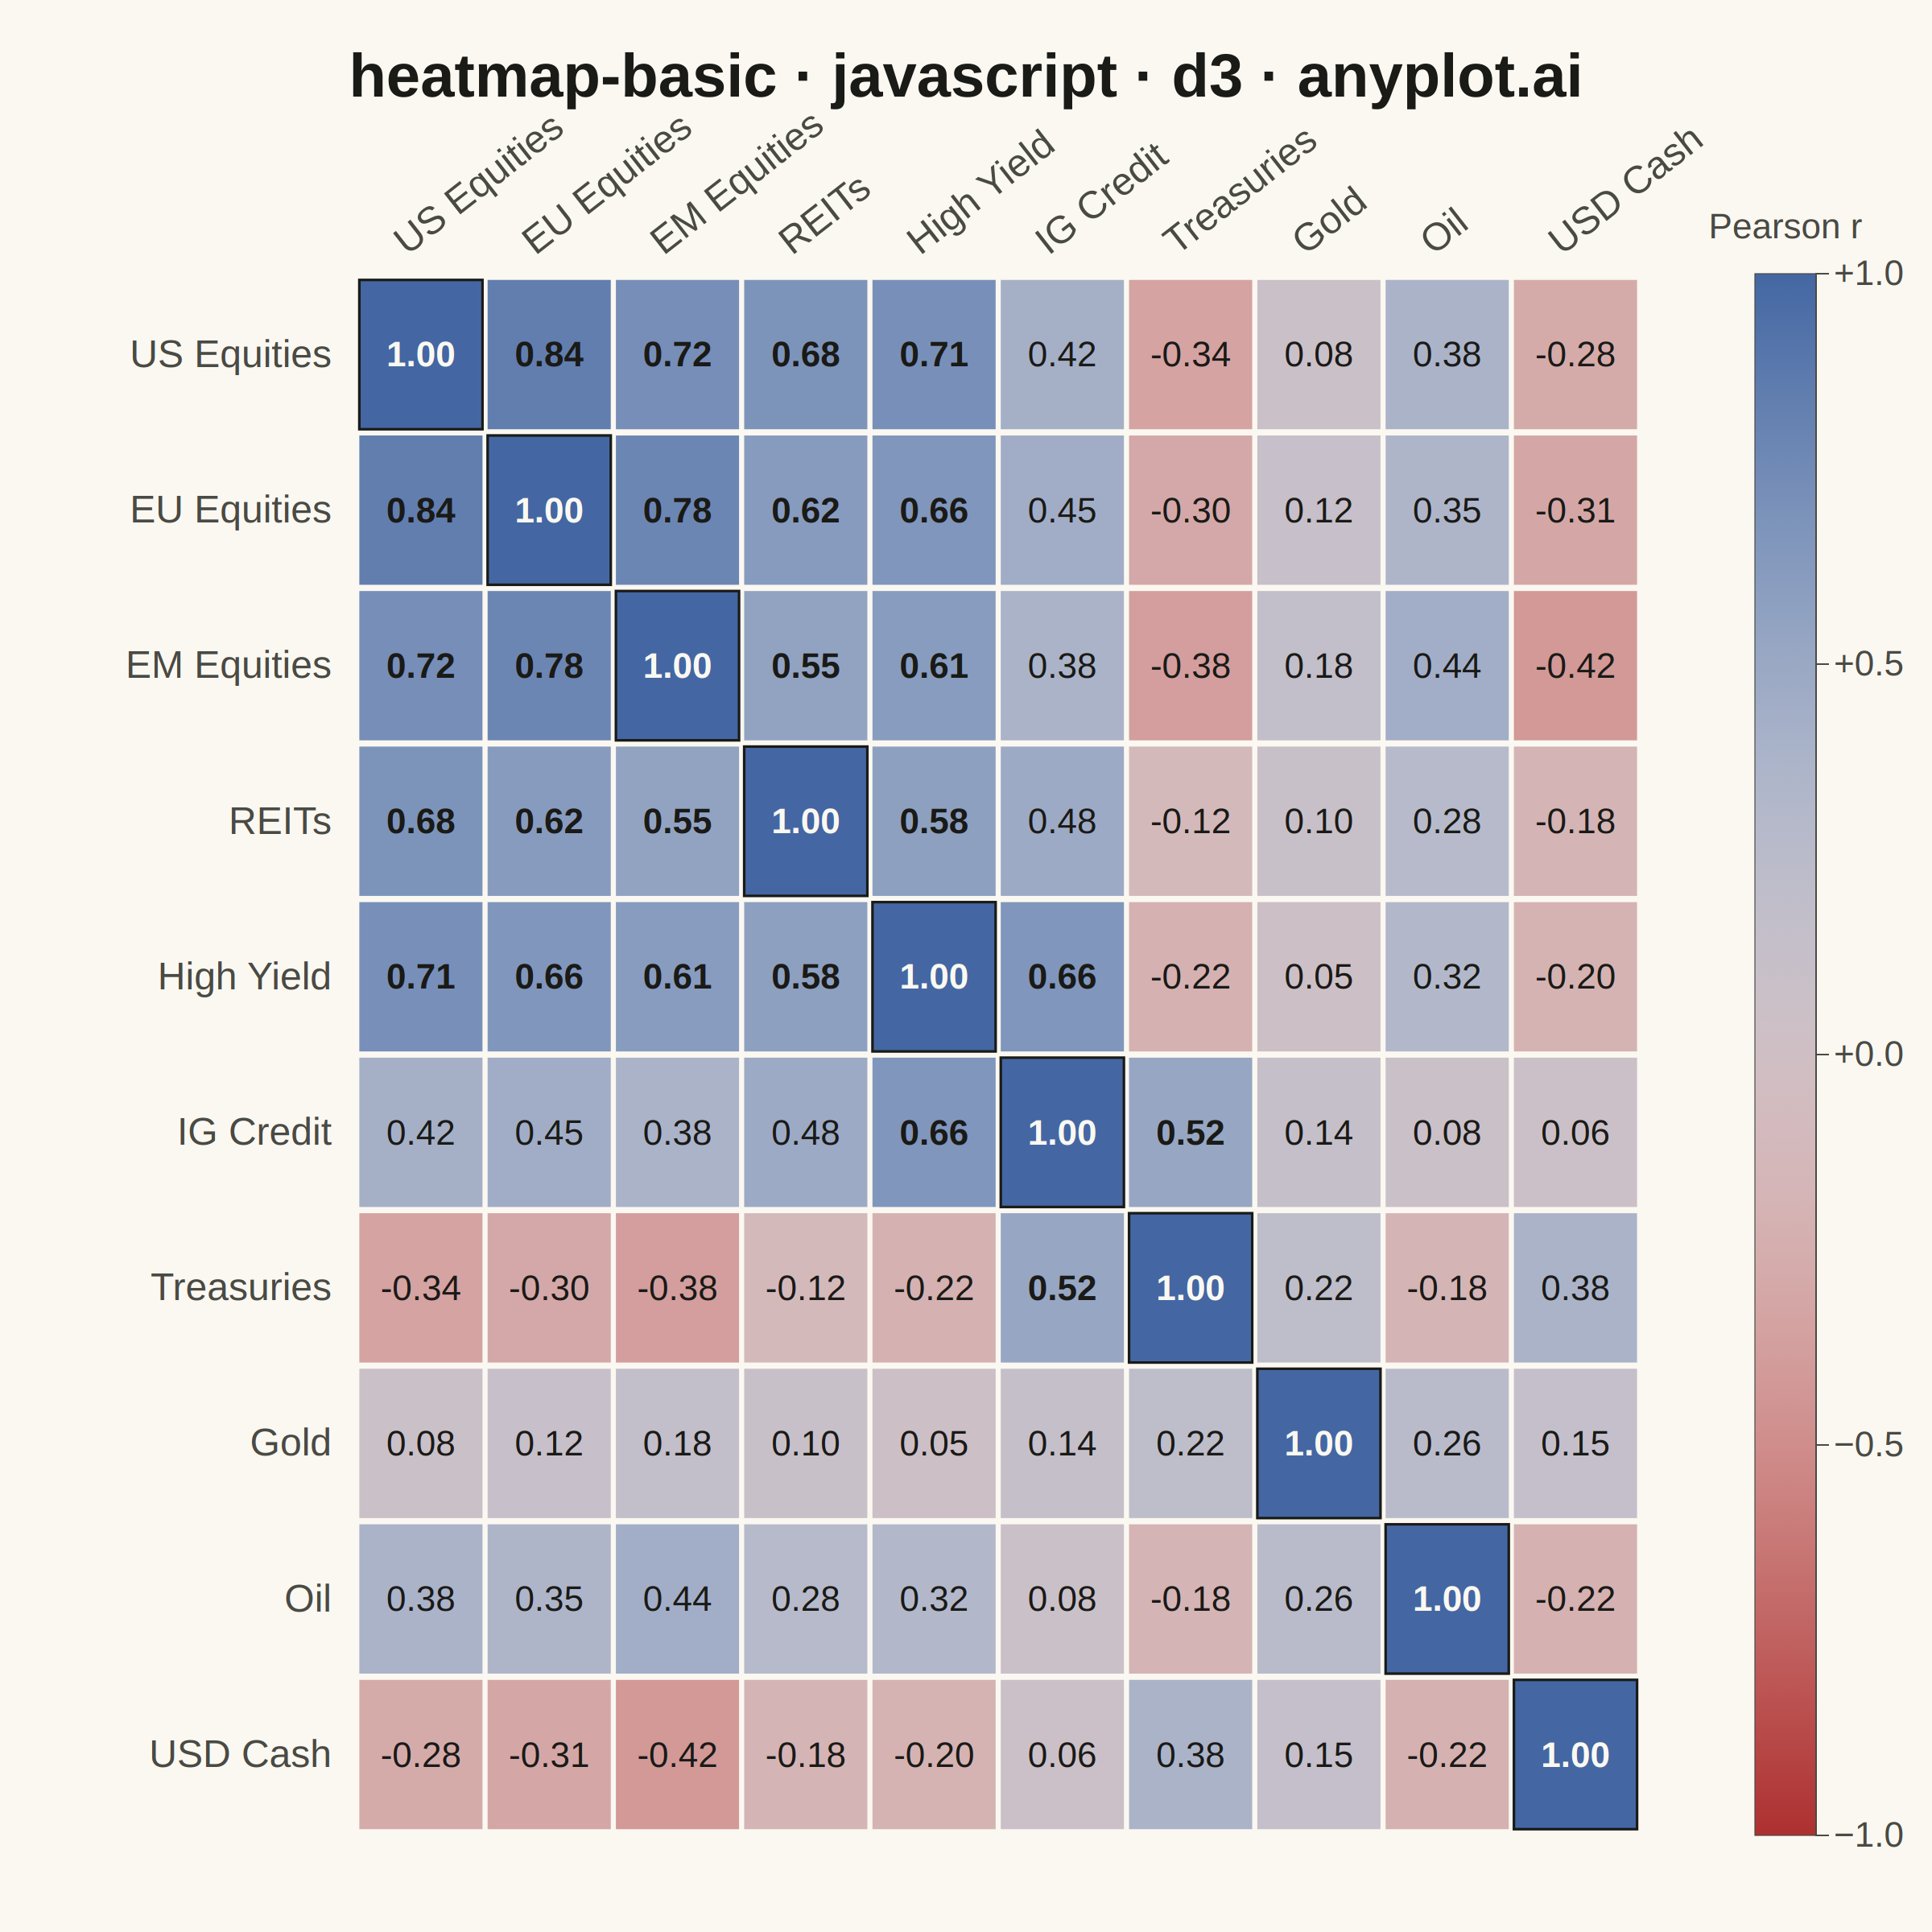
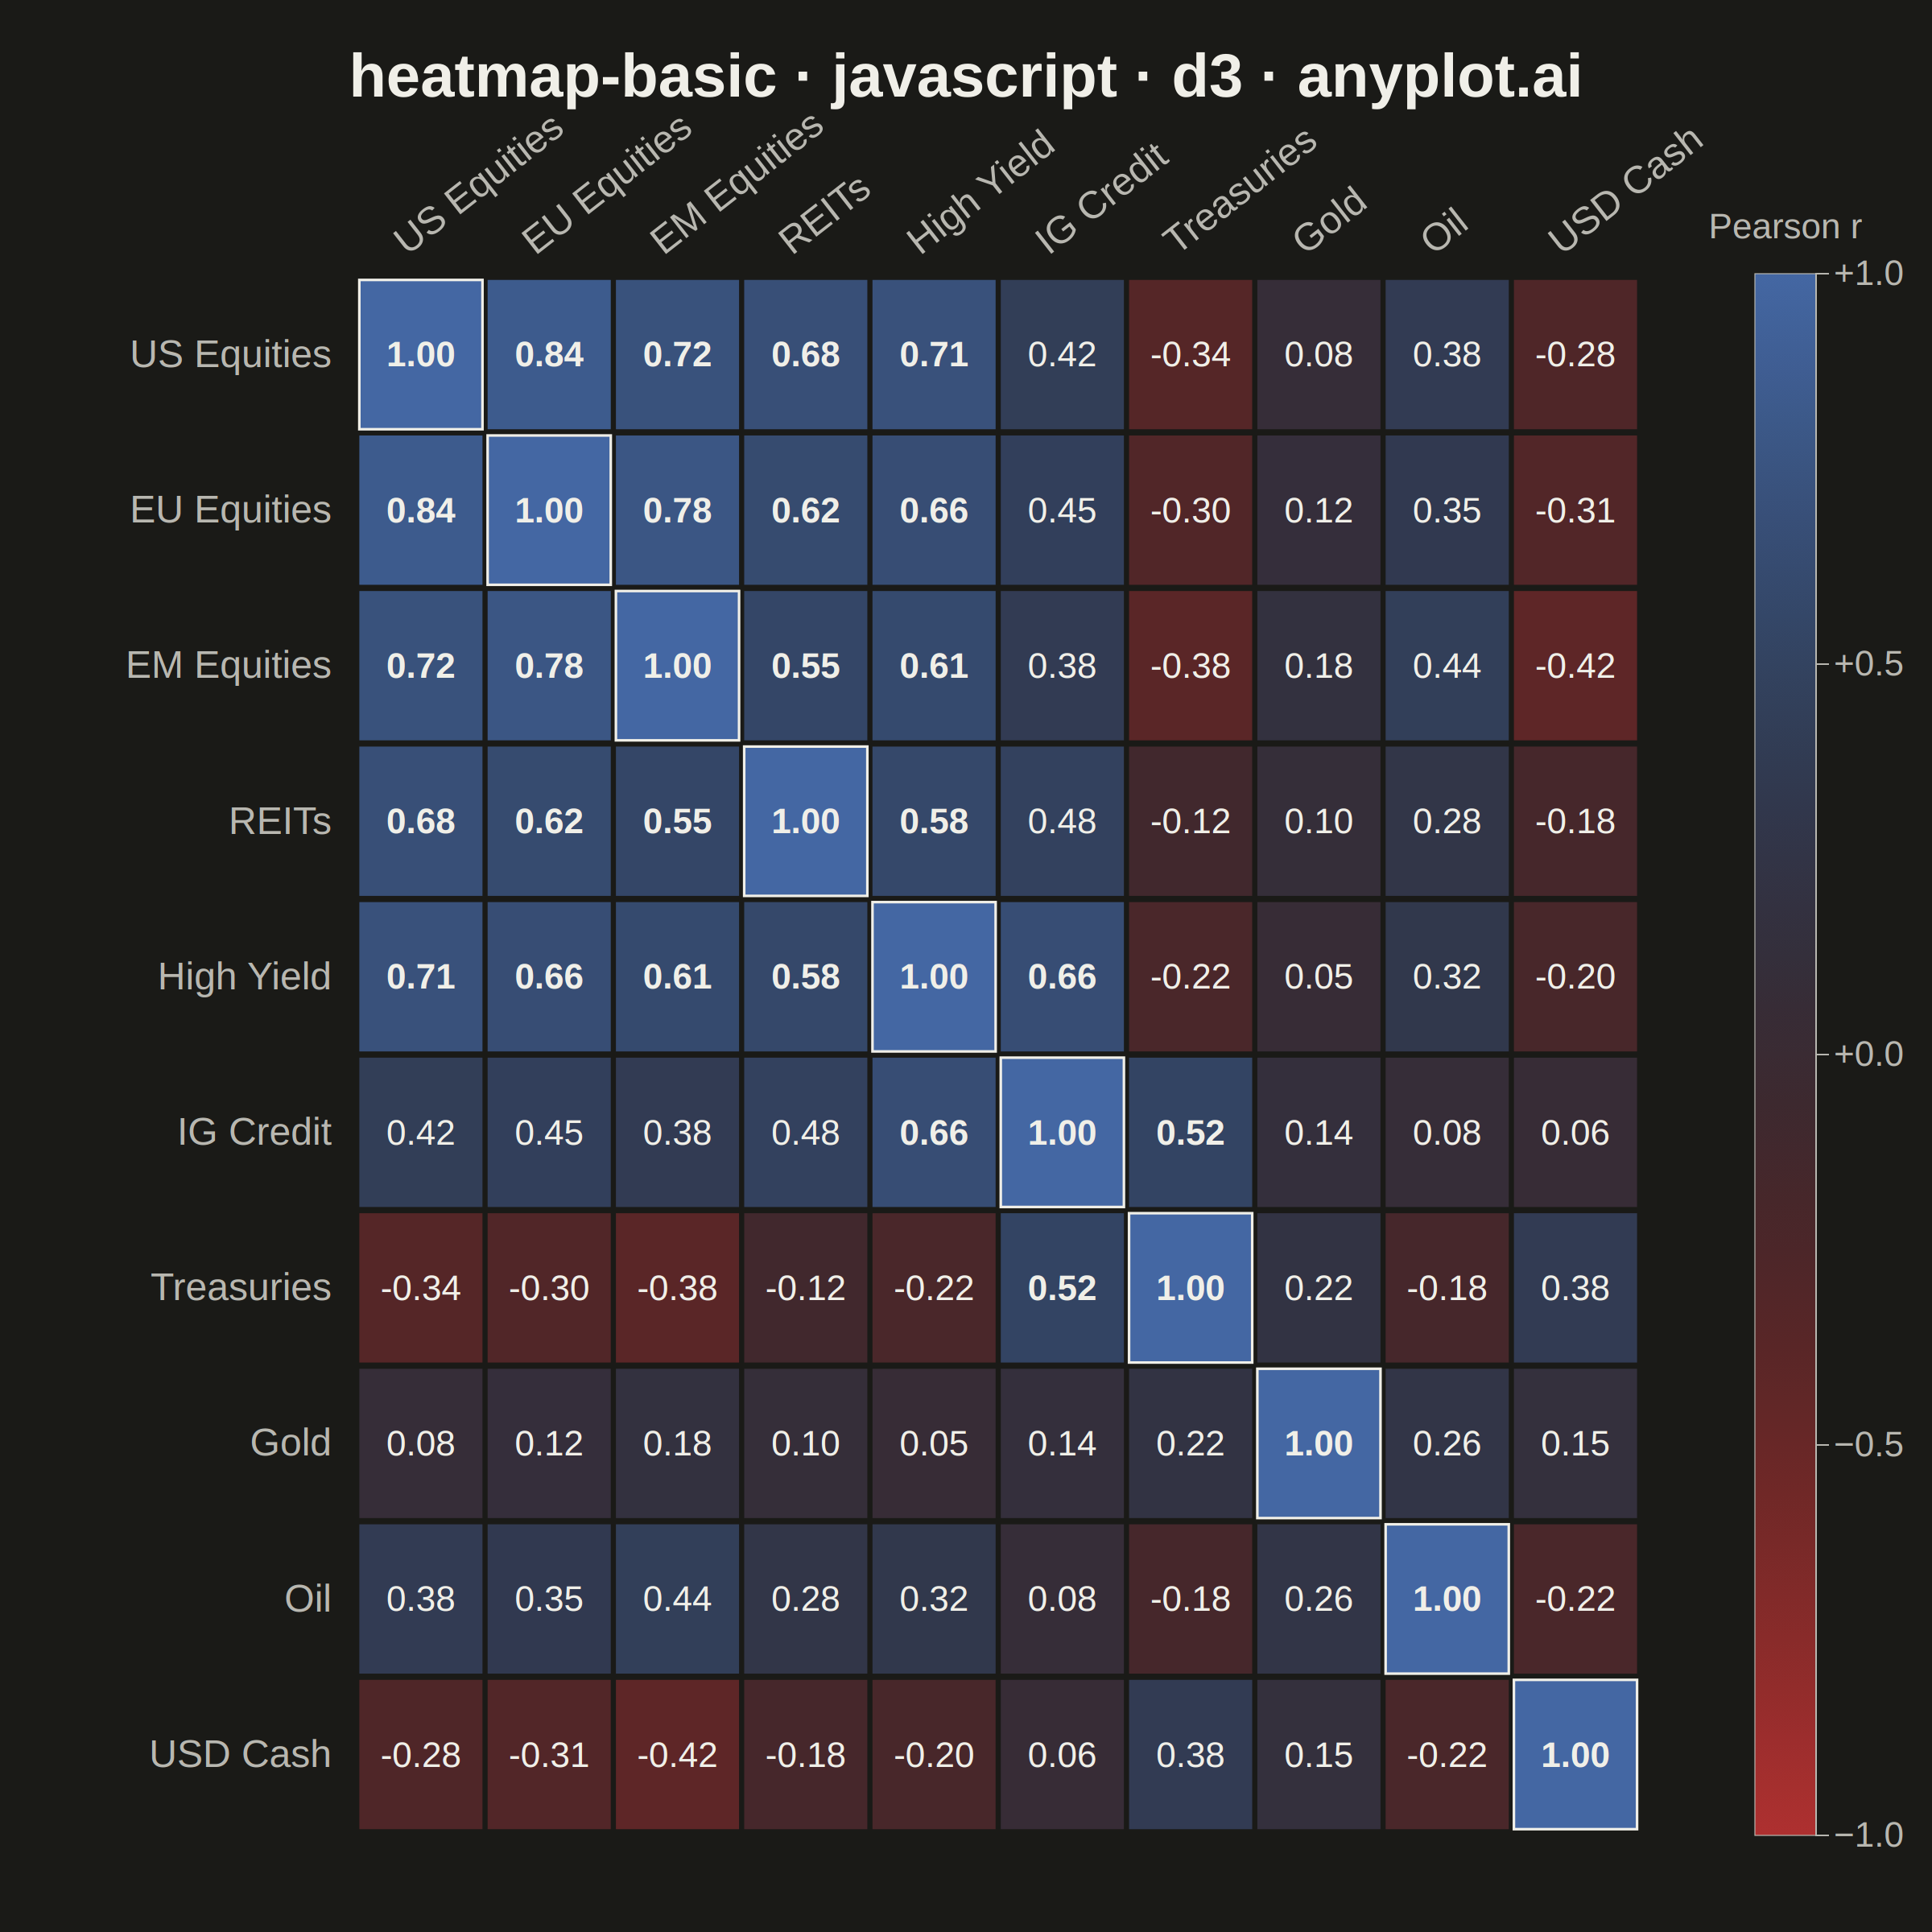
A heatmap displaying values in a matrix format using color intensity. Each cell's color represents the magnitude of the value, making it easy to identify patterns, clusters, and outliers in two-dimensional data. Essential for visualizing correlations, frequencies, and relationships between variables.
// anyplot.ai
// heatmap-basic: Basic Heatmap
// Library: d3 7.9.0 | JavaScript 22.22.3
// Quality: 92/100 | Updated: 2026-06-03
//# anyplot-orientation: square

const t = window.ANYPLOT_TOKENS;
const { width, height } = window.ANYPLOT_SIZE;
const margin = { top: 170, right: 180, bottom: 60, left: 220 };
const iw = width - margin.left - margin.right;
const ih = height - margin.top - margin.bottom;

// Data — asset-class correlation matrix (symmetric, diagonal = 1), the canonical
// diverging-heatmap scenario from the spec's applications. Values are hand-tuned
// to reflect typical post-2020 regime correlations: equities cluster positive,
// long-duration bonds anti-correlate with risk assets, gold sits near-zero.
const assets = [
  "US Equities",
  "EU Equities",
  "EM Equities",
  "REITs",
  "High Yield",
  "IG Credit",
  "Treasuries",
  "Gold",
  "Oil",
  "USD Cash",
];

const corr = [
  [1.00,  0.84,  0.72,  0.68,  0.71,  0.42, -0.34,  0.08,  0.38, -0.28],
  [0.84,  1.00,  0.78,  0.62,  0.66,  0.45, -0.30,  0.12,  0.35, -0.31],
  [0.72,  0.78,  1.00,  0.55,  0.61,  0.38, -0.38,  0.18,  0.44, -0.42],
  [0.68,  0.62,  0.55,  1.00,  0.58,  0.48, -0.12,  0.10,  0.28, -0.18],
  [0.71,  0.66,  0.61,  0.58,  1.00,  0.66, -0.22,  0.05,  0.32, -0.20],
  [0.42,  0.45,  0.38,  0.48,  0.66,  1.00,  0.52,  0.14,  0.08,  0.06],
  [-0.34, -0.30, -0.38, -0.12, -0.22,  0.52,  1.00,  0.22, -0.18,  0.38],
  [0.08,  0.12,  0.18,  0.10,  0.05,  0.14,  0.22,  1.00,  0.26,  0.15],
  [0.38,  0.35,  0.44,  0.28,  0.32,  0.08, -0.18,  0.26,  1.00, -0.22],
  [-0.28, -0.31, -0.42, -0.18, -0.20,  0.06,  0.38,  0.15, -0.22,  1.00],
];

// SVG mount
const svg = d3.select("#container").append("svg")
  .attr("width", width).attr("height", height);
const g = svg.append("g").attr("transform", `translate(${margin.left},${margin.top})`);

// Scales
const x = d3.scaleBand().domain(assets).range([0, iw]).padding(0.04);
const y = d3.scaleBand().domain(assets).range([0, ih]).padding(0.04);

// Imprint diverging colormap — three stops, midpoint already theme-adaptive
const color = d3.scaleSequential(d3.interpolateRgbBasis(t.div)).domain([-1, 1]);

// Cells (flattened)
const cells = [];
for (let i = 0; i < assets.length; i++) {
  for (let j = 0; j < assets.length; j++) {
    cells.push({ row: assets[i], col: assets[j], value: corr[i][j] });
  }
}

// Per-cell text color picked by WCAG contrast ratio against the actual cell
// fill — keeps annotation contrast uniform across light/dark themes. The
// diverging midpoint flips with the theme, so a fixed |r| threshold would
// under-serve saturated cells in one theme or the other.
const relLum = (hex) => {
  const c = d3.color(hex).rgb();
  const f = (v) => {
    const u = v / 255;
    return u <= 0.03928 ? u / 12.92 : Math.pow((u + 0.055) / 1.055, 2.4);
  };
  return 0.2126 * f(c.r) + 0.7152 * f(c.g) + 0.0722 * f(c.b);
};
const contrast = (a, b) => {
  const la = relLum(a);
  const lb = relLum(b);
  return (Math.max(la, lb) + 0.05) / (Math.min(la, lb) + 0.05);
};
const textOn = (fill) =>
  contrast(fill, t.ink) >= contrast(fill, t.pageBg) ? t.ink : t.pageBg;

// Cell rectangles — diagonal gets a soft accent stroke so the eye lands on
// the unit-correlation backbone first (DE-03 storytelling).
g.selectAll("rect.cell").data(cells).join("rect")
  .attr("class", "cell")
  .attr("x", (d) => x(d.col))
  .attr("y", (d) => y(d.row))
  .attr("width", x.bandwidth())
  .attr("height", y.bandwidth())
  .attr("fill", (d) => color(d.value))
  .attr("stroke", (d) => (d.row === d.col ? t.ink : "none"))
  .attr("stroke-width", (d) => (d.row === d.col ? 1.6 : 0));

// Value annotations — weight bumps to 700 on strong correlations so the
// equity cluster and treasury anti-correlation block read as figures, not
// uniform texture.
g.selectAll("text.value").data(cells).join("text")
  .attr("class", "value")
  .attr("x", (d) => x(d.col) + x.bandwidth() / 2)
  .attr("y", (d) => y(d.row) + y.bandwidth() / 2)
  .attr("text-anchor", "middle")
  .attr("dominant-baseline", "central")
  .style("font-size", "22px")
  .style("font-weight", (d) => (Math.abs(d.value) > 0.5 ? 700 : 500))
  .attr("fill", (d) => textOn(color(d.value)))
  .text((d) => d.value.toFixed(2));

// Column labels — rotated above the matrix
const xAxis = g.append("g")
  .attr("transform", "translate(0,0)")
  .call(d3.axisTop(x).tickSize(0).tickPadding(14));
xAxis.select(".domain").remove();
xAxis.selectAll("text")
  .attr("fill", t.inkSoft)
  .style("font-size", "24px")
  .style("font-weight", "500")
  .attr("transform", "rotate(-38)")
  .style("text-anchor", "start");

// Row labels — left of the matrix
const yAxis = g.append("g").call(d3.axisLeft(y).tickSize(0).tickPadding(14));
yAxis.select(".domain").remove();
yAxis.selectAll("text")
  .attr("fill", t.inkSoft)
  .style("font-size", "24px")
  .style("font-weight", "500");

// Title
svg.append("text")
  .attr("x", width / 2).attr("y", 60)
  .attr("text-anchor", "middle")
  .attr("fill", t.ink)
  .style("font-size", "38px")
  .style("font-weight", "600")
  .text("heatmap-basic · javascript · d3 · anyplot.ai");

// Colorbar — vertical gradient strip + axis
const cbWidth = 38;
const cbHeight = ih;
const cbX = iw + 70;

const defs = svg.append("defs");
const grad = defs.append("linearGradient")
  .attr("id", "cbgrad")
  .attr("x1", "0%").attr("y1", "0%")
  .attr("x2", "0%").attr("y2", "100%");
const nStops = 32;
for (let i = 0; i <= nStops; i++) {
  const u = i / nStops;
  grad.append("stop")
    .attr("offset", `${u * 100}%`)
    .attr("stop-color", color(1 - 2 * u));
}

g.append("rect")
  .attr("x", cbX).attr("y", 0)
  .attr("width", cbWidth).attr("height", cbHeight)
  .attr("fill", "url(#cbgrad)")
  .attr("stroke", t.inkSoft)
  .attr("stroke-width", 0.6);

const cbScale = d3.scaleLinear().domain([1, -1]).range([0, cbHeight]);
const cbAxis = g.append("g")
  .attr("transform", `translate(${cbX + cbWidth}, 0)`)
  .call(
    d3.axisRight(cbScale)
      .tickValues([-1, -0.5, 0, 0.5, 1])
      .tickFormat(d3.format("+.1f"))
      .tickSize(8),
  );
cbAxis.selectAll("text").attr("fill", t.inkSoft).style("font-size", "22px");
cbAxis.selectAll("line").attr("stroke", t.inkSoft);
cbAxis.select(".domain").attr("stroke", t.inkSoft);

// Colorbar caption
g.append("text")
  .attr("x", cbX + cbWidth / 2).attr("y", -22)
  .attr("text-anchor", "middle")
  .attr("fill", t.inkSoft)
  .style("font-size", "22px")
  .style("font-weight", "500")
  .text("Pearson r");
Runnable source as JSON, for any HTTP client: https://api.anyplot.ai/specs/heatmap-basic/d3/code. Any spec id and library id listed in llms-full.txt fit the same URL shape; every URL below is complete and callable.
{
  "spec_id": "heatmap-basic",
  "language": "javascript",
  "library": "d3",
  "page": "https://anyplot.ai/heatmap-basic/javascript/d3",
  "hub": "https://anyplot.ai/heatmap-basic",
  "code_json": "https://api.anyplot.ai/specs/heatmap-basic/d3/code",
  "spec_json": "https://api.anyplot.ai/specs/heatmap-basic",
  "render_light_png": "https://storage.googleapis.com/anyplot-images/plots/heatmap-basic/javascript/d3/plot-light.png",
  "render_dark_png": "https://storage.googleapis.com/anyplot-images/plots/heatmap-basic/javascript/d3/plot-dark.png",
  "interactive_light_html": "https://storage.googleapis.com/anyplot-images/plots/heatmap-basic/javascript/d3/plot-light.html",
  "interactive_dark_html": "https://storage.googleapis.com/anyplot-images/plots/heatmap-basic/javascript/d3/plot-dark.html",
  "quality_score": 92.0,
  "license": "MIT",
  "guide": "https://anyplot.ai/llms.txt"
}
Part of Basic Heatmap on anyplot.ai.