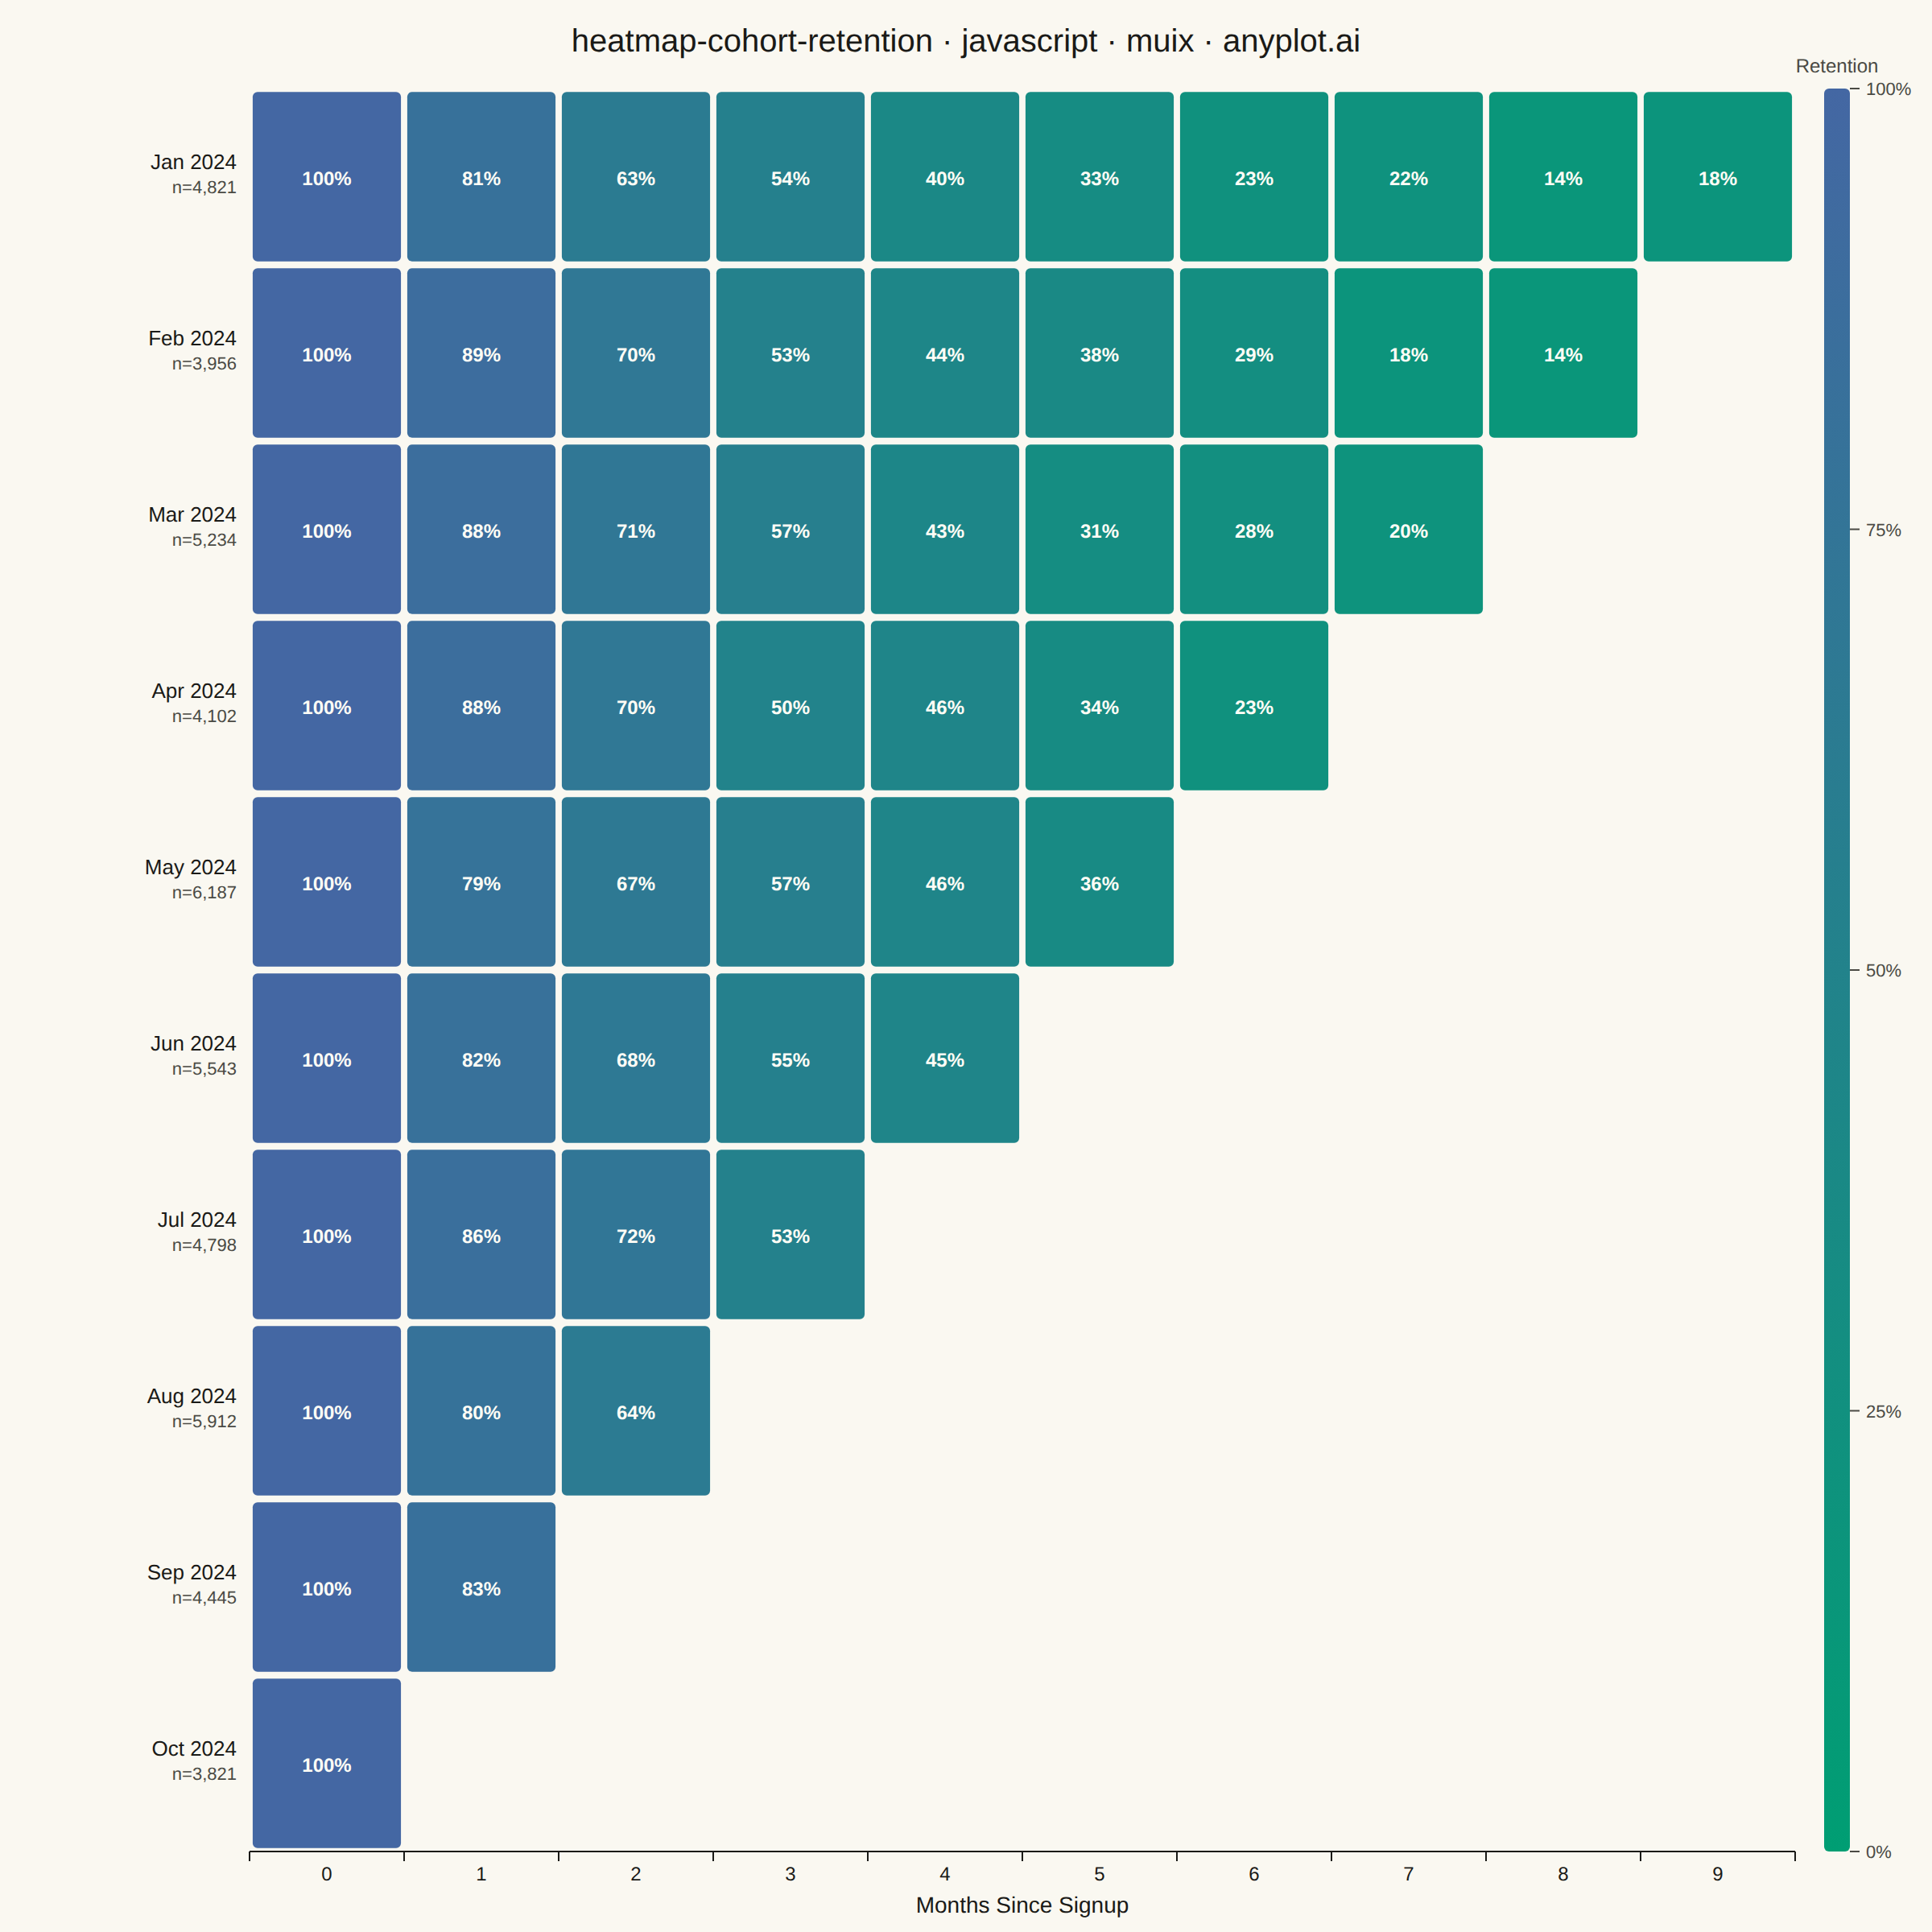
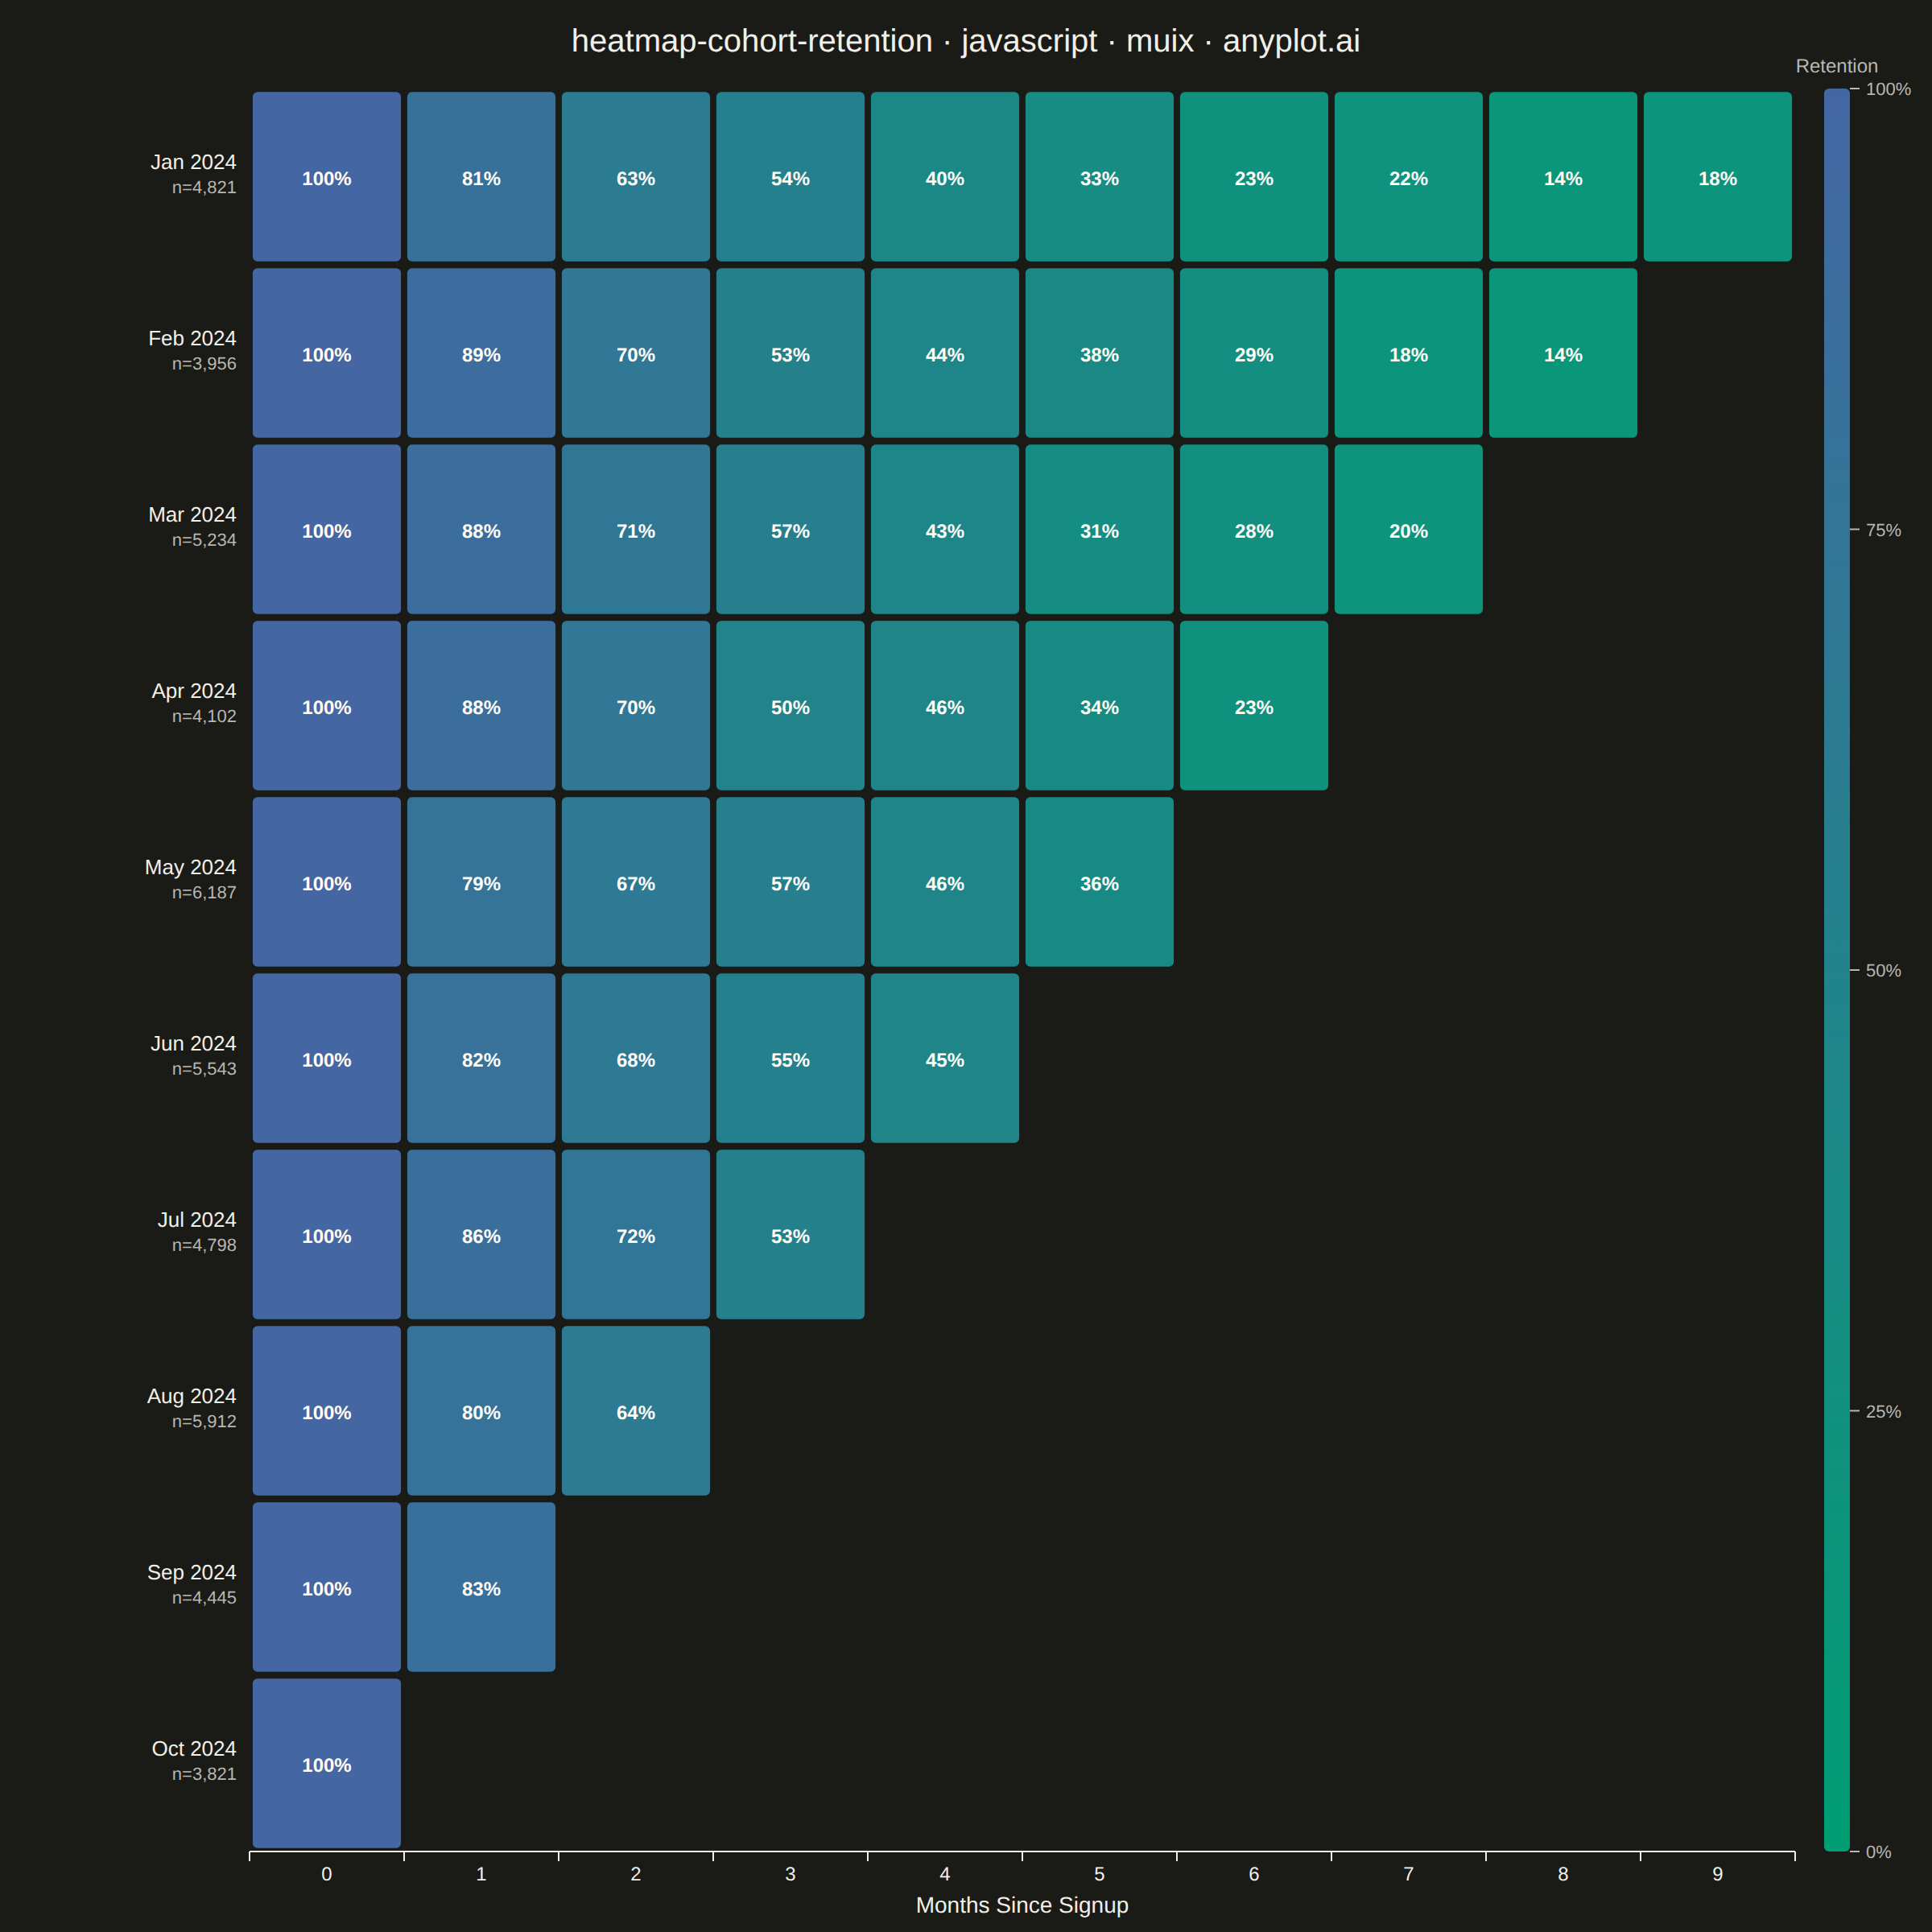
A triangular heatmap displaying user retention rates across signup cohorts and time periods. Each row represents a cohort (e.g., users who signed up in a specific month), each column represents periods since signup, and cell color intensity indicates the retention percentage. The triangular shape naturally emerges because more recent cohorts have fewer elapsed periods. This visualization reveals retention trends, highlights churn patterns, and enables comparison of cohort quality over time.
// anyplot.ai
// heatmap-cohort-retention: Cohort Retention Heatmap
// Library: muix 7.29.1 | JavaScript 22.22.3
// Quality: 90/100 | Created: 2026-06-20
//# anyplot-orientation: square
// anyplot.ai
// heatmap-cohort-retention: Cohort Retention Heatmap
// Library: MUI X Charts | React | Node 22
// License: @mui/x-charts — MIT (community). Pro/Premium are out of scope.
// Quality: pending | Created: 2026-06-20

import { ChartContainer } from "@mui/x-charts/ChartContainer";
import { ChartsXAxis } from "@mui/x-charts/ChartsXAxis";
import { useDrawingArea } from "@mui/x-charts/hooks";
import { useXScale, useYScale } from "@mui/x-charts/hooks";

const tok = window.ANYPLOT_TOKENS;
const W = window.ANYPLOT_SIZE.width;
const H = window.ANYPLOT_SIZE.height;

const COHORTS = [
  { label: "Jan 2024", size: 4821 },
  { label: "Feb 2024", size: 3956 },
  { label: "Mar 2024", size: 5234 },
  { label: "Apr 2024", size: 4102 },
  { label: "May 2024", size: 6187 },
  { label: "Jun 2024", size: 5543 },
  { label: "Jul 2024", size: 4798 },
  { label: "Aug 2024", size: 5912 },
  { label: "Sep 2024", size: 4445 },
  { label: "Oct 2024", size: 3821 },
];

const N_PERIODS = 10;
const PERIOD_LABELS = Array.from({ length: N_PERIODS }, (_, i) => String(i));
const COHORT_LABELS = COHORTS.map(c => c.label);

function makeLcg(seed) {
  let s = seed >>> 0;
  return () => {
    s = (s * 1664525 + 1013904223) >>> 0;
    return s / 4294967296;
  };
}
const rng = makeLcg(42);

const MATRIX = COHORTS.map((_, ci) => {
  const nP = N_PERIODS - ci;
  return Array.from({ length: nP }, (_, pi) => {
    if (pi === 0) return 100;
    const base = 100 * Math.pow(0.80, pi) + 5 / (1 + 0.4 * pi);
    const noise = (rng() - 0.5) * 10;
    return Math.max(2, Math.min(97, Math.round(base + noise)));
  });
});

function hexToRgb(hex) {
  const v = parseInt(hex.replace("#", ""), 16);
  return [(v >> 16) & 255, (v >> 8) & 255, v & 255];
}

function seqColor(pct) {
  const t = Math.max(0, Math.min(1, pct / 100));
  const [r1, g1, b1] = hexToRgb(tok.seq[0]);
  const [r2, g2, b2] = hexToRgb(tok.seq[1]);
  return `rgb(${Math.round(r1 + t * (r2 - r1))},${Math.round(g1 + t * (g2 - g1))},${Math.round(b1 + t * (b2 - b1))})`;
}

// Heatmap cells drawn via MUI X band-scale hooks
function HeatmapCells() {
  const xScale = useXScale("periods");
  const yScale = useYScale("cohorts");
  if (!xScale || !yScale || !xScale.bandwidth) return null;
  const bw = xScale.bandwidth();
  const bh = yScale.bandwidth();
  return (
    <g>
      {MATRIX.map((row, ci) => {
        const y0 = yScale(COHORTS[ci].label);
        if (y0 === undefined) return null;
        return row.map((val, pi) => {
          const x0 = xScale(String(pi));
          if (x0 === undefined) return null;
          return (
            <g key={`${ci}-${pi}`}>
              <rect
                x={x0 + 1} y={y0 + 1}
                width={bw - 2} height={bh - 2}
                fill={seqColor(val)} rx={3}
              />
              <text
                x={x0 + bw / 2} y={y0 + bh / 2 + 5}
                textAnchor="middle" fontSize={12}
                fill="#FFFDF6" fontWeight="600"
              >
                {val}%
              </text>
            </g>
          );
        });
      })}
    </g>
  );
}

// Cohort labels + cohort sizes on left, positioned via MUI X y-scale hook
function CohortLabels() {
  const { left } = useDrawingArea();
  const yScale = useYScale("cohorts");
  if (!yScale || !yScale.bandwidth) return null;
  const bh = yScale.bandwidth();
  return (
    <g>
      {COHORTS.map((cohort, ci) => {
        const y0 = yScale(cohort.label);
        if (y0 === undefined) return null;
        const mid = y0 + bh / 2;
        return (
          <g key={ci}>
            <text
              x={left - 8} y={mid - 5}
              textAnchor="end" fontSize={13}
              fill={tok.ink} fontWeight="500"
            >
              {cohort.label}
            </text>
            <text
              x={left - 8} y={mid + 10}
              textAnchor="end" fontSize={11}
              fill={tok.inkSoft}
            >
              {`n=${cohort.size.toLocaleString()}`}
            </text>
          </g>
        );
      })}
    </g>
  );
}

// Sequential colorbar positioned in right margin via useDrawingArea
function Colorbar() {
  const { left, top, width, height } = useDrawingArea();
  const barX = left + width + 18;
  return (
    <g>
      <defs>
        <linearGradient id="cbGrad" x1="0" y1="1" x2="0" y2="0">
          <stop offset="0%" stopColor={tok.seq[0]} />
          <stop offset="100%" stopColor={tok.seq[1]} />
        </linearGradient>
      </defs>
      <text
        x={barX + 8} y={top - 10}
        textAnchor="middle" fontSize={12}
        fill={tok.inkSoft}
      >
        Retention
      </text>
      <rect x={barX} y={top} width={16} height={height} fill="url(#cbGrad)" rx={3} />
      {[0, 25, 50, 75, 100].map(pct => {
        const ty = top + height * (1 - pct / 100);
        return (
          <g key={pct}>
            <line
              x1={barX + 16} y1={ty} x2={barX + 22} y2={ty}
              stroke={tok.inkSoft} strokeWidth={1}
            />
            <text x={barX + 26} y={ty + 4} fontSize={11} fill={tok.inkSoft}>
              {pct}%
            </text>
          </g>
        );
      })}
    </g>
  );
}

function ChartTitle() {
  const TITLE = "heatmap-cohort-retention · javascript · muix · anyplot.ai";
  const fs = Math.max(13, Math.round(20 * Math.min(1, 60 / TITLE.length)));
  return (
    <text
      x={W / 2} y={32}
      textAnchor="middle" fontSize={fs}
      fill={tok.ink} fontWeight="500"
    >
      {TITLE}
    </text>
  );
}

export default function Chart() {
  return (
    <ChartContainer
      width={W}
      height={H}
      margin={{ left: 155, top: 55, right: 85, bottom: 50 }}
      xAxis={[{
        id: "periods",
        scaleType: "band",
        data: PERIOD_LABELS,
        categoryGapRatio: 0.02,
        label: "Months Since Signup",
      }]}
      yAxis={[{
        id: "cohorts",
        scaleType: "band",
        data: COHORT_LABELS,
        categoryGapRatio: 0.02,
      }]}
      series={[]}
      skipAnimation
    >
      <ChartTitle />
      <HeatmapCells />
      <CohortLabels />
      <Colorbar />
      <ChartsXAxis axisId="periods" />
    </ChartContainer>
  );
}
Runnable source as JSON, for any HTTP client: https://api.anyplot.ai/specs/heatmap-cohort-retention/muix/code. Any spec id and library id listed in llms-full.txt fit the same URL shape; every URL below is complete and callable.
{
  "spec_id": "heatmap-cohort-retention",
  "language": "javascript",
  "library": "muix",
  "page": "https://anyplot.ai/heatmap-cohort-retention/javascript/muix",
  "hub": "https://anyplot.ai/heatmap-cohort-retention",
  "code_json": "https://api.anyplot.ai/specs/heatmap-cohort-retention/muix/code",
  "spec_json": "https://api.anyplot.ai/specs/heatmap-cohort-retention",
  "render_light_png": "https://storage.googleapis.com/anyplot-images/plots/heatmap-cohort-retention/javascript/muix/plot-light.png",
  "render_dark_png": "https://storage.googleapis.com/anyplot-images/plots/heatmap-cohort-retention/javascript/muix/plot-dark.png",
  "interactive_light_html": "https://storage.googleapis.com/anyplot-images/plots/heatmap-cohort-retention/javascript/muix/plot-light.html",
  "interactive_dark_html": "https://storage.googleapis.com/anyplot-images/plots/heatmap-cohort-retention/javascript/muix/plot-dark.html",
  "quality_score": 90.0,
  "license": "MIT",
  "guide": "https://anyplot.ai/llms.txt"
}
Part of Cohort Retention Heatmap on anyplot.ai.