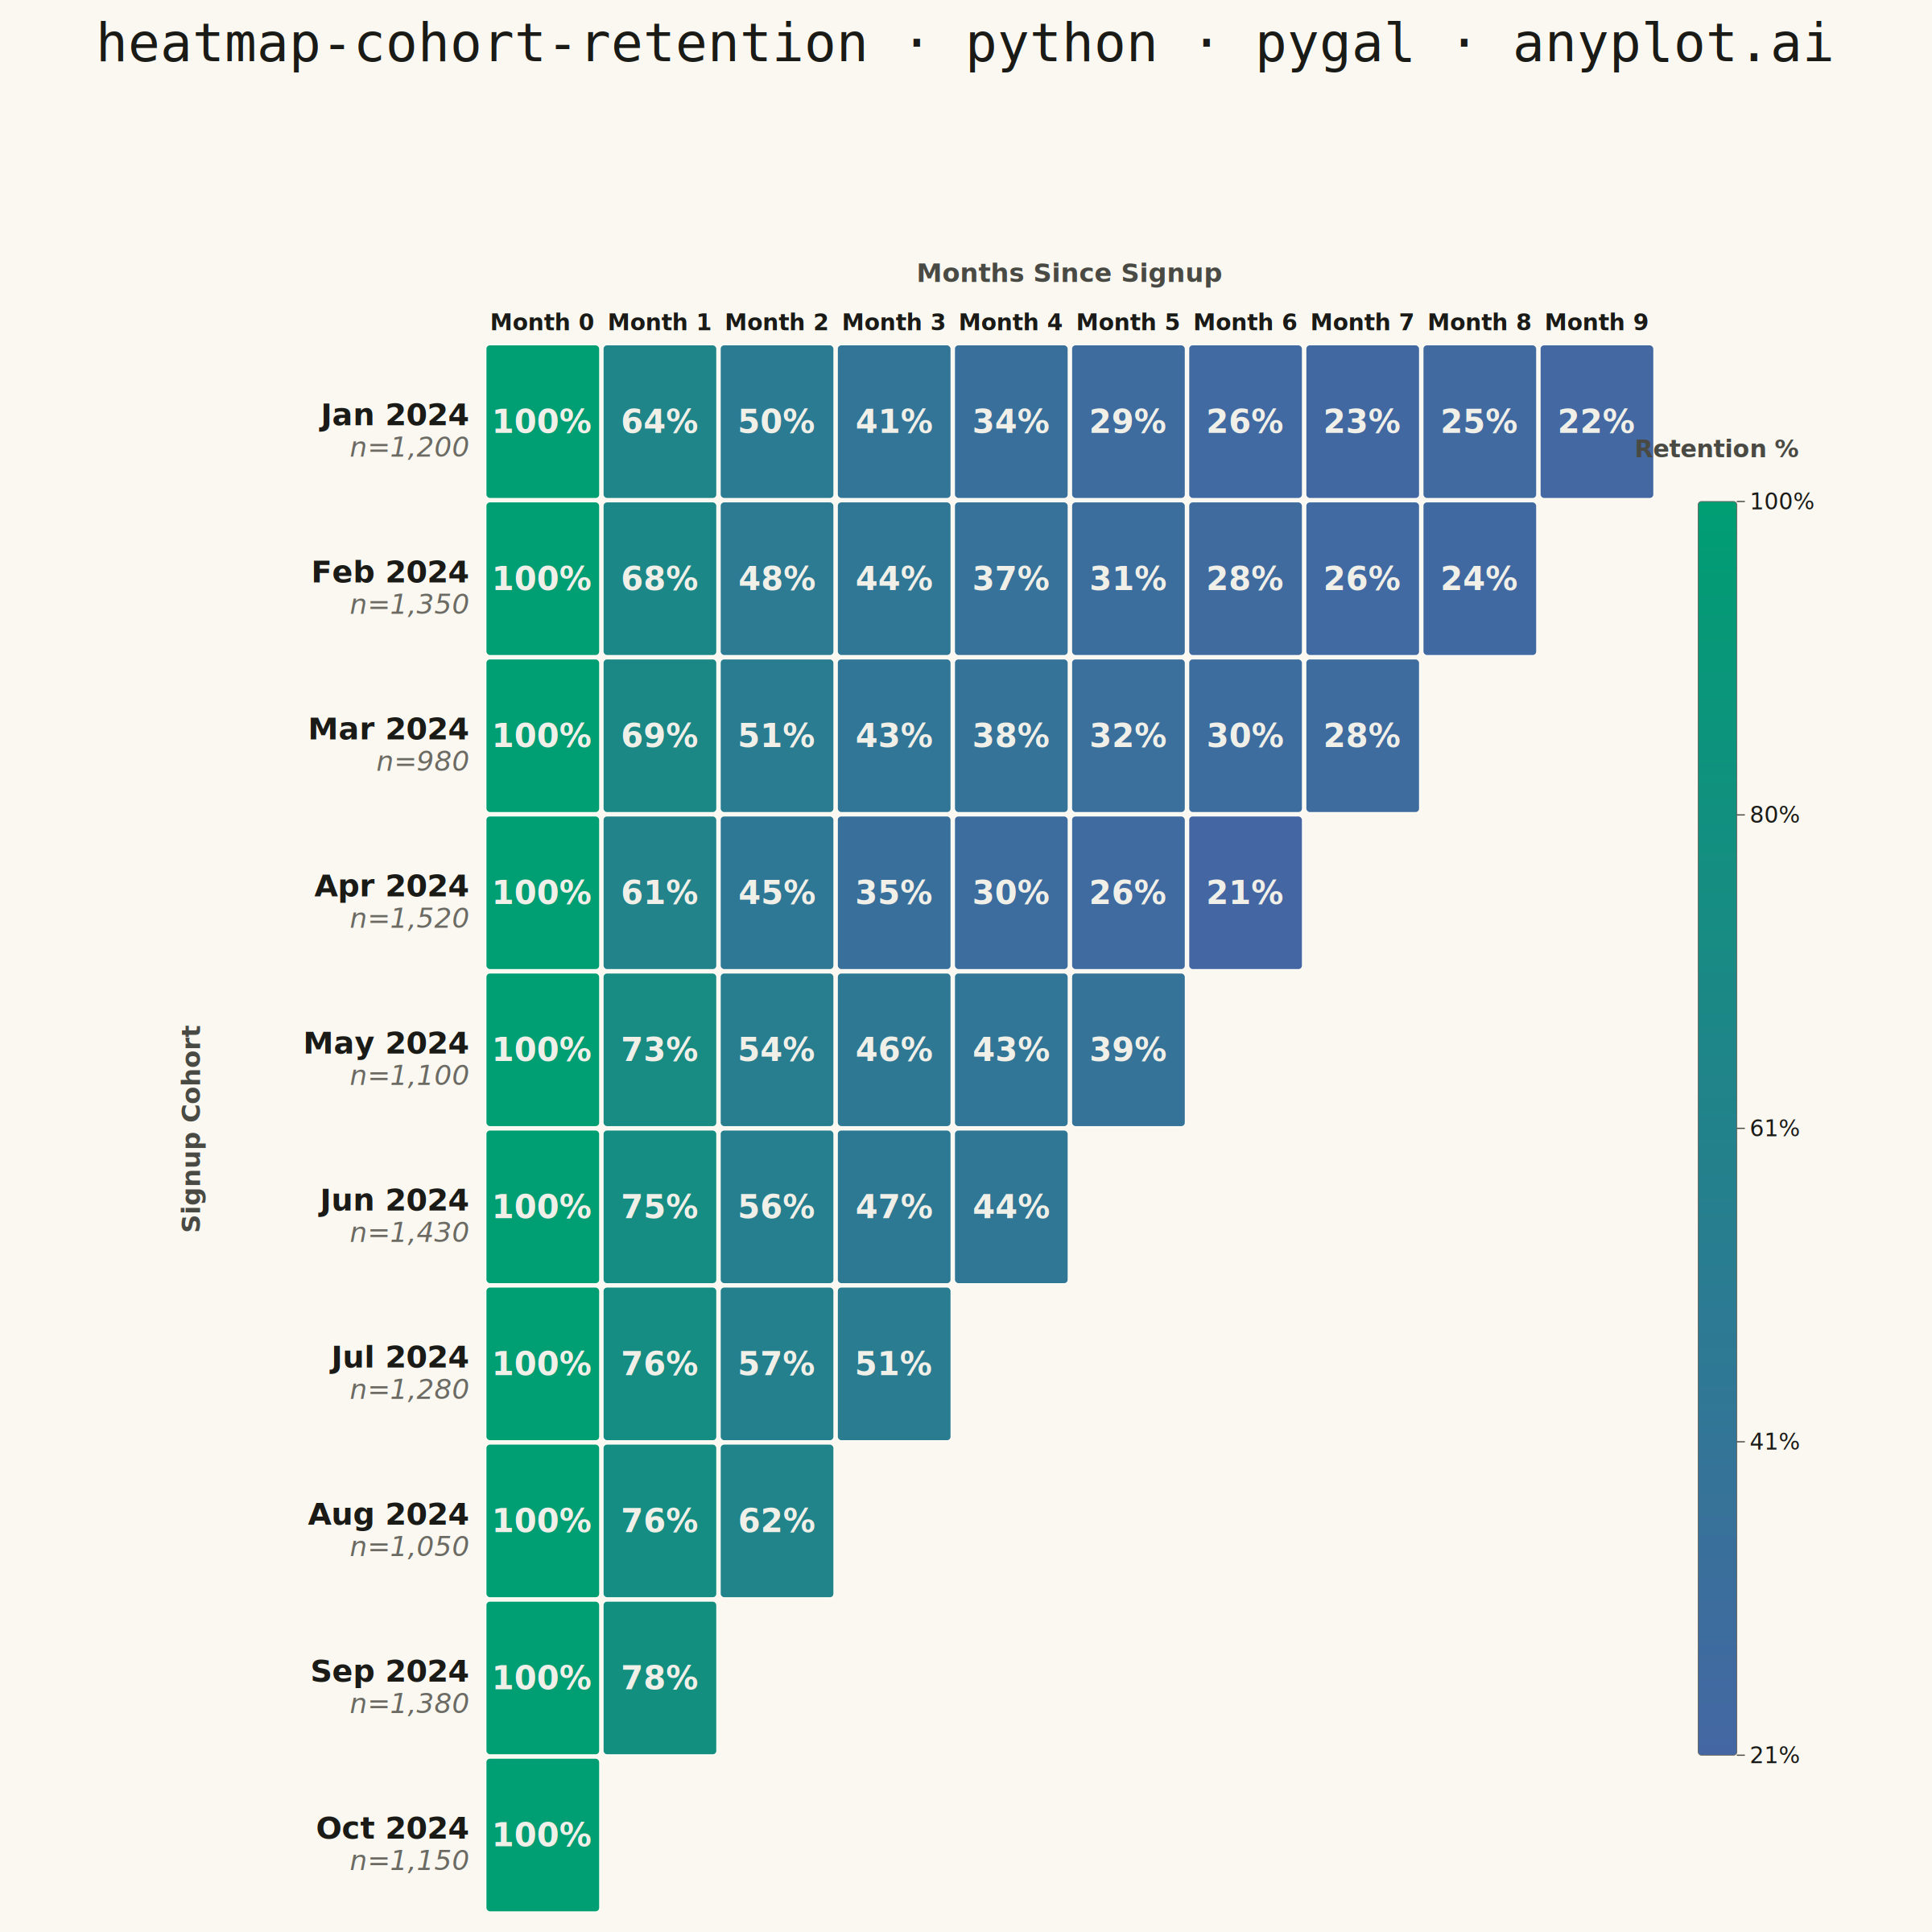
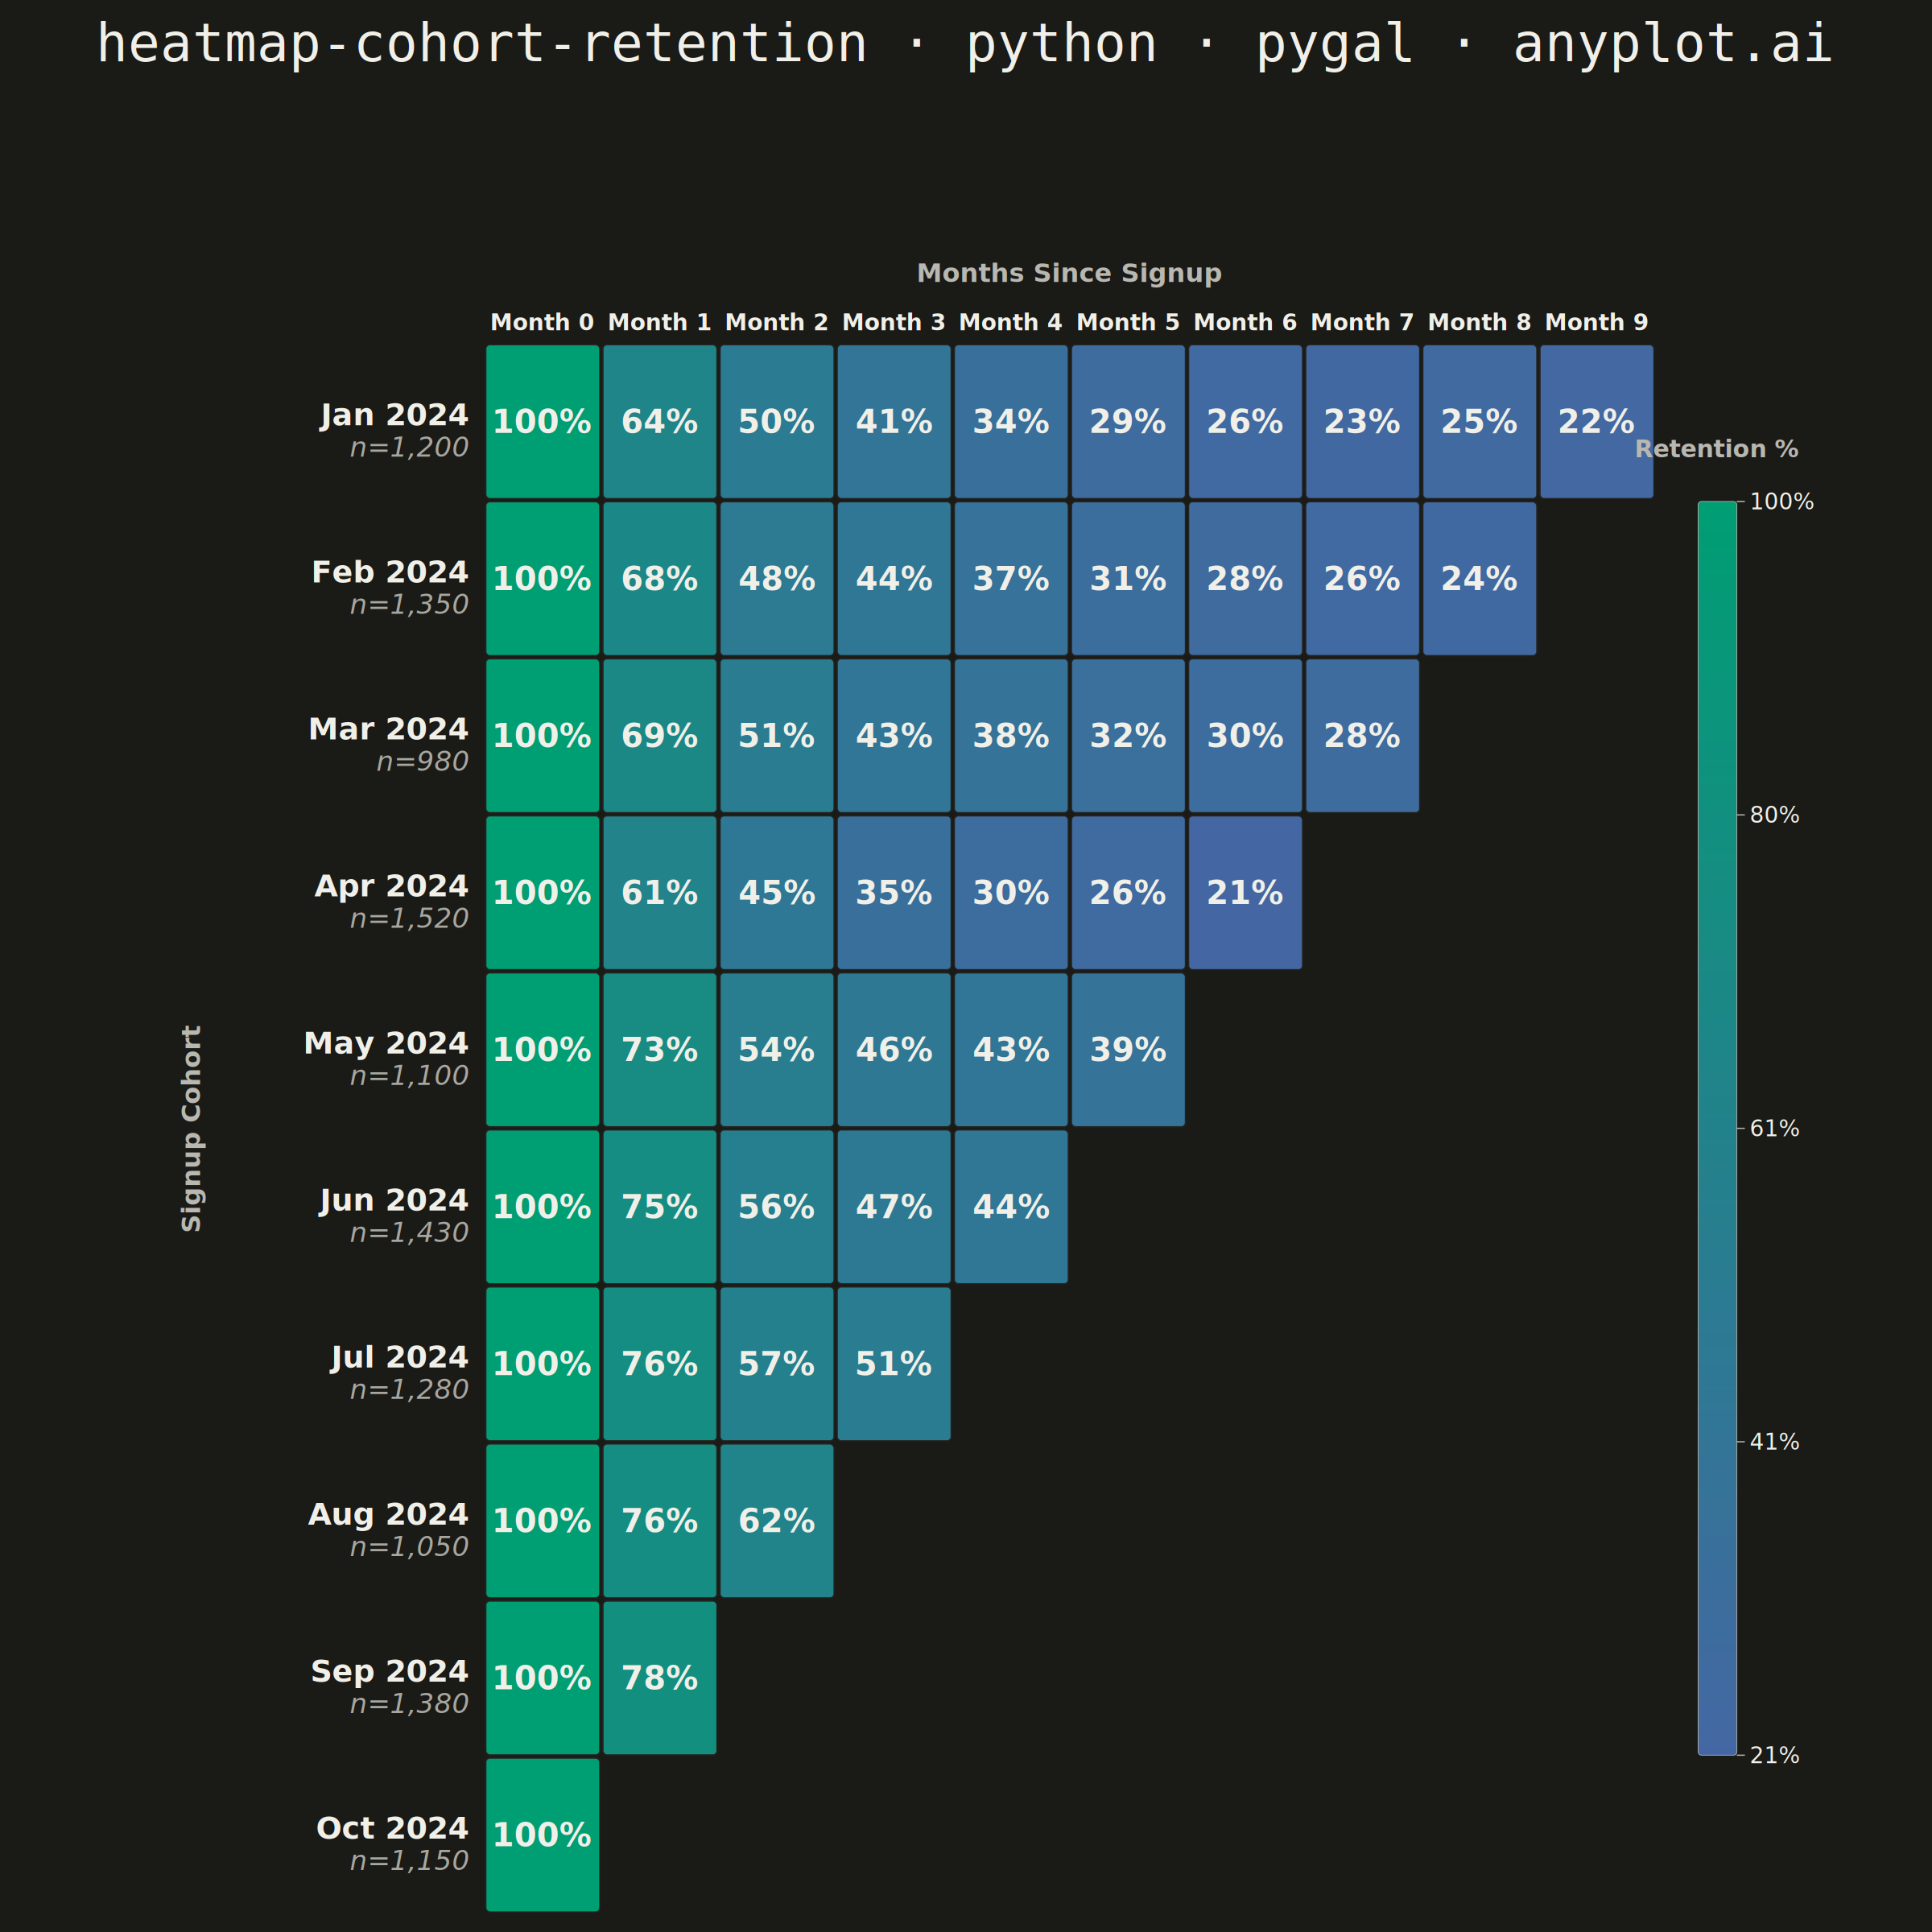
A triangular heatmap displaying user retention rates across signup cohorts and time periods. Each row represents a cohort (e.g., users who signed up in a specific month), each column represents periods since signup, and cell color intensity indicates the retention percentage. The triangular shape naturally emerges because more recent cohorts have fewer elapsed periods. This visualization reveals retention trends, highlights churn patterns, and enables comparison of cohort quality over time.
""" anyplot.ai
heatmap-cohort-retention: Cohort Retention Heatmap
Library: pygal 3.1.3 | Python 3.13.14
Quality: 89/100 | Updated: 2026-06-20
"""

import os
import sys

import numpy as np


THEME = os.getenv("ANYPLOT_THEME", "light")
PAGE_BG = "#FAF8F1" if THEME == "light" else "#1A1A17"
ELEVATED_BG = "#FFFDF6" if THEME == "light" else "#242420"
INK = "#1A1A17" if THEME == "light" else "#F0EFE8"
INK_SOFT = "#4A4A44" if THEME == "light" else "#B8B7B0"
INK_MUTED = "#6B6A63" if THEME == "light" else "#A8A79F"

# Remove script dir so "pygal" resolves to the installed package, not this file
_cwd = sys.path.pop(0)
from pygal.graph.graph import Graph
from pygal.style import Style


sys.path.insert(0, _cwd)


class CohortRetentionHeatmap(Graph):
    _series_margin = 0

    def __init__(self, *args, **kwargs):
        self.matrix_data = kwargs.pop("matrix_data", [])
        self.row_labels = kwargs.pop("row_labels", [])
        self.col_labels = kwargs.pop("col_labels", [])
        self.cohort_sizes = kwargs.pop("cohort_sizes", [])
        self.colormap = kwargs.pop("colormap", [])
        super().__init__(*args, **kwargs)

    def _lerp_color(self, c0, c1, t):
        r = int(round(int(c0[1:3], 16) + (int(c1[1:3], 16) - int(c0[1:3], 16)) * t))
        g = int(round(int(c0[3:5], 16) + (int(c1[3:5], 16) - int(c0[3:5], 16)) * t))
        b = int(round(int(c0[5:7], 16) + (int(c1[5:7], 16) - int(c0[5:7], 16)) * t))
        return f"#{r:02X}{g:02X}{b:02X}"

    def _cell_color(self, value, min_val, max_val):
        if max_val == min_val:
            return self.colormap[len(self.colormap) // 2]
        t = max(0.0, min(1.0, (value - min_val) / (max_val - min_val)))
        pos = t * (len(self.colormap) - 1)
        lo = int(pos)
        hi = min(lo + 1, len(self.colormap) - 1)
        return self._lerp_color(self.colormap[lo], self.colormap[hi], pos - lo)

    def _text_on(self, bg):
        lum = (int(bg[1:3], 16) * 299 + int(bg[3:5], 16) * 587 + int(bg[5:7], 16) * 114) / 1000
        return "#F0EFE8" if lum < 140 else "#1A1A17"

    def _plot(self):
        if not self.matrix_data:
            return

        n_rows = len(self.matrix_data)
        n_cols = max(len(row) for row in self.matrix_data)
        non_null = [v for row in self.matrix_data for v in row if v is not None]
        min_val, max_val = min(non_null), max(non_null)

        pw, ph = self.view.width, self.view.height
        lm_l, lm_r, lm_t, lm_b = 460, 285, 130, 15
        aw, ah = pw - lm_l - lm_r, ph - lm_t - lm_b
        cw = aw / n_cols
        ch = ah / (n_rows + 0.2)
        gap = 4

        gw = n_cols * (cw + gap) - gap
        gh = n_rows * (ch + gap) - gap

        x0 = self.view.x(0) + lm_l + (aw - gw) / 2
        y0 = self.view.y(n_rows) + lm_t + (ah - gh - ch * 0.2) / 2

        pn = self.nodes["plot"]
        col_fs = min(28, int(cw * 0.34))
        row_fs = min(38, int(ch * 0.48))
        size_fs = int(row_fs * 0.92)
        val_fs = min(40, int(min(cw, ch) * 0.44))

        # Column section header
        nd = self.svg.node(pn, "text", x=x0 + gw / 2, y=y0 - 78)
        nd.set("text-anchor", "middle")
        nd.set("fill", INK_SOFT)
        nd.set("style", f"font-size:{col_fs + 4}px;font-weight:600;font-family:'Segoe UI',Roboto,sans-serif")
        nd.text = "Months Since Signup"

        # Column headers
        for j, lbl in enumerate(self.col_labels):
            cx = x0 + j * (cw + gap) + cw / 2
            nd = self.svg.node(pn, "text", x=cx, y=y0 - 18)
            nd.set("text-anchor", "middle")
            nd.set("fill", INK)
            nd.set("style", f"font-size:{col_fs}px;font-weight:700;font-family:'Segoe UI',Roboto,sans-serif")
            nd.text = str(lbl)

        # Row labels with cohort sizes
        for i, lbl in enumerate(self.row_labels):
            ry = y0 + i * (ch + gap) + ch / 2
            rx = x0 - 22
            nd = self.svg.node(pn, "text", x=rx, y=ry + row_fs * 0.12)
            nd.set("text-anchor", "end")
            nd.set("fill", INK)
            nd.set("style", f"font-size:{row_fs}px;font-weight:600;font-family:'Segoe UI',Roboto,sans-serif")
            nd.text = str(lbl)
            if i < len(self.cohort_sizes):
                nd2 = self.svg.node(pn, "text", x=rx, y=ry + row_fs * 0.12 + size_fs + 5)
                nd2.set("text-anchor", "end")
                nd2.set("fill", INK_MUTED)
                nd2.set("style", f"font-size:{size_fs}px;font-style:italic;font-family:'Segoe UI',Roboto,sans-serif")
                nd2.text = f"n={self.cohort_sizes[i]:,}"

        # Y-axis title (rotated)
        ytx, yty = x0 - 355, y0 + gh / 2
        nd = self.svg.node(pn, "text", x=ytx, y=yty)
        nd.set("text-anchor", "middle")
        nd.set("fill", INK_SOFT)
        nd.set("style", f"font-size:{col_fs + 4}px;font-weight:600;font-family:'Segoe UI',Roboto,sans-serif")
        nd.set("transform", f"rotate(-90, {ytx}, {yty})")
        nd.text = "Signup Cohort"

        # Cells
        for i in range(n_rows):
            for j in range(len(self.matrix_data[i])):
                v = self.matrix_data[i][j]
                if v is None:
                    continue
                color = self._cell_color(v, min_val, max_val)
                tc = self._text_on(color)
                cx = x0 + j * (cw + gap)
                cy = y0 + i * (ch + gap)

                grp = self.svg.node(pn, "g")
                rect = self.svg.node(grp, "rect", x=cx, y=cy, width=cw, height=ch, rx=5, ry=5)
                rect.set("fill", color)
                rect.set("stroke", ELEVATED_BG)
                rect.set("stroke-width", "1.5")

                co_lbl = self.row_labels[i] if i < len(self.row_labels) else ""
                self._tooltip_data(grp, f"{v:.1f}%", cx + cw / 2, cy + ch / 2, xlabel=f"{co_lbl} – Month {j}")

                vt = self.svg.node(grp, "text", x=cx + cw / 2, y=cy + ch / 2 + val_fs * 0.35)
                vt.set("text-anchor", "middle")
                vt.set("fill", tc)
                vt.set("style", f"font-size:{val_fs}px;font-weight:600;font-family:'Segoe UI',Roboto,sans-serif")
                vt.text = f"{v:.0f}%"

        # Colorbar
        cb_w, cb_h = 48, gh * 0.80
        cb_x, cb_y = x0 + gw + 55, y0 + (gh - cb_h) / 2
        cb_ls = 28

        defs = self.svg.node(pn, "defs")
        grad = self.svg.node(defs, "linearGradient", id="cb-gradient", x1="0", y1="0", x2="0", y2="1")
        for fi in range(21):
            f = fi / 20.0
            val = max_val - (max_val - min_val) * f
            color = self._cell_color(val, min_val, max_val)
            stop = self.svg.node(grad, "stop", offset=f"{f * 100}%")
            stop.set("stop-color", color)

        cbr = self.svg.node(pn, "rect", x=cb_x, y=cb_y, width=cb_w, height=cb_h, rx=4, ry=4)
        cbr.set("fill", "url(#cb-gradient)")
        cbr.set("stroke", INK_MUTED)
        cbr.set("stroke-width", "1")

        for frac, val in [
            (0.0, max_val),
            (0.25, max_val * 0.75 + min_val * 0.25),
            (0.5, (min_val + max_val) / 2),
            (0.75, max_val * 0.25 + min_val * 0.75),
            (1.0, min_val),
        ]:
            ty = cb_y + cb_h * frac
            tk = self.svg.node(pn, "line", x1=cb_x + cb_w, y1=ty, x2=cb_x + cb_w + 10, y2=ty)
            tk.set("stroke", INK_SOFT)
            tk.set("stroke-width", "1.5")
            tt = self.svg.node(pn, "text", x=cb_x + cb_w + 16, y=ty + cb_ls * 0.35)
            tt.set("fill", INK)
            tt.set("style", f"font-size:{cb_ls}px;font-family:'Segoe UI',Roboto,sans-serif")
            tt.text = f"{val:.0f}%"

        cbt = self.svg.node(pn, "text", x=cb_x + cb_w / 2, y=cb_y - 55)
        cbt.set("text-anchor", "middle")
        cbt.set("fill", INK_SOFT)
        cbt.set("style", f"font-size:{cb_ls + 2}px;font-weight:600;font-family:'Segoe UI',Roboto,sans-serif")
        cbt.text = "Retention %"

    def _compute(self):
        n_rows = len(self.matrix_data) if self.matrix_data else 1
        n_cols = max(len(row) for row in self.matrix_data) if self.matrix_data else 1
        self._box.xmin = 0
        self._box.xmax = n_cols
        self._box.ymin = 0
        self._box.ymax = n_rows


# Data
np.random.seed(42)

cohort_labels = [
    "Jan 2024",
    "Feb 2024",
    "Mar 2024",
    "Apr 2024",
    "May 2024",
    "Jun 2024",
    "Jul 2024",
    "Aug 2024",
    "Sep 2024",
    "Oct 2024",
]
n_cohorts = len(cohort_labels)
n_max_periods = 10
cohort_sizes = [1200, 1350, 980, 1520, 1100, 1430, 1280, 1050, 1380, 1150]
base_retention = np.array([100.0, 65.0, 48.0, 40.0, 34.0, 30.0, 27.0, 25.0, 23.5, 22.0])

matrix = []
for i in range(n_cohorts):
    n_periods = n_max_periods - i
    row = []
    for j in range(n_periods):
        if j == 0:
            row.append(100.0)
        else:
            improvement = i * 1.8
            if i == 3:
                improvement = -4.0
            noise = np.random.uniform(-2.0, 2.0)
            val = max(5.0, min(100.0, base_retention[j] + improvement + noise))
            row.append(round(val, 1))
    matrix.append(row)

period_labels = [f"Month {i}" for i in range(n_max_periods)]

# Imprint sequential colormap: #4467A3 (blue, low retention) → #009E73 (green, high retention)
_n_stops = 12
imprint_seq = []
for _i in range(_n_stops):
    _t = _i / (_n_stops - 1)
    _r = int(round(0x44 + (0x00 - 0x44) * _t))
    _g = int(round(0x67 + (0x9E - 0x67) * _t))
    _b = int(round(0xA3 + (0x73 - 0xA3) * _t))
    imprint_seq.append(f"#{_r:02X}{_g:02X}{_b:02X}")

IMPRINT_PALETTE = ("#009E73", "#C475FD", "#4467A3", "#BD8233", "#AE3030", "#2ABCCD", "#954477", "#99B314")

custom_style = Style(
    background=PAGE_BG,
    plot_background=PAGE_BG,
    foreground=INK,
    foreground_strong=INK,
    foreground_subtle=INK_MUTED,
    colors=IMPRINT_PALETTE,
    title_font_size=66,
    label_font_size=56,
    major_label_font_size=44,
    legend_font_size=44,
    value_font_size=36,
    stroke_width=2.5,
)

title = "heatmap-cohort-retention · python · pygal · anyplot.ai"

chart = CohortRetentionHeatmap(
    width=2400,
    height=2400,
    style=custom_style,
    title=title,
    matrix_data=matrix,
    row_labels=cohort_labels,
    col_labels=period_labels,
    cohort_sizes=cohort_sizes,
    colormap=imprint_seq,
    show_legend=False,
    margin=100,
    margin_top=200,
    margin_bottom=30,
    margin_left=120,
    margin_right=120,
    show_x_labels=False,
    show_y_labels=False,
)

chart.add("data", [0])

# Save
chart.render_to_png(f"plot-{THEME}.png")
chart.render_to_file(f"plot-{THEME}.svg")

html_content = f"""<!DOCTYPE html>
<html>
<head>
    <meta charset="utf-8">
    <title>heatmap-cohort-retention · python · pygal · anyplot.ai</title>
    <style>
        body {{ margin: 0; background: {PAGE_BG}; display: flex; justify-content: center; align-items: center; min-height: 100vh; }}
    </style>
</head>
<body>
    {chart.render(is_unicode=True)}
</body>
</html>"""

with open(f"plot-{THEME}.html", "w", encoding="utf-8") as f:
    f.write(html_content)
Runnable source as JSON, for any HTTP client: https://api.anyplot.ai/specs/heatmap-cohort-retention/pygal/code. Any spec id and library id listed in llms-full.txt fit the same URL shape; every URL below is complete and callable.
{
  "spec_id": "heatmap-cohort-retention",
  "language": "python",
  "library": "pygal",
  "page": "https://anyplot.ai/heatmap-cohort-retention/python/pygal",
  "hub": "https://anyplot.ai/heatmap-cohort-retention",
  "code_json": "https://api.anyplot.ai/specs/heatmap-cohort-retention/pygal/code",
  "spec_json": "https://api.anyplot.ai/specs/heatmap-cohort-retention",
  "render_light_png": "https://storage.googleapis.com/anyplot-images/plots/heatmap-cohort-retention/python/pygal/plot-light.png",
  "render_dark_png": "https://storage.googleapis.com/anyplot-images/plots/heatmap-cohort-retention/python/pygal/plot-dark.png",
  "interactive_light_html": "https://storage.googleapis.com/anyplot-images/plots/heatmap-cohort-retention/python/pygal/plot-light.html",
  "interactive_dark_html": "https://storage.googleapis.com/anyplot-images/plots/heatmap-cohort-retention/python/pygal/plot-dark.html",
  "quality_score": 89.0,
  "license": "MIT",
  "guide": "https://anyplot.ai/llms.txt"
}
Part of Cohort Retention Heatmap on anyplot.ai.