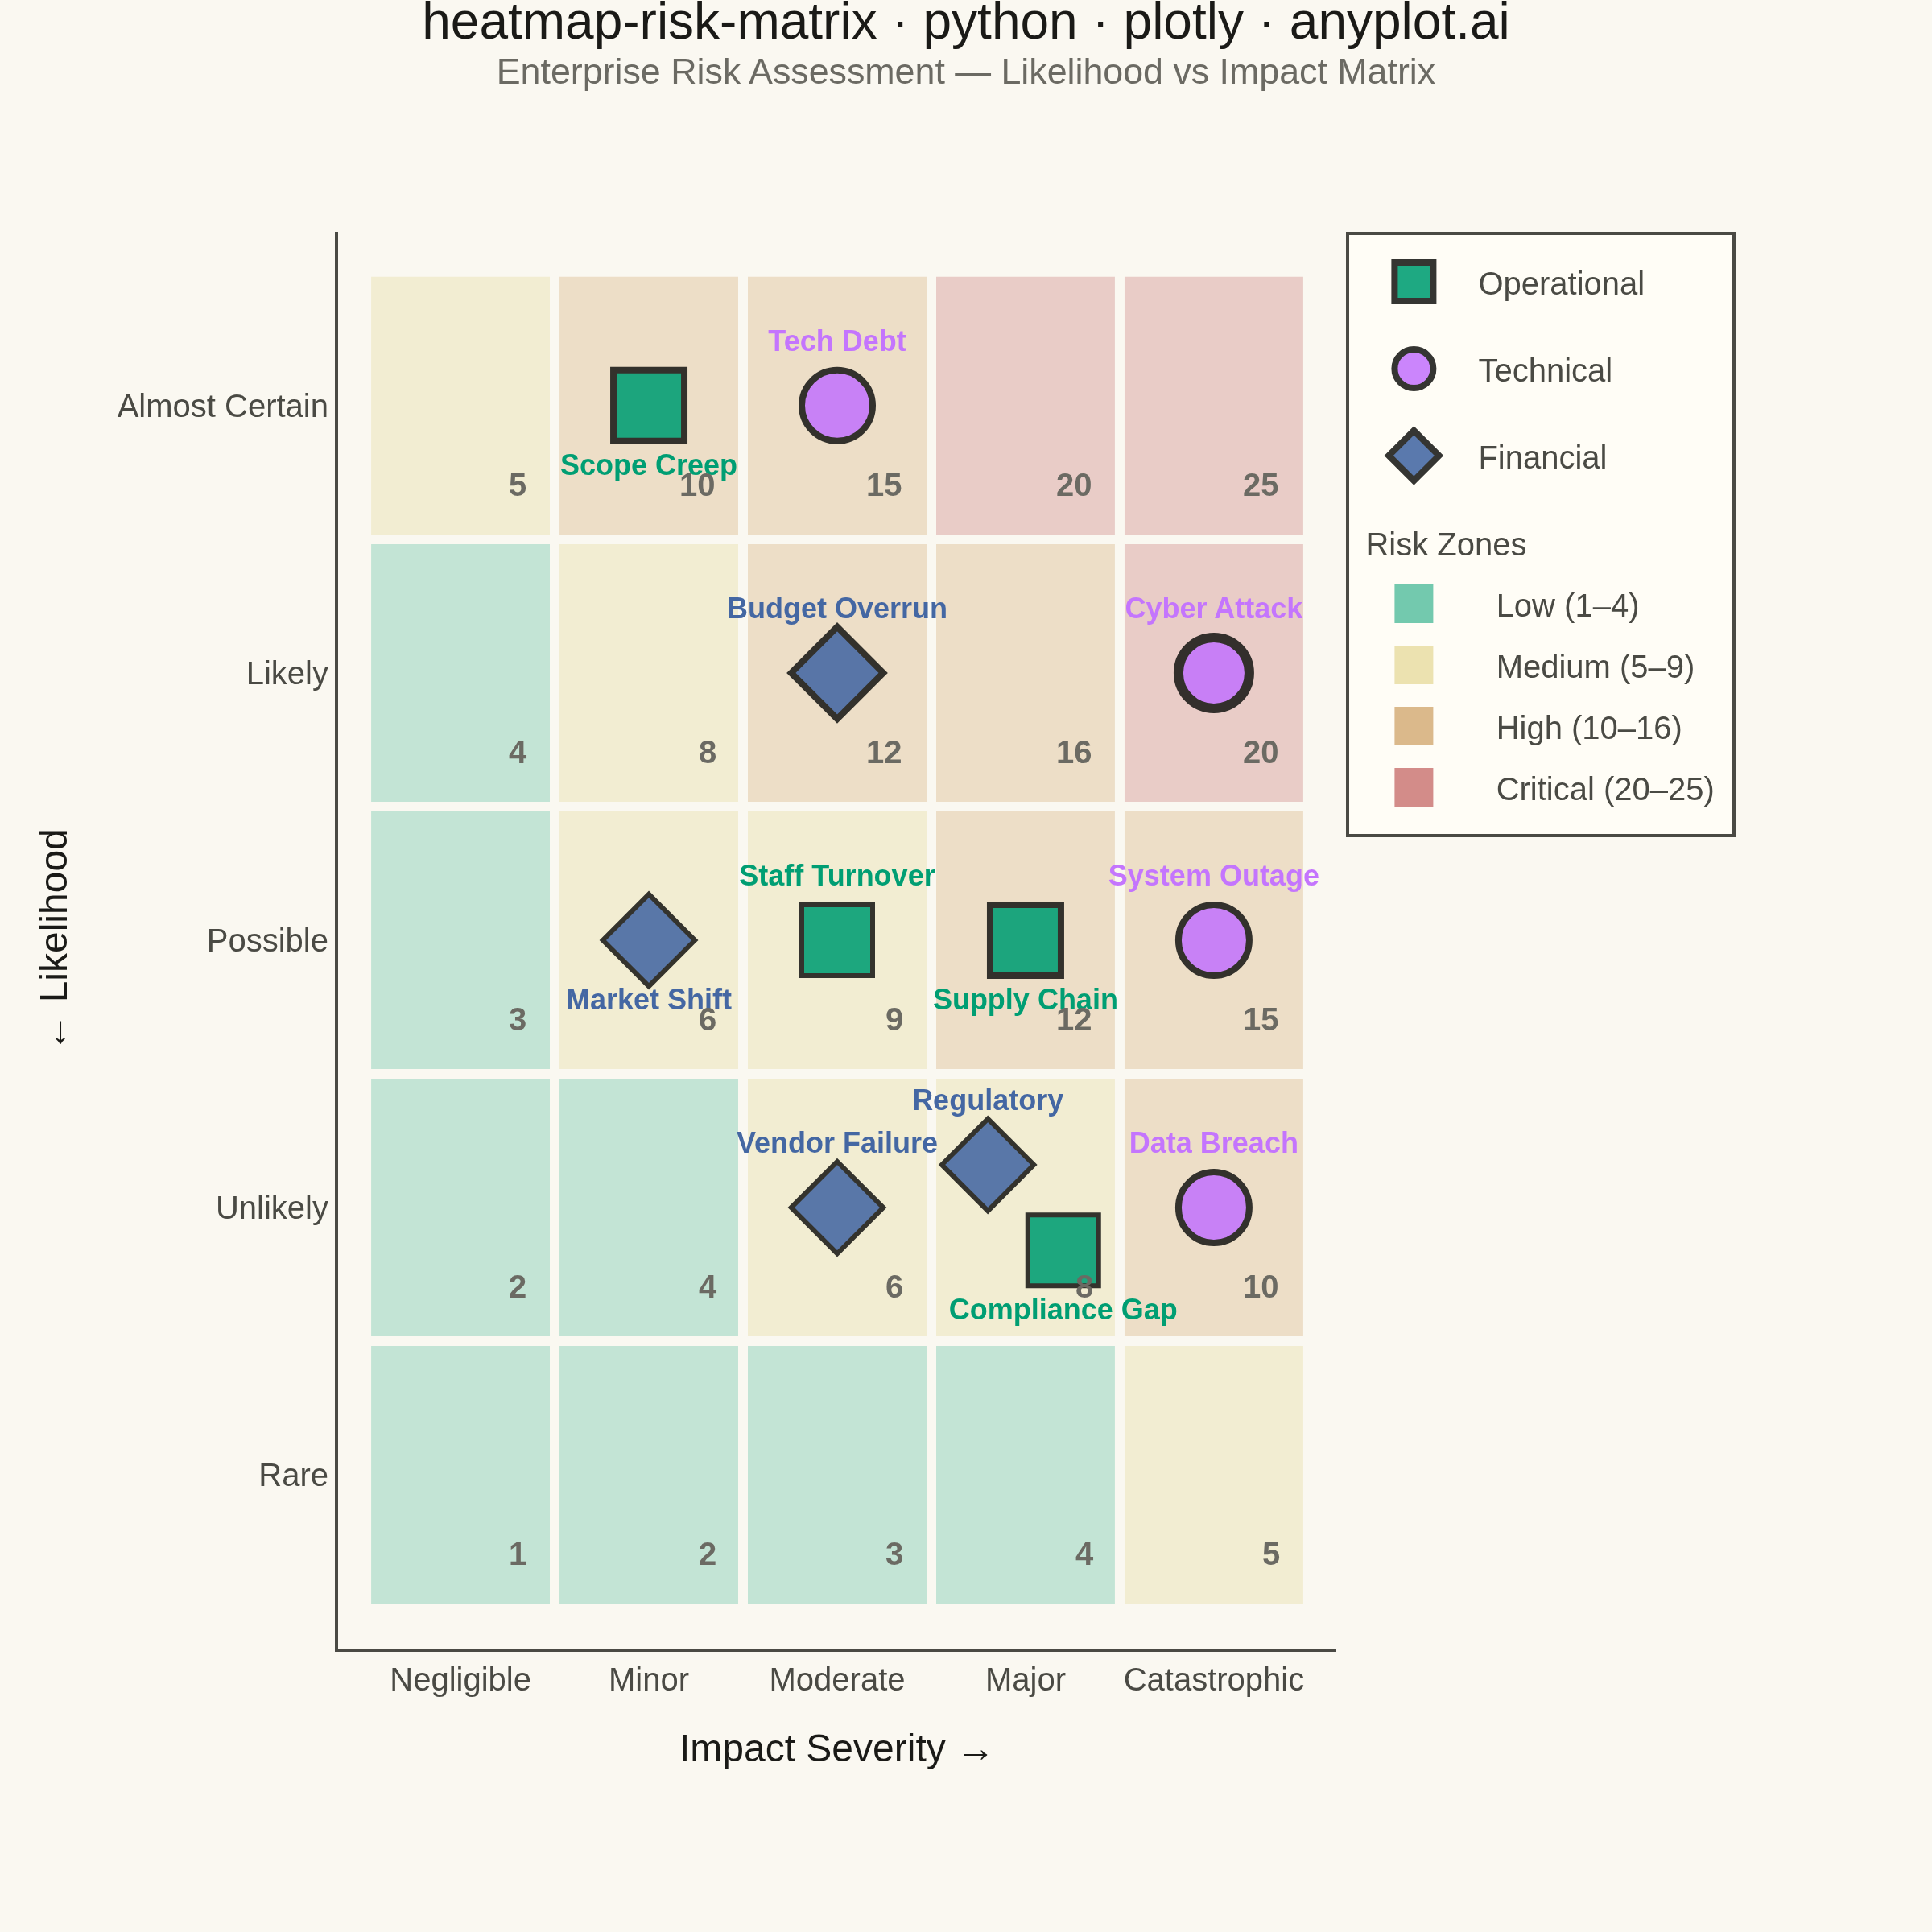
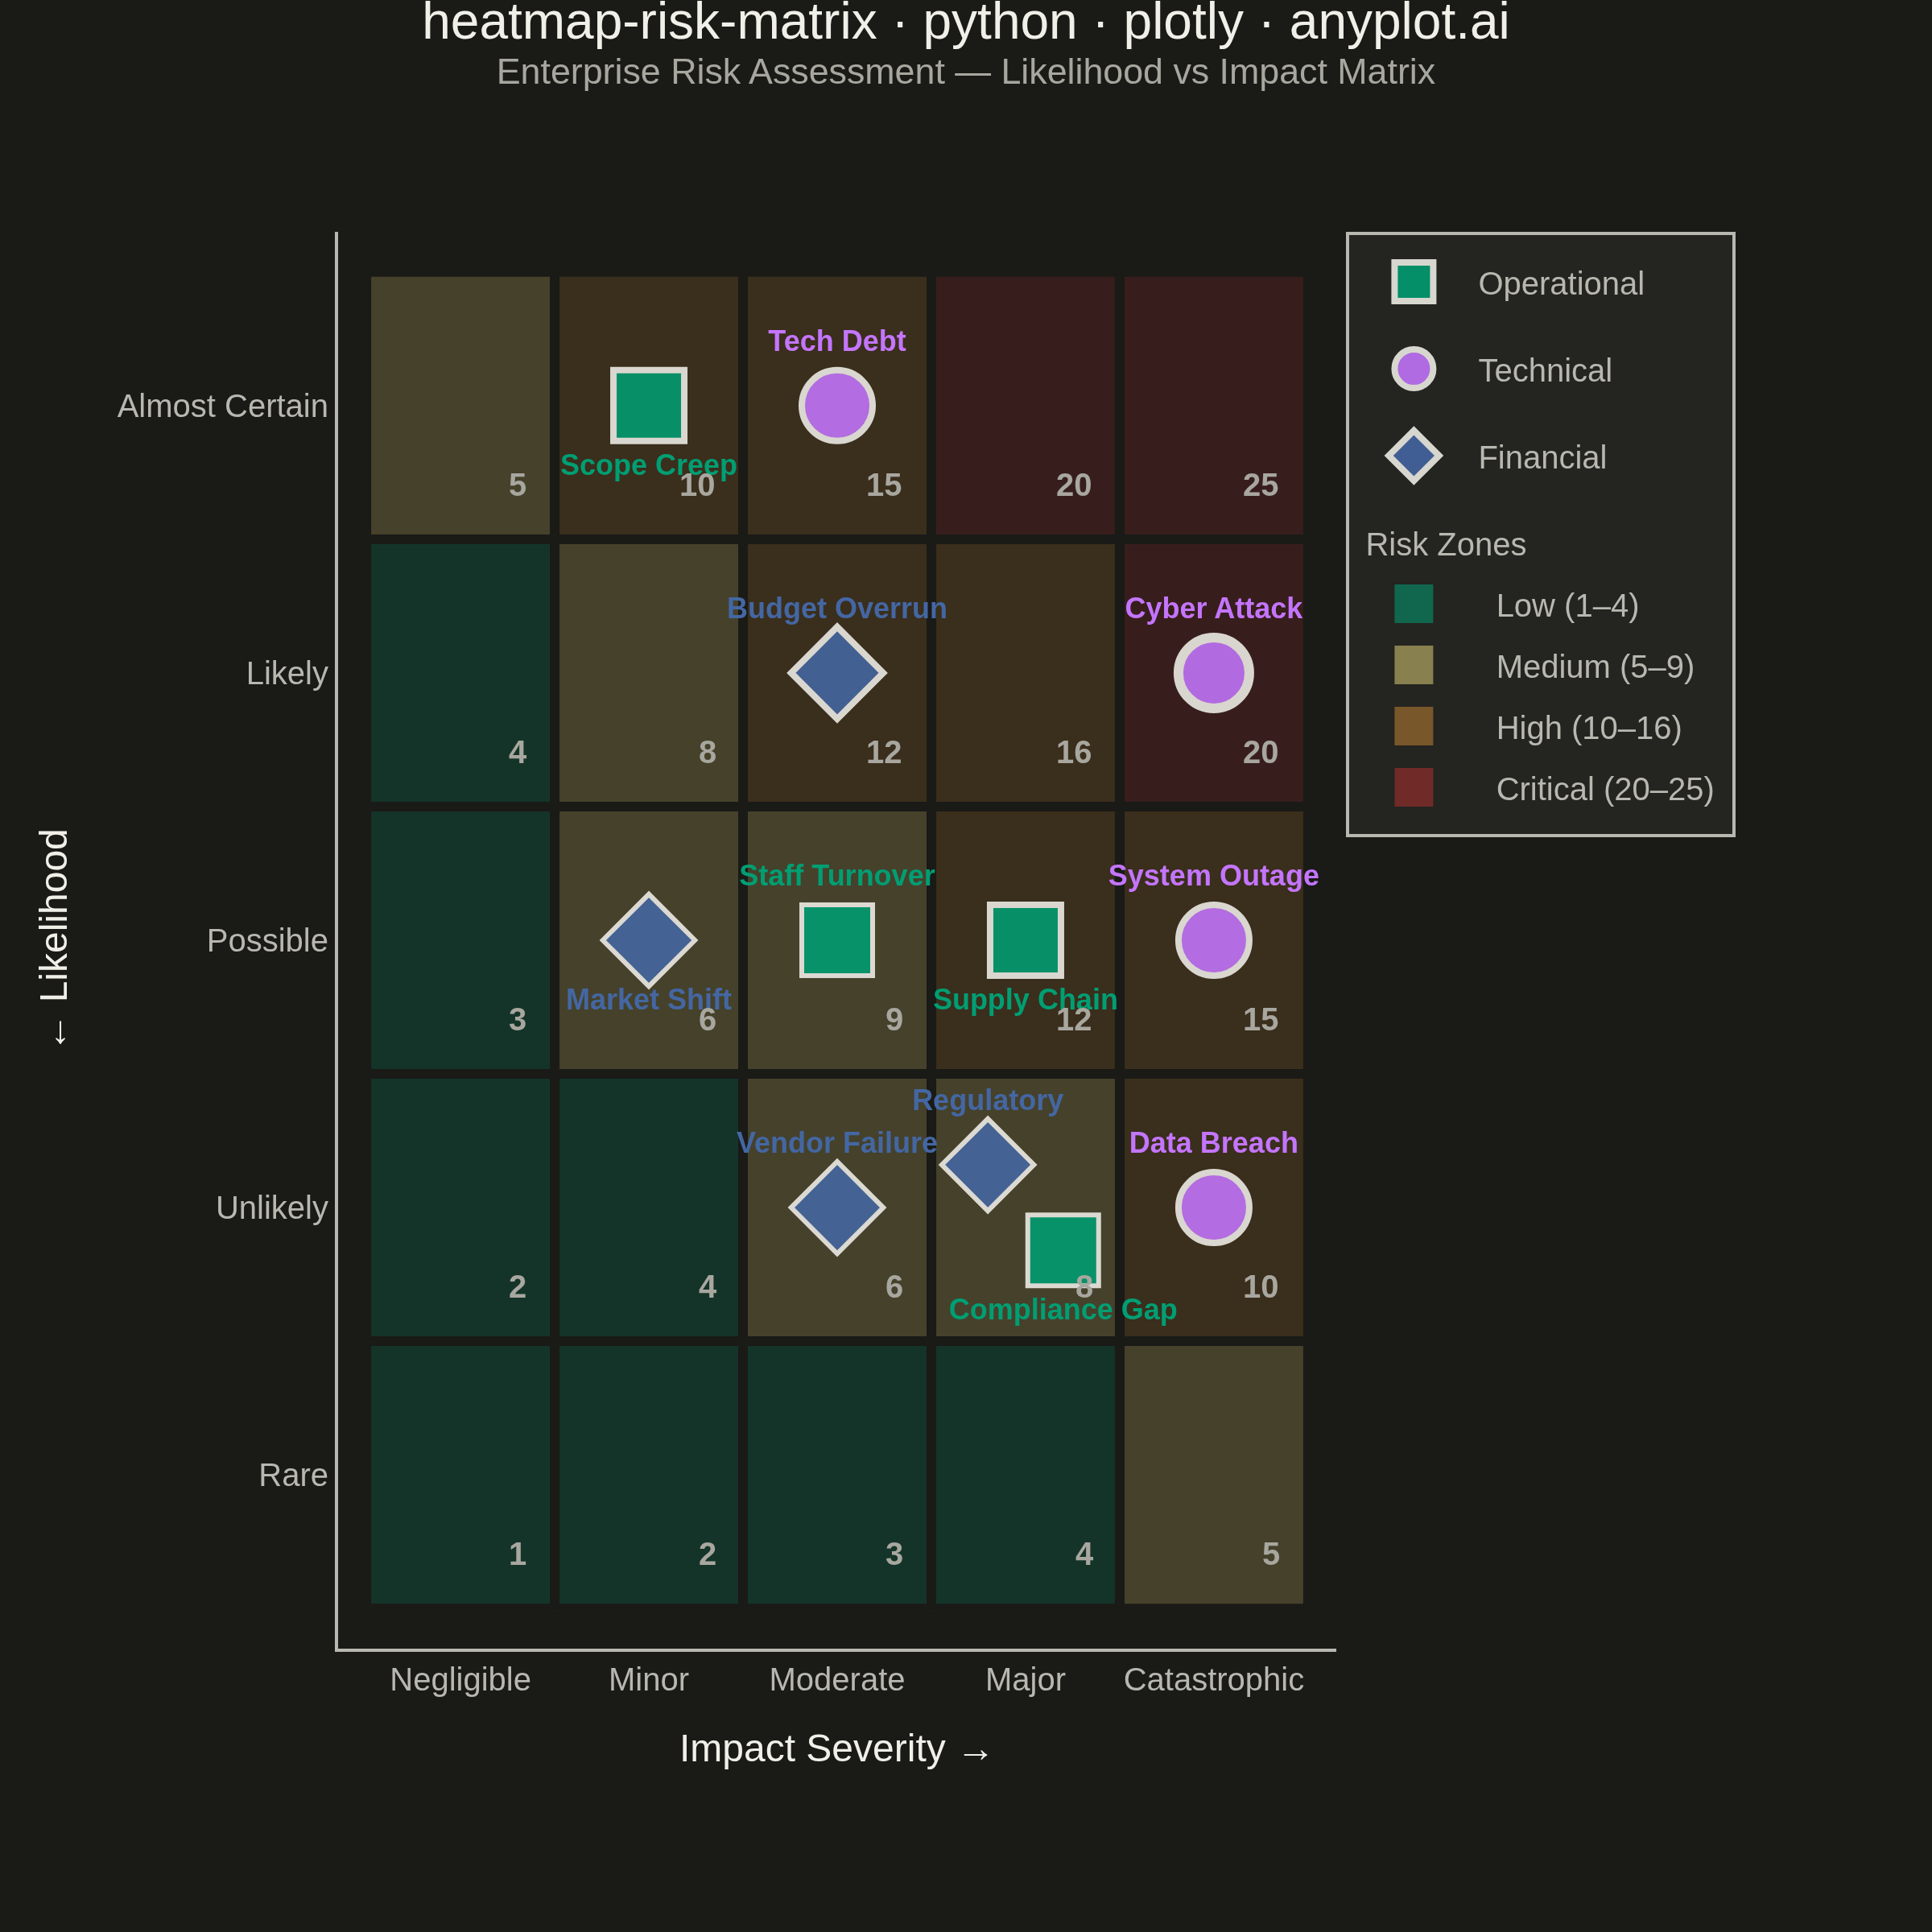
A 5x5 grid heatmap plotting risk likelihood against consequence severity, used to visualize and prioritize risks in project and enterprise risk management. Cells are color-coded from green (low risk) through yellow and orange to red (critical risk), with individual risk items plotted as labeled markers. The risk score for each cell is the product of likelihood and impact, and zones are labeled to indicate risk severity levels (Low, Medium, High, Critical).
Preview render from the Plotly implementation.