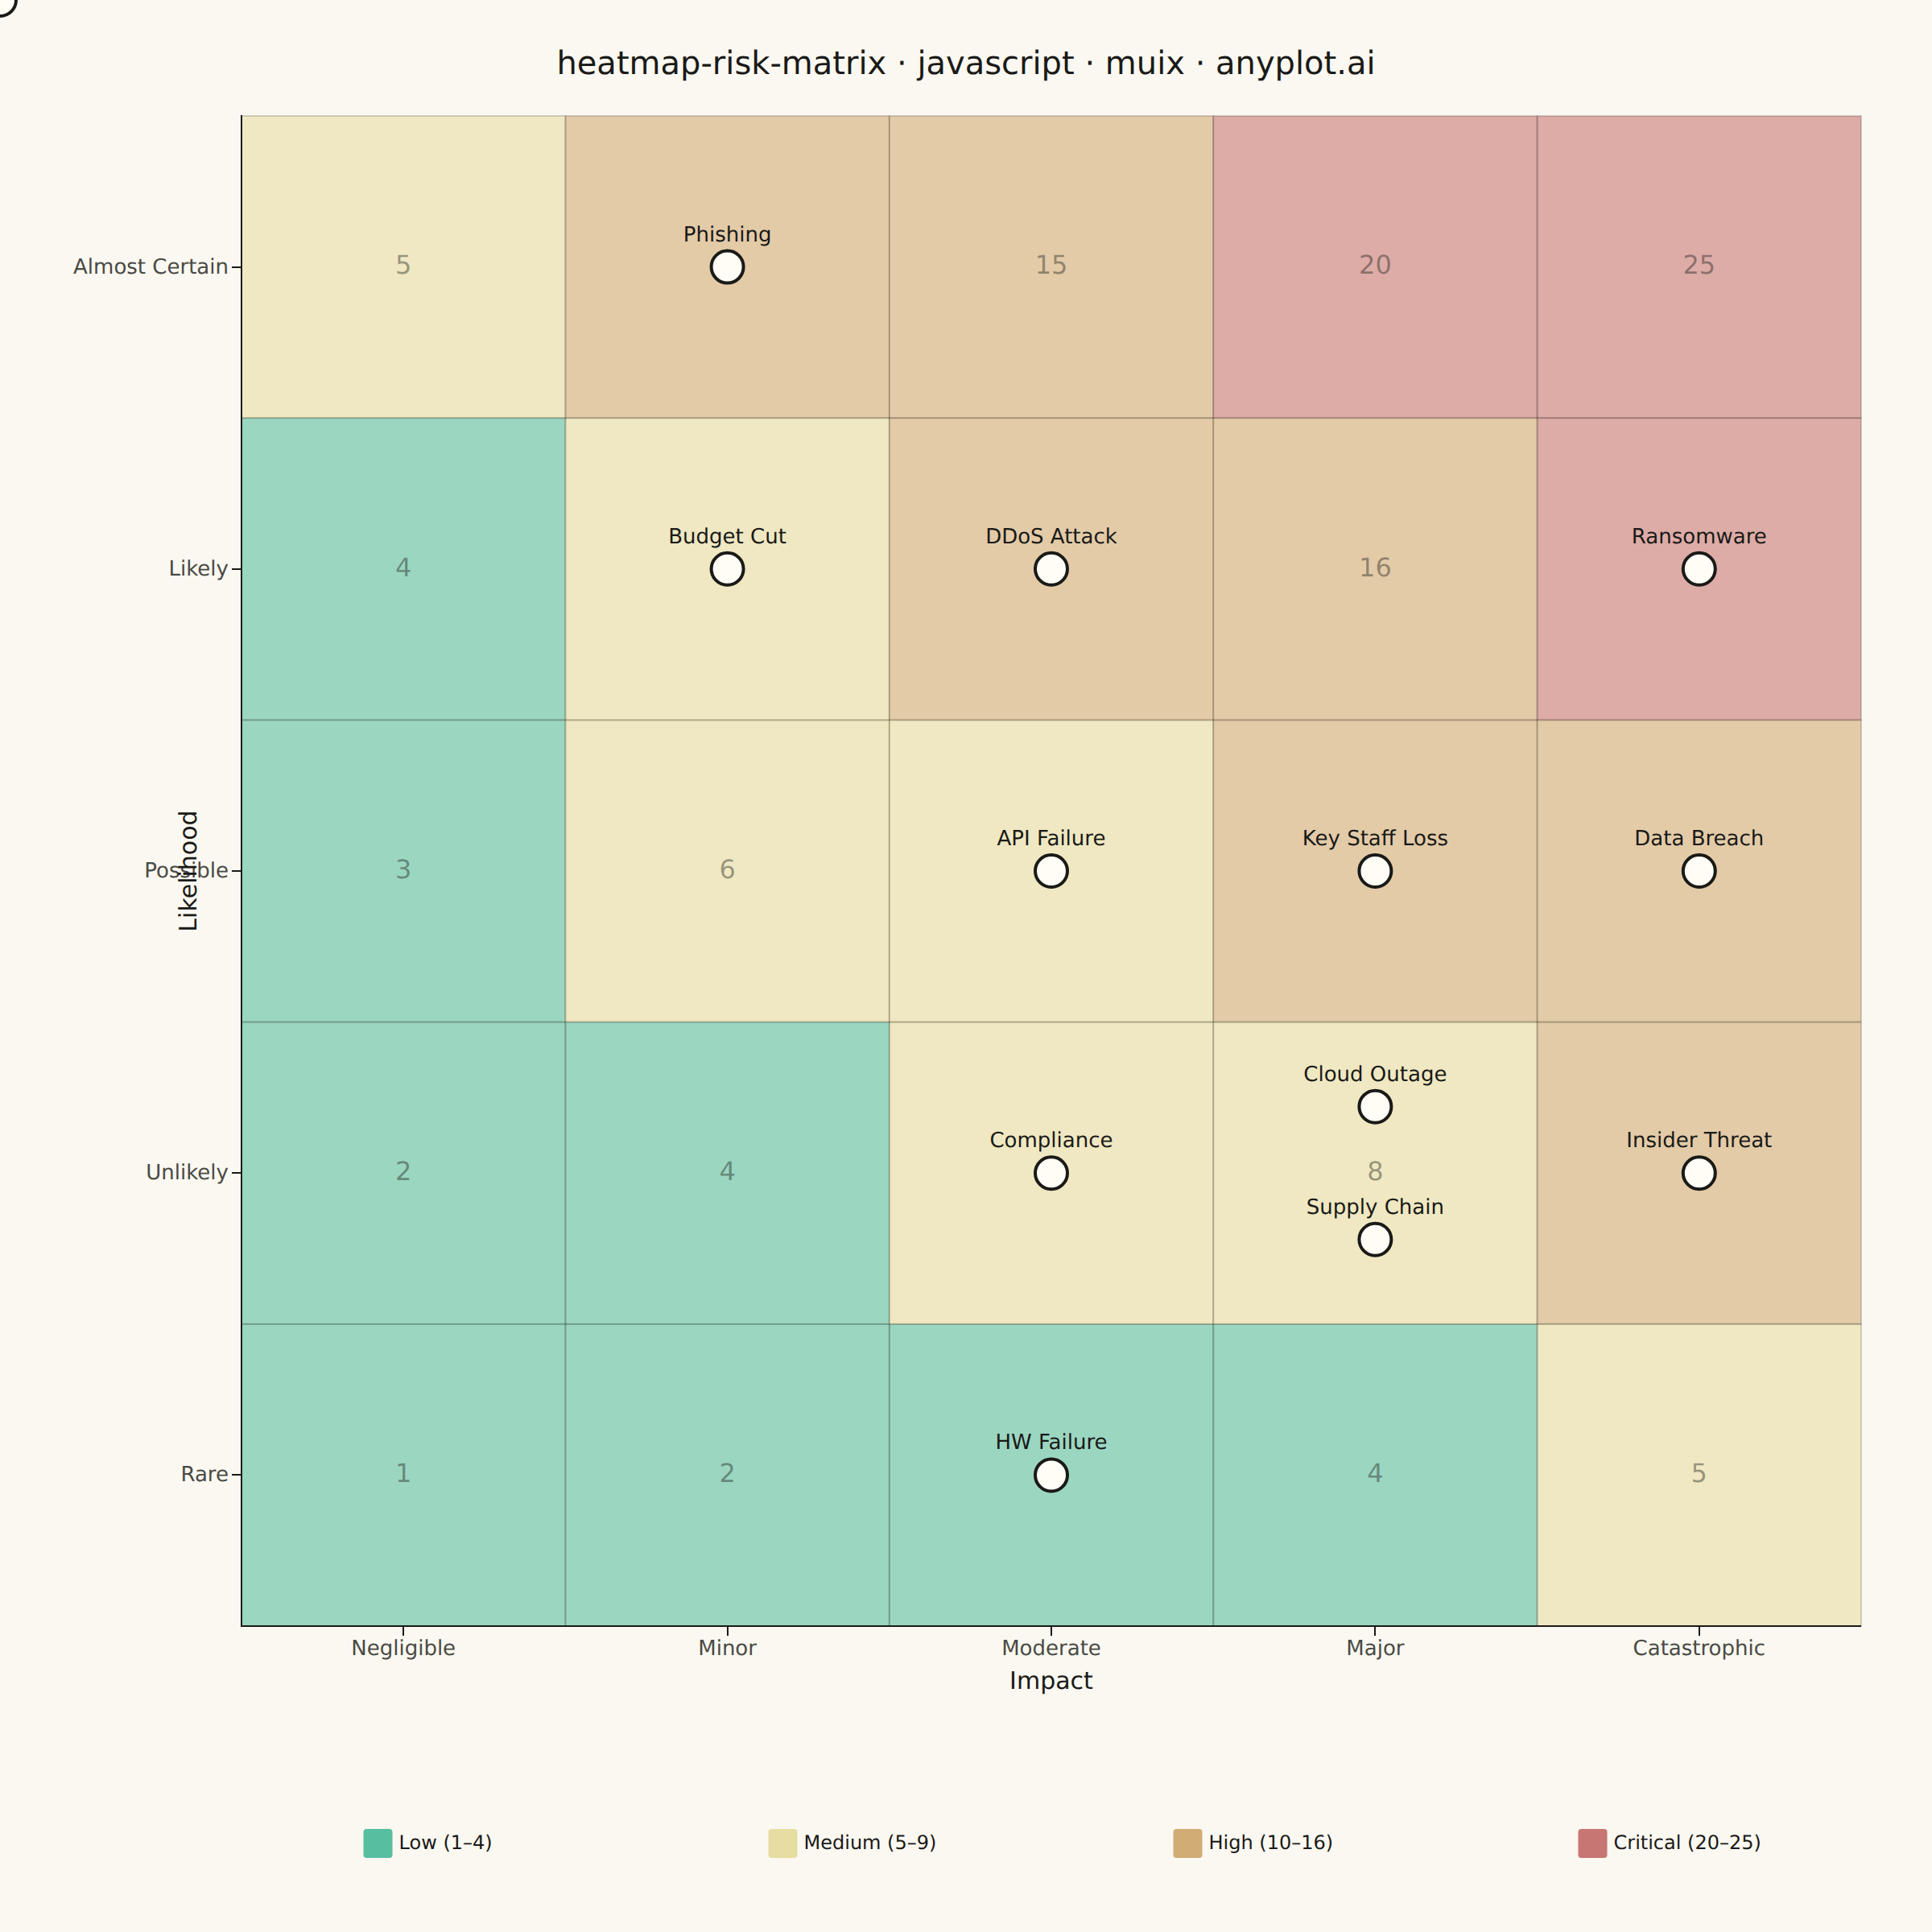
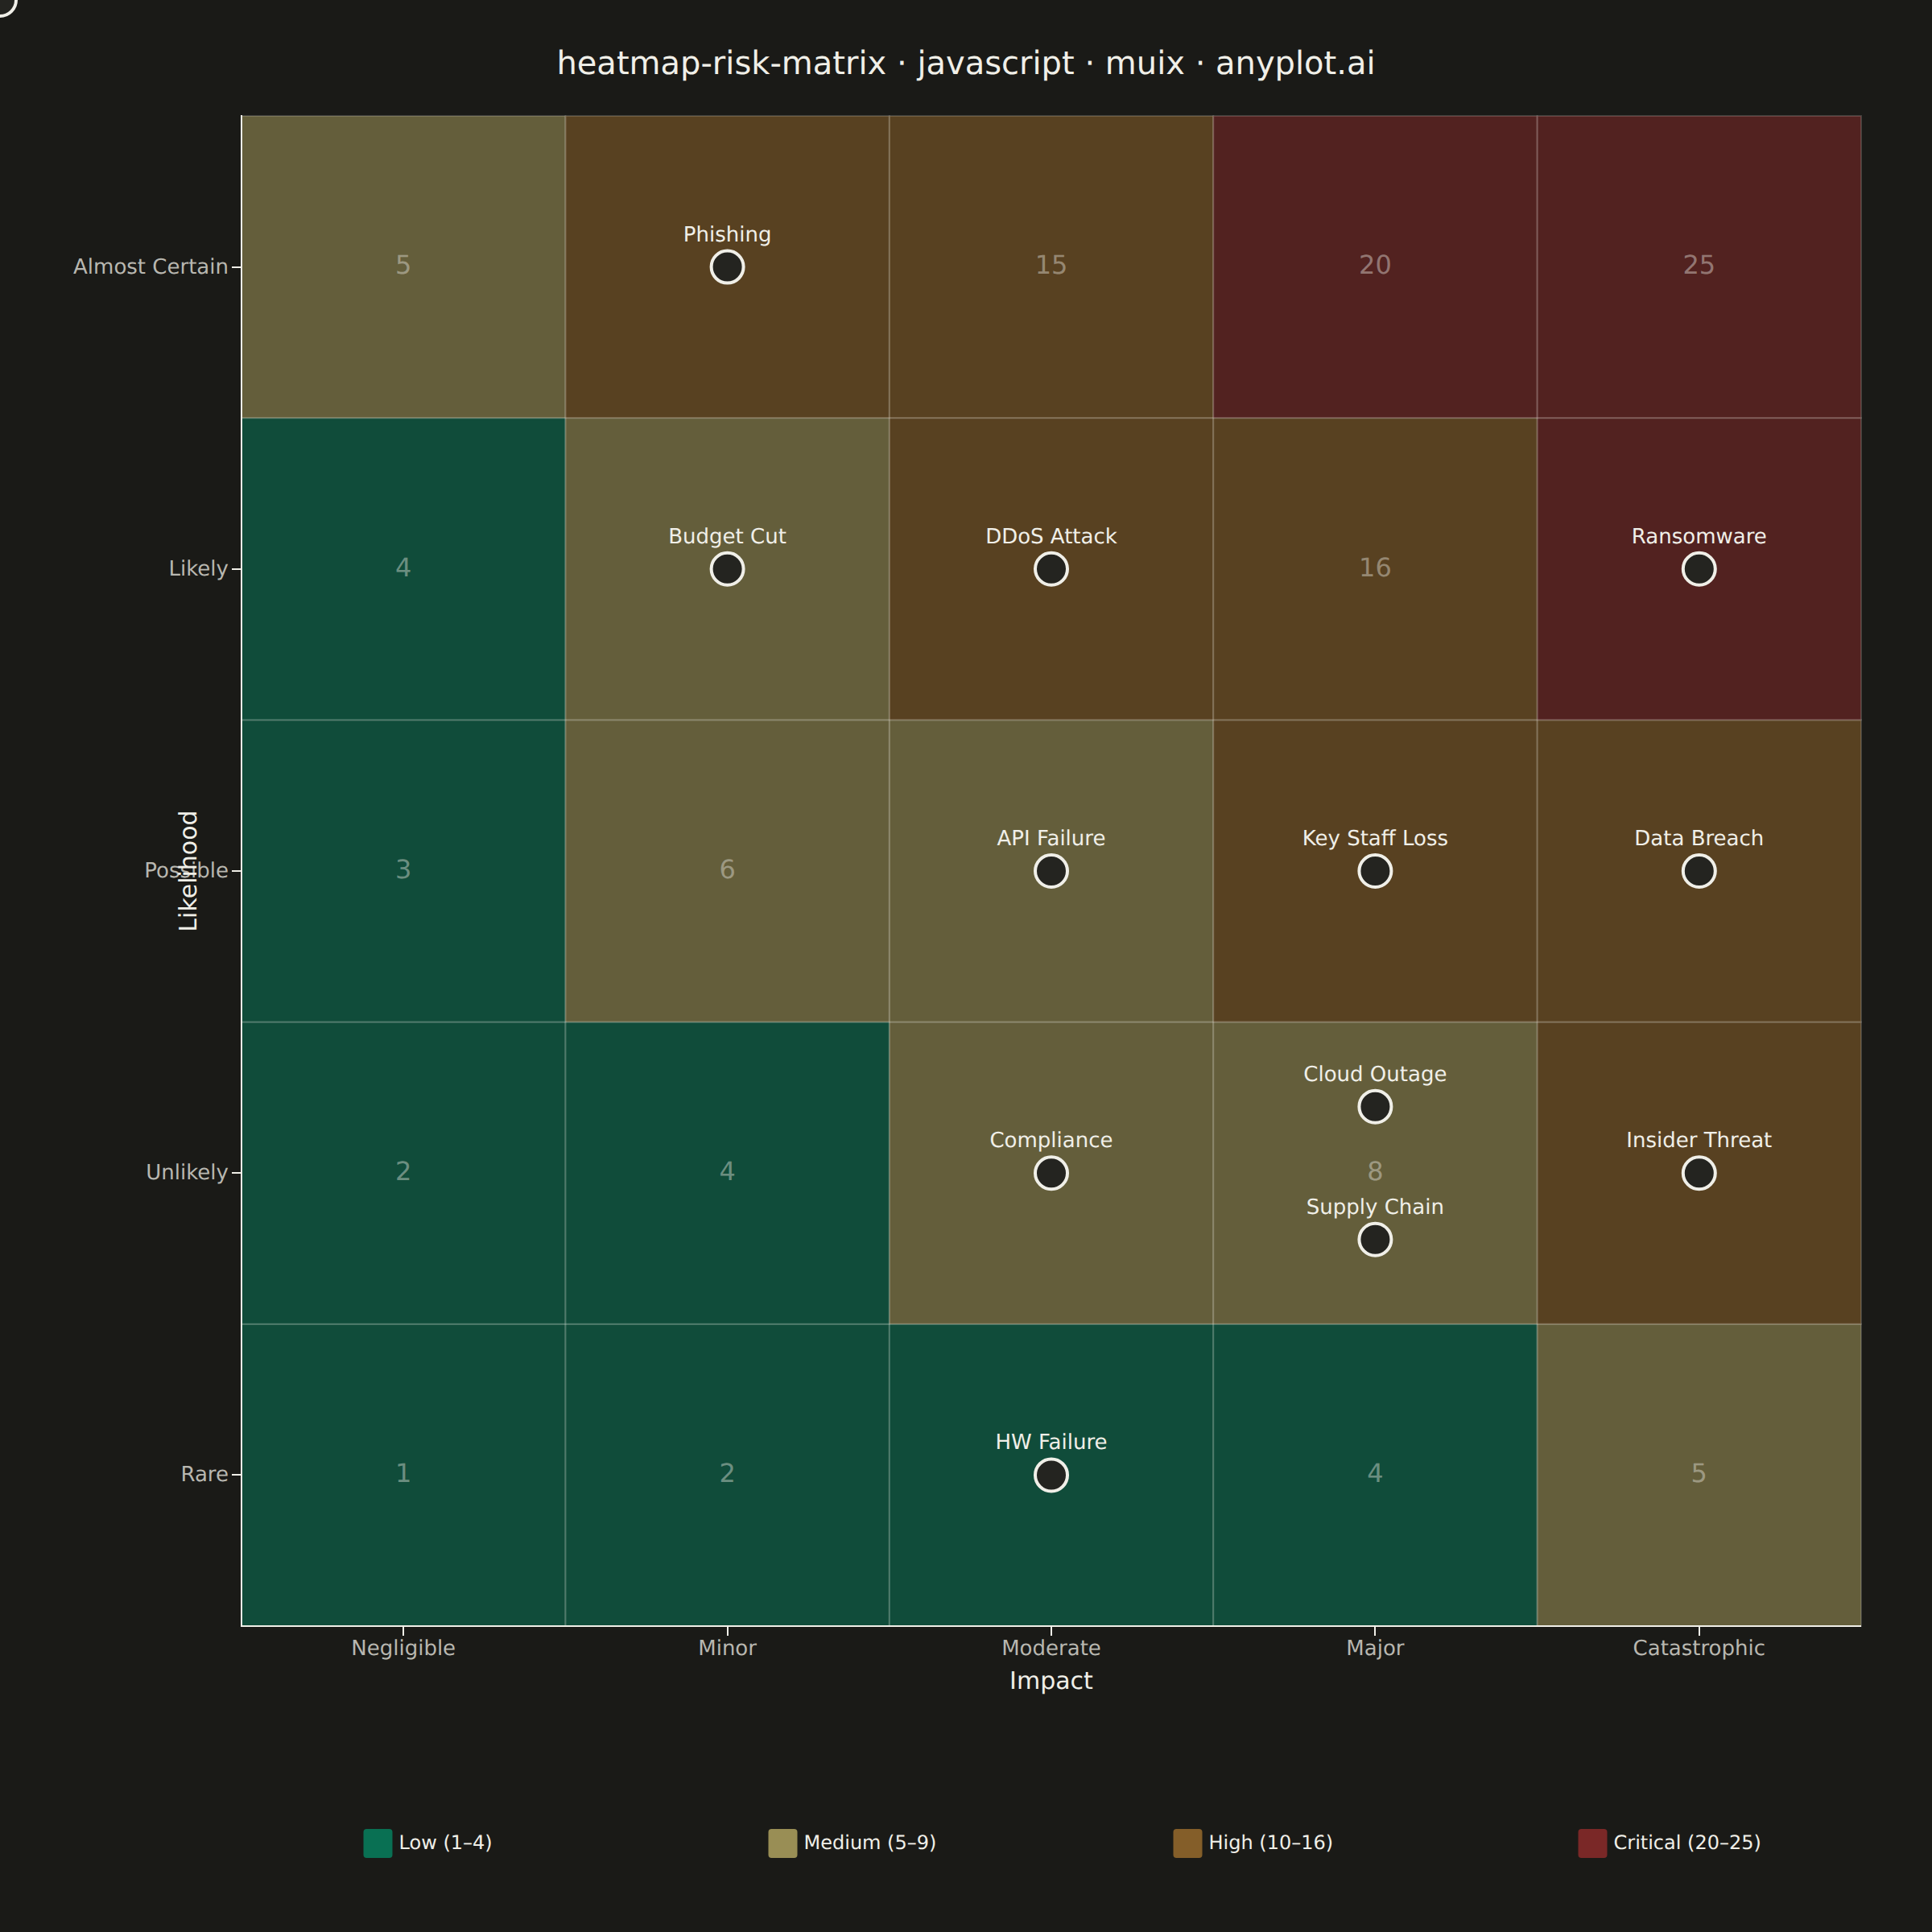
A 5x5 grid heatmap plotting risk likelihood against consequence severity, used to visualize and prioritize risks in project and enterprise risk management. Cells are color-coded from green (low risk) through yellow and orange to red (critical risk), with individual risk items plotted as labeled markers. The risk score for each cell is the product of likelihood and impact, and zones are labeled to indicate risk severity levels (Low, Medium, High, Critical).
// anyplot.ai
// heatmap-risk-matrix: Risk Assessment Matrix (Probability vs Impact)
// Library: muix 7.29.1 | JavaScript 22.22.3
// Quality: 88/100 | Created: 2026-06-20
//# anyplot-orientation: square
// anyplot.ai
// heatmap-risk-matrix: Risk Assessment Matrix (Probability vs Impact)
// Library: MUI X Charts | React | Node 22
// License: @mui/x-charts — MIT (community). Pro/Premium are out of scope.
// Quality: pending | Created: 2026-06-20

import { ChartContainer } from "@mui/x-charts/ChartContainer";
import { ScatterPlot } from "@mui/x-charts/ScatterChart";
import { ChartsXAxis } from "@mui/x-charts/ChartsXAxis";
import { ChartsYAxis } from "@mui/x-charts/ChartsYAxis";
import { useDrawingArea } from "@mui/x-charts/hooks";

const t = window.ANYPLOT_TOKENS;
const FONT = "system-ui, -apple-system, sans-serif";
const TITLE = "heatmap-risk-matrix · javascript · muix · anyplot.ai";

const LIKELIHOOD_LABELS = ["Rare", "Unlikely", "Possible", "Likely", "Almost Certain"];
const IMPACT_LABELS = ["Negligible", "Minor", "Moderate", "Major", "Catastrophic"];

const ZONE_LEGEND = [
  { label: "Low (1–4)",        color: "#009E73" },
  { label: "Medium (5–9)",     color: "#DDCC77" },
  { label: "High (10–16)",     color: "#BD8233" },
  { label: "Critical (20–25)", color: "#AE3030" },
];

// IT security risk register — 12 items across the 5×5 matrix
const risks = [
  { name: "Data Breach",    likelihood: 3, impact: 5 },
  { name: "Ransomware",     likelihood: 4, impact: 5 },
  { name: "DDoS Attack",    likelihood: 4, impact: 3 },
  { name: "Supply Chain",   likelihood: 2, impact: 4 },
  { name: "Insider Threat", likelihood: 2, impact: 5 },
  { name: "API Failure",    likelihood: 3, impact: 3 },
  { name: "Key Staff Loss", likelihood: 3, impact: 4 },
  { name: "Budget Cut",     likelihood: 4, impact: 2 },
  { name: "Compliance",     likelihood: 2, impact: 3 },
  { name: "Cloud Outage",   likelihood: 2, impact: 4 },
  { name: "Phishing",       likelihood: 5, impact: 2 },
  { name: "HW Failure",     likelihood: 1, impact: 3 },
];

function zoneColor(lh, imp) {
  const score = lh * imp;
  if (score <= 4)  return "#009E73"; // Low  — Imprint brand green
  if (score <= 9)  return "#DDCC77"; // Medium — Imprint amber
  if (score <= 16) return "#BD8233"; // High — Imprint ochre
  return "#AE3030";                  // Critical — Imprint matte red
}

// Jitter: count co-occupants per cell, assign circular offset
const _cnt = {};
risks.forEach(r => { const k = `${r.likelihood}-${r.impact}`; _cnt[k] = (_cnt[k] ?? 0) + 1; });
const _itr = {};
const risksPlaced = risks.map(r => {
  const k = `${r.likelihood}-${r.impact}`;
  const idx = _itr[k] ?? 0;
  _itr[k] = idx + 1;
  const siblings = _cnt[k];
  if (siblings === 1) return { ...r, jx: r.impact, jy: r.likelihood };
  const angle = (2 * Math.PI * idx) / siblings - Math.PI / 2;
  return { ...r, jx: r.impact + 0.22 * Math.cos(angle), jy: r.likelihood + 0.22 * Math.sin(angle) };
});

// Scatter series data — x=impact, y=likelihood
const scatterData = risksPlaced.map((r, i) => ({ id: i, x: r.jx, y: r.jy }));

// Custom scatter mark component used both as a slot and as a direct overlay
function RiskMark({ x, y, markerSize }) {
  return (
    <circle cx={x} cy={y} r={markerSize ?? 10}
      fill={t.elevatedBg} stroke={t.ink} strokeWidth={2} />
  );
}

// Direct circle overlay via useDrawingArea — ensures correct positioning even when
// ScatterPlot slots are not forwarded (MUI X v7 ScatterPlot may not support slots directly)
function RiskCircles() {
  const { left, top, width, height } = useDrawingArea();
  const toSvg = (dx, dy) => ({
    sx: left + (dx - 0.5) / 5 * width,
    sy: top  + (5.5 - dy) / 5 * height,
  });
  return (
    <g>
      {risksPlaced.map((r, i) => {
        const { sx, sy } = toSvg(r.jx, r.jy);
        return (
          <circle key={i} cx={sx} cy={sy} r={10}
            fill={t.elevatedBg} stroke={t.ink} strokeWidth={2} />
        );
      })}
    </g>
  );
}

// Zone background + risk-score numbers — uses MUI X useDrawingArea hook for positioning
function ZoneBackground() {
  const { left, top, width, height } = useDrawingArea();
  const cW = width / 5;
  const cH = height / 5;
  const items = [];
  for (let lh = 1; lh <= 5; lh++) {
    for (let imp = 1; imp <= 5; imp++) {
      items.push(
        <rect key={`z${lh}${imp}`}
          x={left + (imp - 1) * cW} y={top + (5 - lh) * cH}
          width={cW} height={cH}
          fill={zoneColor(lh, imp)} fillOpacity={0.38}
          stroke={t.ink} strokeOpacity={0.18} strokeWidth={1} />,
        <text key={`n${lh}${imp}`}
          x={left + (imp - 0.5) * cW} y={top + (5.5 - lh) * cH}
          textAnchor="middle" dominantBaseline="middle"
          fontSize={16} fill={t.ink} fillOpacity={0.42} fontFamily={FONT}>
          {lh * imp}
        </text>
      );
    }
  }
  return <g>{items}</g>;
}

// Risk name labels — uses useDrawingArea to map data coords → SVG coords
function RiskLabels() {
  const { left, top, width, height } = useDrawingArea();
  const toSvg = (dx, dy) => ({
    sx: left + (dx - 0.5) / 5 * width,
    sy: top  + (5.5 - dy) / 5 * height,
  });
  return (
    <g>
      {risksPlaced.map((r, i) => {
        const { sx, sy } = toSvg(r.jx, r.jy);
        return (
          <text key={i} x={sx} y={sy - 16}
            textAnchor="middle" fontSize={13} fontWeight="500"
            fill={t.ink} fontFamily={FONT}>
            {r.name}
          </text>
        );
      })}
    </g>
  );
}

// Zone legend rendered as SVG elements below the chart area
function ZoneLegend({ W, H, ML, MR }) {
  const colW = (W - ML - MR) / 4;
  const ly = H - 55;
  return (
    <g>
      {ZONE_LEGEND.map((z, i) => {
        const lx = ML + colW * i + colW / 2 - 50;
        return (
          <g key={i}>
            <rect x={lx} y={ly - 9} width={18} height={18}
              fill={z.color} fillOpacity={0.65} rx={2} />
            <text x={lx + 22} y={ly} dominantBaseline="middle"
              fontSize={12} fill={t.ink} fontFamily={FONT}>
              {z.label}
            </text>
          </g>
        );
      })}
    </g>
  );
}

export default function Chart() {
  const W = window.ANYPLOT_SIZE.width;   // 1200 CSS px (square)
  const H = window.ANYPLOT_SIZE.height;  // 1200 CSS px (square)
  const margin = { left: 150, top: 72, right: 44, bottom: 190 };

  return (
    <ChartContainer
      width={W}
      height={H}
      margin={margin}
      series={[{
        type: "scatter",
        id: "risks",
        data: scatterData,
        color: t.ink,
        markerSize: 10,
      }]}
      xAxis={[{
        min: 0.5, max: 5.5,
        tickInterval: [1, 2, 3, 4, 5],
        valueFormatter: (v) => IMPACT_LABELS[Math.round(v) - 1] ?? "",
      }]}
      yAxis={[{
        min: 0.5, max: 5.5,
        tickInterval: [1, 2, 3, 4, 5],
        valueFormatter: (v) => LIKELIHOOD_LABELS[Math.round(v) - 1] ?? "",
      }]}
    >
      {/* Chart title */}
      <text x={W / 2} y={46}
        textAnchor="middle" fontSize={20} fontWeight="500"
        fill={t.ink} fontFamily={FONT}>
        {TITLE}
      </text>

      {/* Zone cells + score labels (behind markers) */}
      <ZoneBackground />

      {/* MUI X scatter plot (provides axis-aware series rendering) */}
      <ScatterPlot slots={{ scatter: RiskMark }} />

      {/* Direct circle overlay: styled markers with elevated-bg fill + ink stroke */}
      <RiskCircles />

      {/* Risk item name labels (above markers) */}
      <RiskLabels />

      {/* MUI X axis components */}
      <ChartsXAxis
        label="Impact"
        tickLabelStyle={{ fontSize: 13, fill: t.inkSoft, fontFamily: FONT }}
        labelStyle={{ fontSize: 15, fontWeight: "500", fill: t.ink, fontFamily: FONT }}
      />
      <ChartsYAxis
        label="Likelihood"
        tickLabelStyle={{ fontSize: 13, fill: t.inkSoft, fontFamily: FONT }}
        labelStyle={{ fontSize: 15, fontWeight: "500", fill: t.ink, fontFamily: FONT }}
      />

      {/* Zone legend */}
      <ZoneLegend W={W} H={H} ML={margin.left} MR={margin.right} />
    </ChartContainer>
  );
}
Runnable source as JSON, for any HTTP client: https://api.anyplot.ai/specs/heatmap-risk-matrix/muix/code. Any spec id and library id listed in llms-full.txt fit the same URL shape; every URL below is complete and callable.
{
  "spec_id": "heatmap-risk-matrix",
  "language": "javascript",
  "library": "muix",
  "page": "https://anyplot.ai/heatmap-risk-matrix/javascript/muix",
  "hub": "https://anyplot.ai/heatmap-risk-matrix",
  "code_json": "https://api.anyplot.ai/specs/heatmap-risk-matrix/muix/code",
  "spec_json": "https://api.anyplot.ai/specs/heatmap-risk-matrix",
  "render_light_png": "https://storage.googleapis.com/anyplot-images/plots/heatmap-risk-matrix/javascript/muix/plot-light.png",
  "render_dark_png": "https://storage.googleapis.com/anyplot-images/plots/heatmap-risk-matrix/javascript/muix/plot-dark.png",
  "interactive_light_html": "https://storage.googleapis.com/anyplot-images/plots/heatmap-risk-matrix/javascript/muix/plot-light.html",
  "interactive_dark_html": "https://storage.googleapis.com/anyplot-images/plots/heatmap-risk-matrix/javascript/muix/plot-dark.html",
  "quality_score": 88.0,
  "license": "MIT",
  "guide": "https://anyplot.ai/llms.txt"
}
Part of Risk Assessment Matrix (Probability vs Impact) on anyplot.ai.