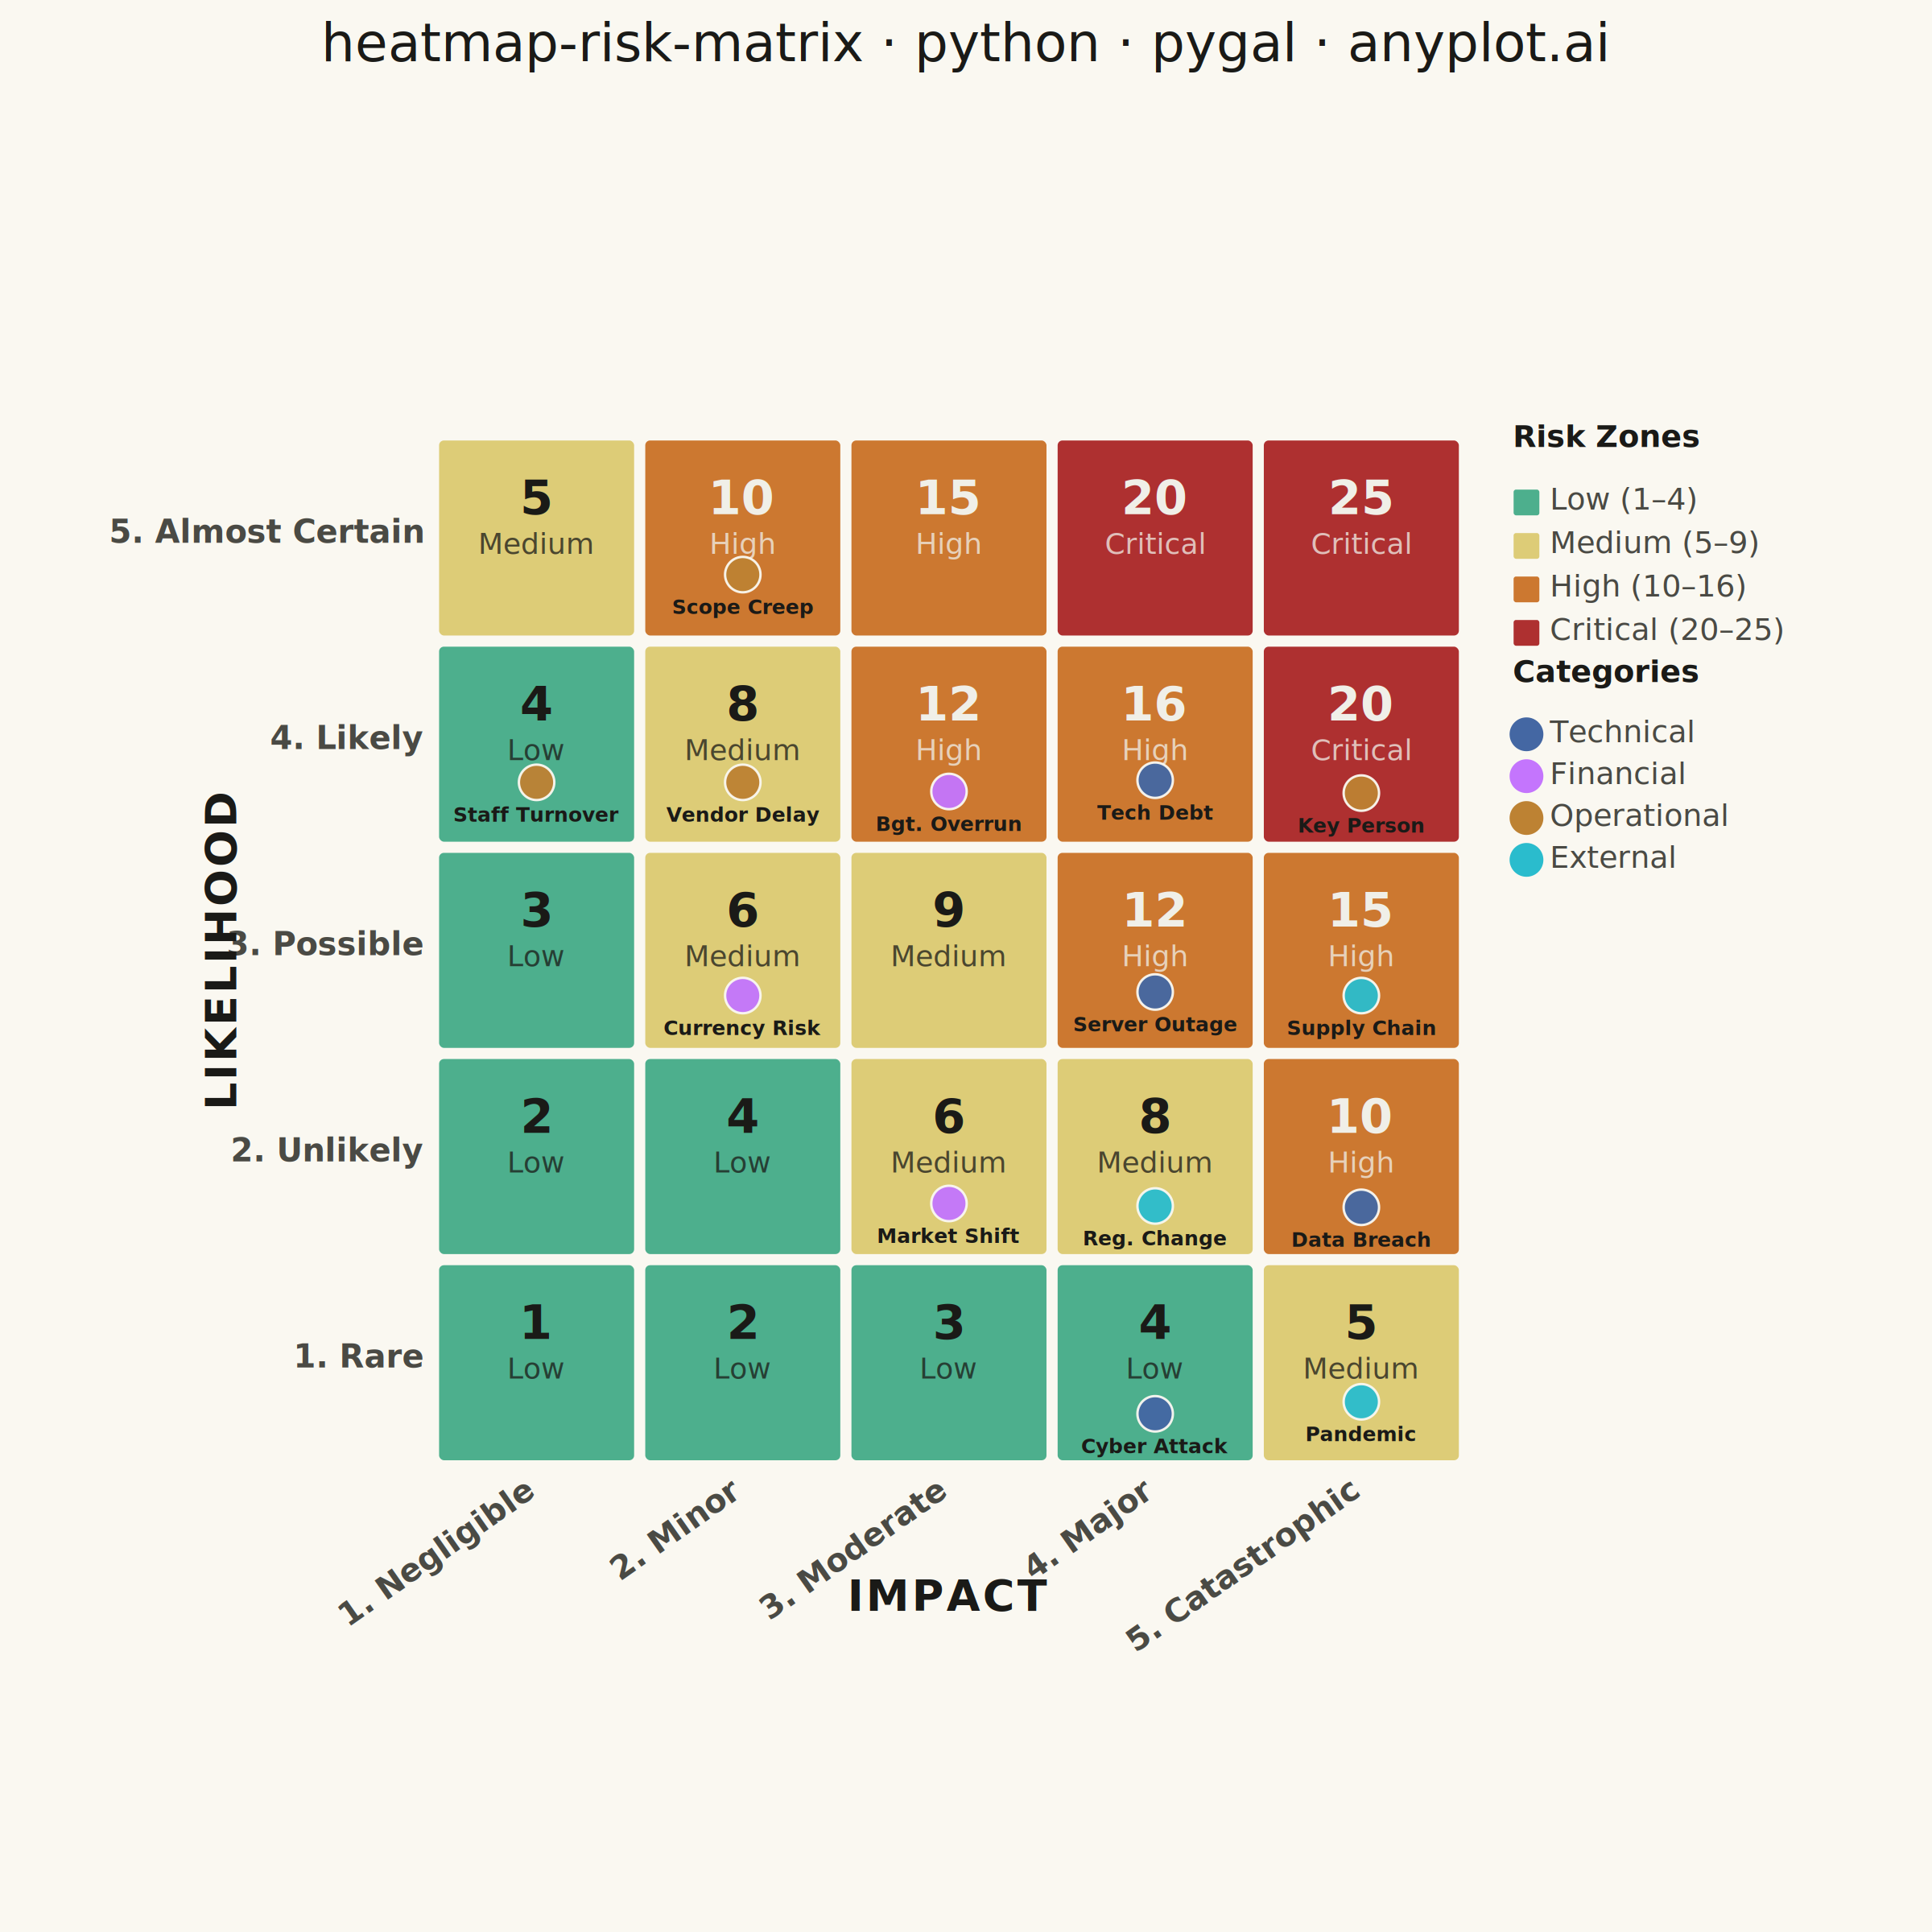
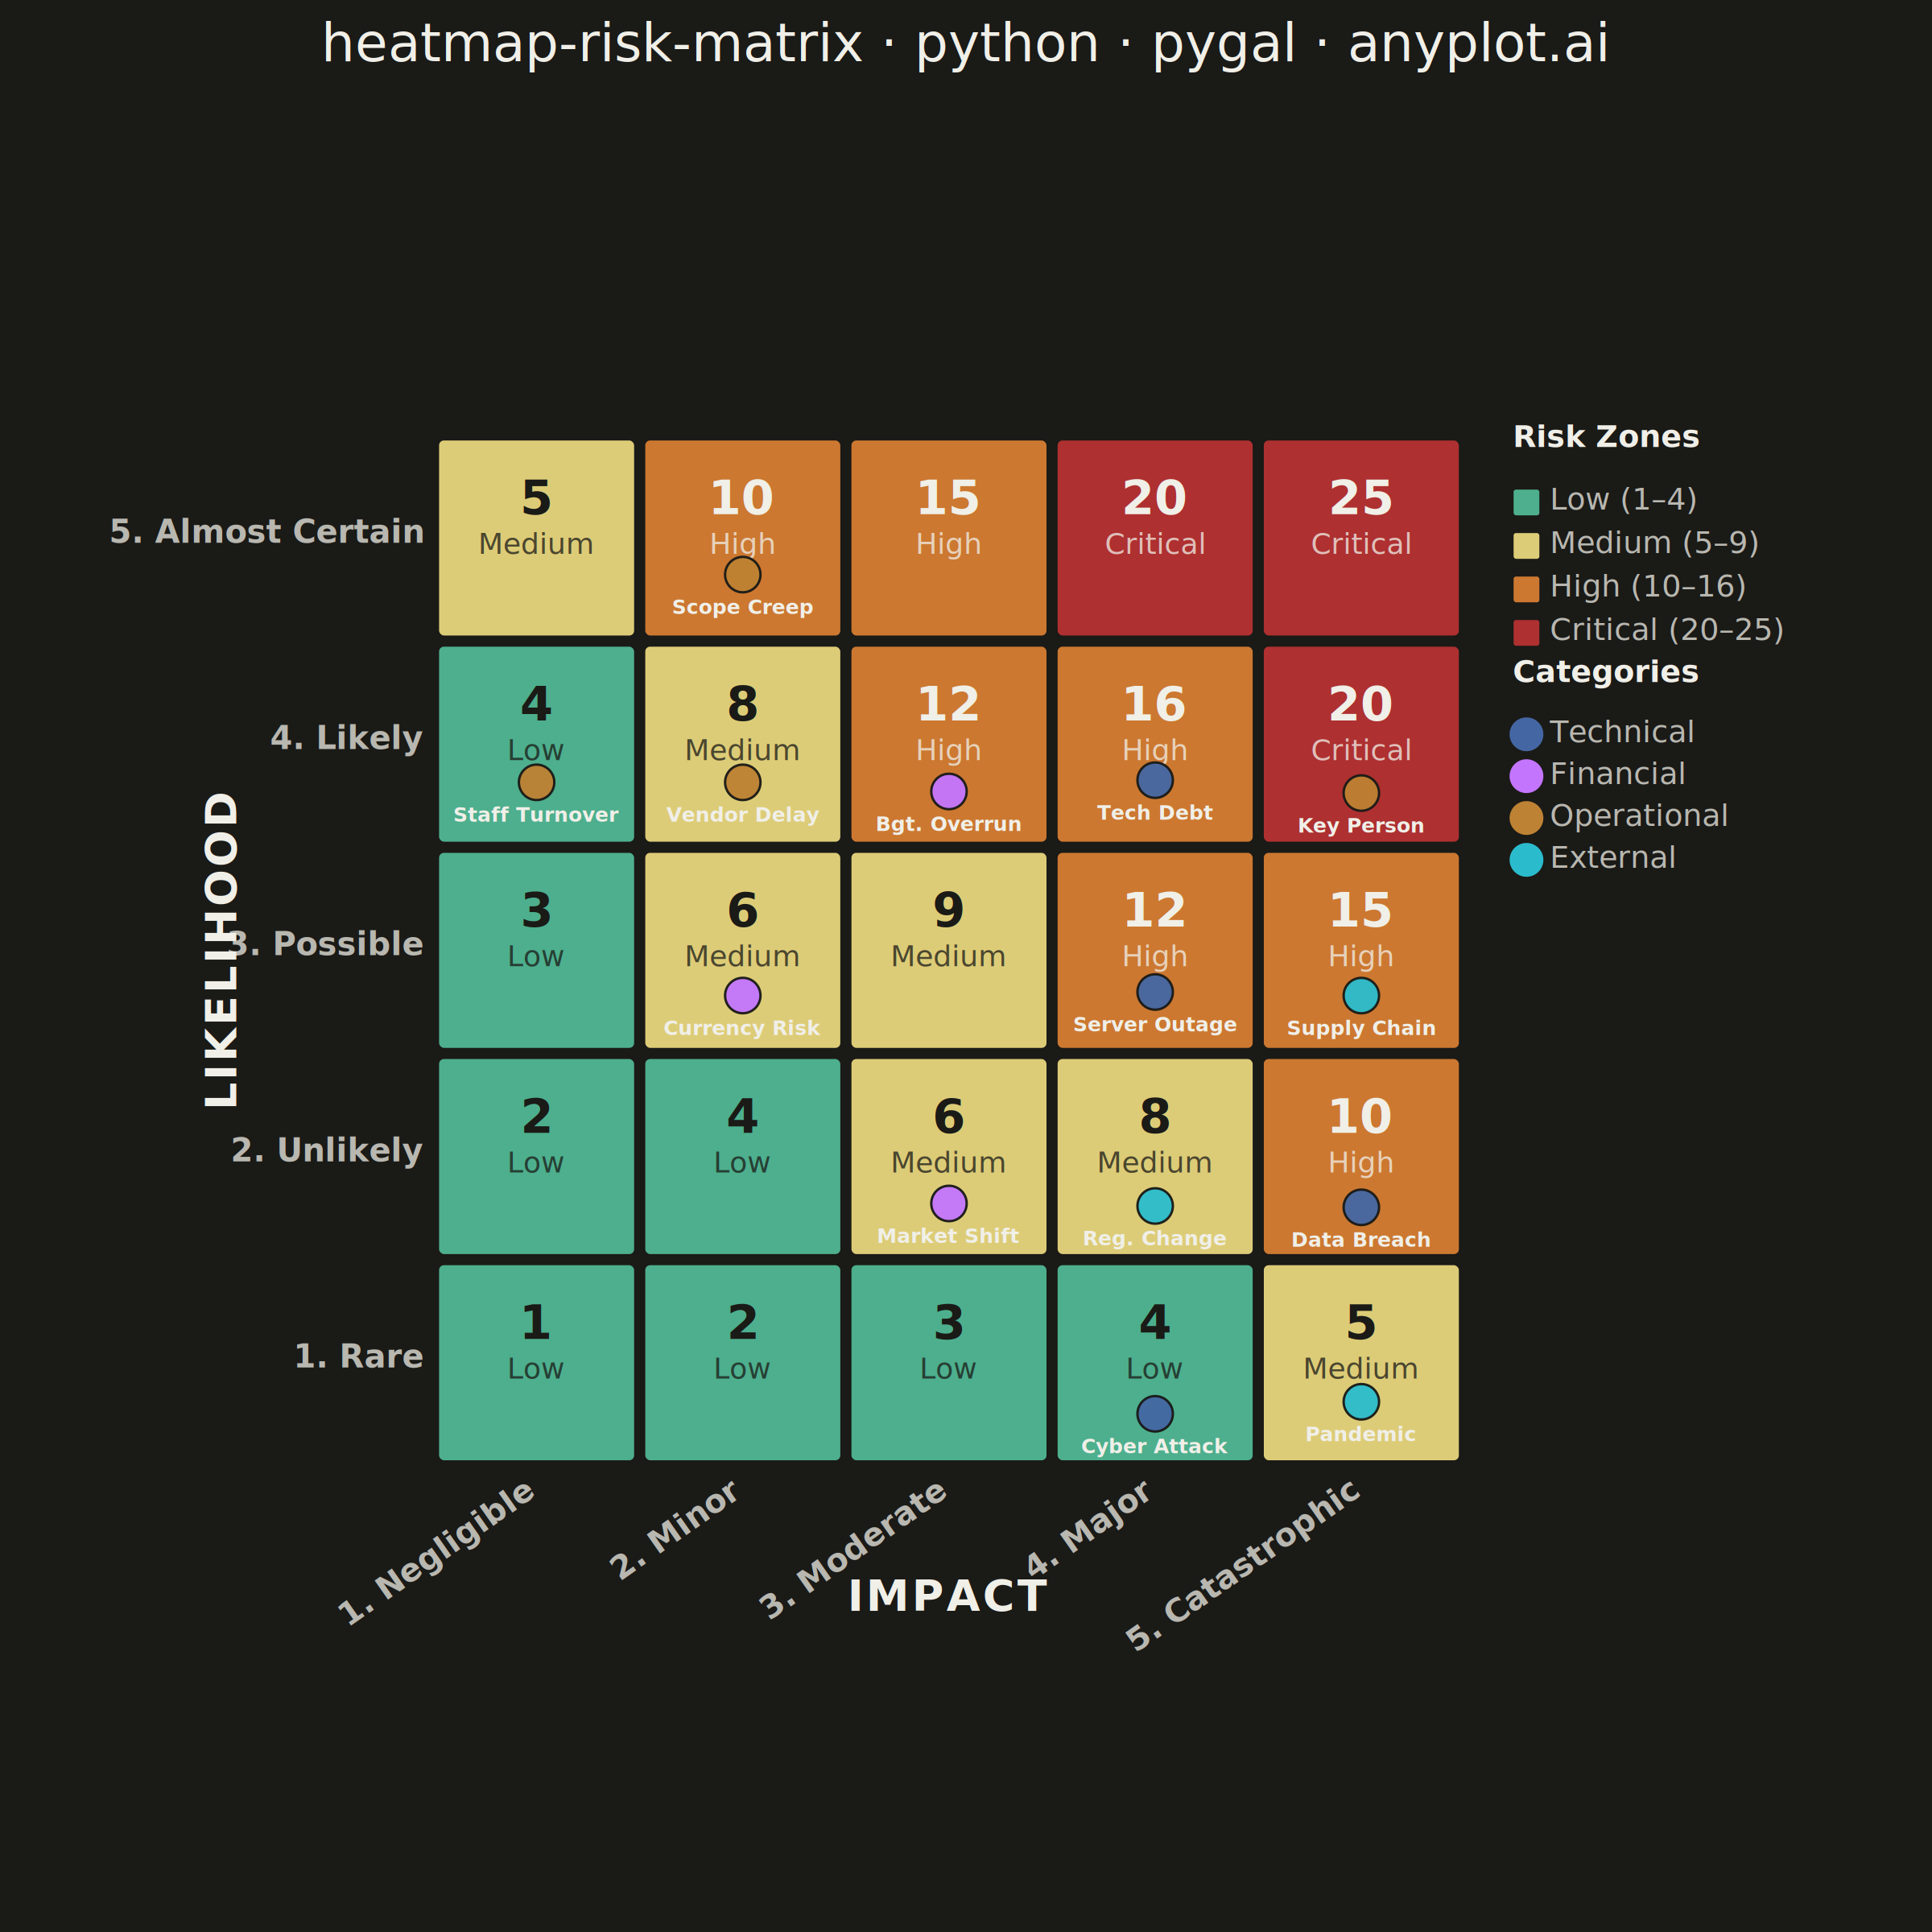
A 5x5 grid heatmap plotting risk likelihood against consequence severity, used to visualize and prioritize risks in project and enterprise risk management. Cells are color-coded from green (low risk) through yellow and orange to red (critical risk), with individual risk items plotted as labeled markers. The risk score for each cell is the product of likelihood and impact, and zones are labeled to indicate risk severity levels (Low, Medium, High, Critical).
""" anyplot.ai
heatmap-risk-matrix: Risk Assessment Matrix (Probability vs Impact)
Library: pygal 3.1.3 | Python 3.13.14
Quality: 84/100 | Updated: 2026-06-20
"""

import importlib
import os
import sys

import numpy as np


# Remove this script's directory so 'pygal' resolves to the installed package, not this file
_script_dir = os.path.dirname(os.path.abspath(__file__))
sys.path = [p for p in sys.path if os.path.abspath(p) != _script_dir]
Graph = importlib.import_module("pygal.graph.graph").Graph
Style = importlib.import_module("pygal.style").Style

# Theme tokens
THEME = os.getenv("ANYPLOT_THEME", "light")
PAGE_BG = "#FAF8F1" if THEME == "light" else "#1A1A17"
INK = "#1A1A17" if THEME == "light" else "#F0EFE8"
INK_SOFT = "#4A4A44" if THEME == "light" else "#B8B7B0"
INK_MUTED = "#6B6A63" if THEME == "light" else "#A8A79F"

# Imprint categorical palette — 8 hues in hybrid-v3 sort order
IMPRINT_PALETTE = ("#009E73", "#C475FD", "#4467A3", "#BD8233", "#AE3030", "#2ABCCD", "#954477", "#99B314")

# Zone colors: Imprint-aligned semantic gradient (green → amber → orange → red)
LOW_COLOR = "#4DAF8D"
MED_COLOR = "#DDCC77"
HIGH_COLOR = "#CC7830"
CRIT_COLOR = "#AE3030"
ZONE_COLORS = [(4, LOW_COLOR), (9, MED_COLOR), (16, HIGH_COLOR), (25, CRIT_COLOR)]

# Category colors — Imprint palette positions, avoiding green to prevent clash with Low zone
CAT_COLORS = {"Technical": "#4467A3", "Financial": "#C475FD", "Operational": "#BD8233", "External": "#2ABCCD"}

# Data
likelihood_labels = ["Rare", "Unlikely", "Possible", "Likely", "Almost Certain"]
impact_labels = ["Negligible", "Minor", "Moderate", "Major", "Catastrophic"]

risk_scores = [[li * im for im in range(1, 6)] for li in range(1, 6)]

risk_items = [
    {"name": "Server Outage", "likelihood": 3, "impact": 4, "category": "Technical", "color": CAT_COLORS["Technical"]},
    {"name": "Data Breach", "likelihood": 2, "impact": 5, "category": "Technical", "color": CAT_COLORS["Technical"]},
    {"name": "Bgt. Overrun", "likelihood": 4, "impact": 3, "category": "Financial", "color": CAT_COLORS["Financial"]},
    {"name": "Currency Risk", "likelihood": 3, "impact": 2, "category": "Financial", "color": CAT_COLORS["Financial"]},
    {
        "name": "Vendor Delay",
        "likelihood": 4,
        "impact": 2,
        "category": "Operational",
        "color": CAT_COLORS["Operational"],
    },
    {
        "name": "Staff Turnover",
        "likelihood": 4,
        "impact": 1,
        "category": "Operational",
        "color": CAT_COLORS["Operational"],
    },
    {
        "name": "Scope Creep",
        "likelihood": 5,
        "impact": 2,
        "category": "Operational",
        "color": CAT_COLORS["Operational"],
    },
    {"name": "Reg. Change", "likelihood": 2, "impact": 4, "category": "External", "color": CAT_COLORS["External"]},
    {"name": "Supply Chain", "likelihood": 3, "impact": 5, "category": "External", "color": CAT_COLORS["External"]},
    {"name": "Market Shift", "likelihood": 2, "impact": 3, "category": "Financial", "color": CAT_COLORS["Financial"]},
    {"name": "Tech Debt", "likelihood": 4, "impact": 4, "category": "Technical", "color": CAT_COLORS["Technical"]},
    {"name": "Cyber Attack", "likelihood": 1, "impact": 4, "category": "Technical", "color": CAT_COLORS["Technical"]},
    {"name": "Key Person", "likelihood": 4, "impact": 5, "category": "Operational", "color": CAT_COLORS["Operational"]},
    {"name": "Pandemic", "likelihood": 1, "impact": 5, "category": "External", "color": CAT_COLORS["External"]},
]


class RiskMatrixHeatmap(Graph):
    _series_margin = 0

    def _plot(self):
        n_rows = len(likelihood_labels)
        n_cols = len(impact_labels)

        plot_width = self.view.width
        plot_height = self.view.height

        margin_left = 420
        margin_bottom = 210
        margin_top = 20
        margin_right = 550

        avail_w = plot_width - margin_left - margin_right
        avail_h = plot_height - margin_bottom - margin_top

        cell_size = min(avail_w / n_cols, avail_h / n_rows) * 0.94
        gap = cell_size * 0.04

        grid_w = n_cols * (cell_size + gap) - gap
        grid_h = n_rows * (cell_size + gap) - gap

        x0 = self.view.x(0) + margin_left + (avail_w - grid_w) / 2
        y0 = self.view.y(n_rows) + margin_top + (avail_h - grid_h) / 2

        plot_node = self.nodes["plot"]
        group = self.svg.node(plot_node, class_="risk-matrix")

        score_font = int(cell_size * 0.24)
        zone_font = int(cell_size * 0.15)
        marker_font = int(cell_size * 0.105)
        marker_r = int(cell_size * 0.09)
        label_font = int(cell_size * 0.165)
        title_font = int(cell_size * 0.22)
        legend_font = int(cell_size * 0.155)
        legend_box = int(cell_size * 0.14)

        # --- Draw cells ---
        for i in range(n_rows):
            for j in range(n_cols):
                row_idx = n_rows - 1 - i
                score = risk_scores[row_idx][j]
                color = next((c for s, c in ZONE_COLORS if score <= s), ZONE_COLORS[-1][1])
                r, g, b = int(color[1:3], 16), int(color[3:5], 16), int(color[5:7], 16)
                tc = "#1A1A17" if (r * 299 + g * 587 + b * 114) / 1000 > 140 else "#F0EFE8"
                zone_label = "Low" if score <= 4 else "Medium" if score <= 9 else "High" if score <= 16 else "Critical"

                x = x0 + j * (cell_size + gap)
                y = y0 + i * (cell_size + gap)

                cell_group = self.svg.node(group, "g", class_="cell")
                rect = self.svg.node(cell_group, "rect", x=x, y=y, width=cell_size, height=cell_size, rx=8, ry=8)
                rect.set("fill", color)
                rect.set("stroke", PAGE_BG)
                rect.set("stroke-width", "4")

                title_el = self.svg.node(cell_group, "title")
                title_el.text = f"Risk Score: {score} ({zone_label})"

                txt = self.svg.node(cell_group, "text", x=x + cell_size / 2, y=y + cell_size * 0.38)
                txt.set("text-anchor", "middle")
                txt.set("fill", tc)
                txt.set("style", f"font-size:{score_font}px;font-weight:bold;font-family:sans-serif")
                txt.text = str(score)

                zt = self.svg.node(cell_group, "text", x=x + cell_size / 2, y=y + cell_size * 0.58)
                zt.set("text-anchor", "middle")
                zt.set("fill", tc)
                zt.set("opacity", "0.75")
                zt.set("style", f"font-size:{zone_font}px;font-weight:500;font-family:sans-serif")
                zt.text = zone_label

        # --- Risk item markers ---
        np.random.seed(42)
        cell_items = {}
        for item in risk_items:
            key = (item["likelihood"], item["impact"])
            cell_items.setdefault(key, []).append(item)

        for (lik, imp), items in cell_items.items():
            col_idx = imp - 1
            row_display = n_rows - lik
            cell_x = x0 + col_idx * (cell_size + gap)
            cell_y = y0 + row_display * (cell_size + gap)
            n_items = len(items)

            for idx, item in enumerate(items):
                color = item.get("color", IMPRINT_PALETTE[2])

                if n_items == 1:
                    offset_x = 0
                else:
                    spread = cell_size * 0.48
                    offset_x = -spread / 2 + idx * spread / (n_items - 1)

                jitter_y = np.random.uniform(-cell_size * 0.04, cell_size * 0.04)

                cx = cell_x + cell_size / 2 + offset_x
                cy = cell_y + cell_size * 0.72 + jitter_y
                pad = marker_r + 8
                cx = max(cell_x + pad, min(cx, cell_x + cell_size - pad))
                cy = max(cell_y + pad, min(cy, cell_y + cell_size - pad))

                mg = self.svg.node(group, "g", class_="risk-marker")

                circle = self.svg.node(mg, "circle", cx=cx, cy=cy, r=marker_r)
                circle.set("fill", color)
                circle.set("stroke", PAGE_BG)
                circle.set("stroke-width", "3")
                circle.set("opacity", "0.95")

                label_y = cy + marker_r + marker_font + 2
                label_y = min(label_y, cell_y + cell_size - 5)

                lbl = self.svg.node(mg, "text", x=cx, y=label_y)
                lbl.set("text-anchor", "middle")
                lbl.set("fill", INK)
                lbl.set("stroke", PAGE_BG)
                lbl.set("stroke-width", "5")
                lbl.set("paint-order", "stroke fill")
                lbl.set("style", f"font-size:{marker_font}px;font-weight:700;font-family:sans-serif")
                lbl.text = item["name"]

                tip = self.svg.node(mg, "title")
                score = item["likelihood"] * item["impact"]
                tip.text = f"{item['name']} — L:{lik} × I:{imp} = {score}"

        # --- Y-axis labels ---
        for i in range(n_rows):
            row_idx = n_rows - 1 - i
            y = y0 + i * (cell_size + gap) + cell_size / 2

            num_node = self.svg.node(group, "text", x=x0 - 18, y=y + label_font * 0.15)
            num_node.set("text-anchor", "end")
            num_node.set("fill", INK_SOFT)
            num_node.set("style", f"font-size:{label_font}px;font-weight:600;font-family:sans-serif")
            num_node.text = f"{row_idx + 1}. {likelihood_labels[row_idx]}"

        # --- X-axis labels (rotated 35° for readability) ---
        for j in range(n_cols):
            x = x0 + j * (cell_size + gap) + cell_size / 2
            y = y0 + grid_h + 42

            num_node = self.svg.node(group, "text", x=x, y=y)
            num_node.set("text-anchor", "end")
            num_node.set("fill", INK_SOFT)
            num_node.set("style", f"font-size:{label_font}px;font-weight:600;font-family:sans-serif")
            num_node.set("transform", f"rotate(-35, {x}, {y})")
            num_node.text = f"{j + 1}. {impact_labels[j]}"

        # --- Axis titles ---
        mid_y = y0 + grid_h / 2
        yt = self.svg.node(group, "text", x=x0 - 250, y=mid_y)
        yt.set("text-anchor", "middle")
        yt.set("fill", INK)
        yt.set("style", f"font-size:{title_font}px;font-weight:bold;font-family:sans-serif;letter-spacing:3px")
        yt.set("transform", f"rotate(-90, {x0 - 250}, {mid_y})")
        yt.text = "LIKELIHOOD"

        mid_x = x0 + grid_w / 2
        xt = self.svg.node(group, "text", x=mid_x, y=y0 + grid_h + 185)
        xt.set("text-anchor", "middle")
        xt.set("fill", INK)
        xt.set("style", f"font-size:{title_font}px;font-weight:bold;font-family:sans-serif;letter-spacing:3px")
        xt.text = "IMPACT"

        # --- Zone legend (right side) ---
        lx = x0 + grid_w + 65
        ly = y0 + 10
        zone_items = [
            ("Low (1–4)", LOW_COLOR),
            ("Medium (5–9)", MED_COLOR),
            ("High (10–16)", HIGH_COLOR),
            ("Critical (20–25)", CRIT_COLOR),
        ]
        lt = self.svg.node(group, "text", x=lx, y=ly)
        lt.set("fill", INK)
        lt.set("style", f"font-size:{legend_font}px;font-weight:bold;font-family:sans-serif")
        lt.text = "Risk Zones"
        ly += legend_font + 14

        for label, color in zone_items:
            rect = self.svg.node(group, "rect", x=lx, y=ly, width=legend_box, height=legend_box, rx=4, ry=4)
            rect.set("fill", color)
            rect.set("stroke", PAGE_BG)
            rect.set("stroke-width", "2")

            txt = self.svg.node(group, "text", x=lx + legend_box + 12, y=ly + legend_box * 0.76)
            txt.set("fill", INK_SOFT)
            txt.set("style", f"font-size:{legend_font}px;font-weight:500;font-family:sans-serif")
            txt.text = label
            ly += legend_box + 20

        # --- Category legend ---
        ly += 24
        ct = self.svg.node(group, "text", x=lx, y=ly)
        ct.set("fill", INK)
        ct.set("style", f"font-size:{legend_font}px;font-weight:bold;font-family:sans-serif")
        ct.text = "Categories"
        ly += legend_font + 12

        for cat, color in CAT_COLORS.items():
            circ = self.svg.node(group, "circle", cx=lx + legend_box / 2, cy=ly + legend_box / 2 - 2, r=marker_r)
            circ.set("fill", color)
            circ.set("stroke", PAGE_BG)
            circ.set("stroke-width", "2")

            txt = self.svg.node(group, "text", x=lx + legend_box + 12, y=ly + legend_box * 0.73)
            txt.set("fill", INK_SOFT)
            txt.set("style", f"font-size:{legend_font}px;font-weight:500;font-family:sans-serif")
            txt.text = cat
            ly += legend_box + 18

    def _compute(self):
        n_rows = len(likelihood_labels)
        n_cols = len(impact_labels)
        self._box.xmin = 0
        self._box.xmax = n_cols
        self._box.ymin = 0
        self._box.ymax = n_rows


# Style — pygal Style carries all theme-adaptive chrome tokens
custom_style = Style(
    background=PAGE_BG,
    plot_background=PAGE_BG,
    foreground=INK,
    foreground_strong=INK,
    foreground_subtle=INK_MUTED,
    colors=IMPRINT_PALETTE,
    title_font_size=66,
    label_font_size=56,
    major_label_font_size=44,
    legend_font_size=44,
    value_font_size=36,
    stroke_width=2.5,
    font_family="sans-serif",
)

# Plot — square canvas for symmetric heatmap
TITLE = "heatmap-risk-matrix · python · pygal · anyplot.ai"
chart = RiskMatrixHeatmap(
    width=2400,
    height=2400,
    style=custom_style,
    title=TITLE,
    show_legend=False,
    margin=40,
    margin_top=50,
    margin_bottom=60,
    margin_left=60,
    margin_right=60,
    show_x_labels=False,
    show_y_labels=False,
    tooltip_border_radius=6,
)

chart.add("", [0])

# Save
chart.render_to_png(f"plot-{THEME}.png")

with open(f"plot-{THEME}.html", "wb") as f:
    f.write(chart.render())
Runnable source as JSON, for any HTTP client: https://api.anyplot.ai/specs/heatmap-risk-matrix/pygal/code. Any spec id and library id listed in llms-full.txt fit the same URL shape; every URL below is complete and callable.
{
  "spec_id": "heatmap-risk-matrix",
  "language": "python",
  "library": "pygal",
  "page": "https://anyplot.ai/heatmap-risk-matrix/python/pygal",
  "hub": "https://anyplot.ai/heatmap-risk-matrix",
  "code_json": "https://api.anyplot.ai/specs/heatmap-risk-matrix/pygal/code",
  "spec_json": "https://api.anyplot.ai/specs/heatmap-risk-matrix",
  "render_light_png": "https://storage.googleapis.com/anyplot-images/plots/heatmap-risk-matrix/python/pygal/plot-light.png",
  "render_dark_png": "https://storage.googleapis.com/anyplot-images/plots/heatmap-risk-matrix/python/pygal/plot-dark.png",
  "interactive_light_html": "https://storage.googleapis.com/anyplot-images/plots/heatmap-risk-matrix/python/pygal/plot-light.html",
  "interactive_dark_html": "https://storage.googleapis.com/anyplot-images/plots/heatmap-risk-matrix/python/pygal/plot-dark.html",
  "quality_score": 84.0,
  "license": "MIT",
  "guide": "https://anyplot.ai/llms.txt"
}
Part of Risk Assessment Matrix (Probability vs Impact) on anyplot.ai.