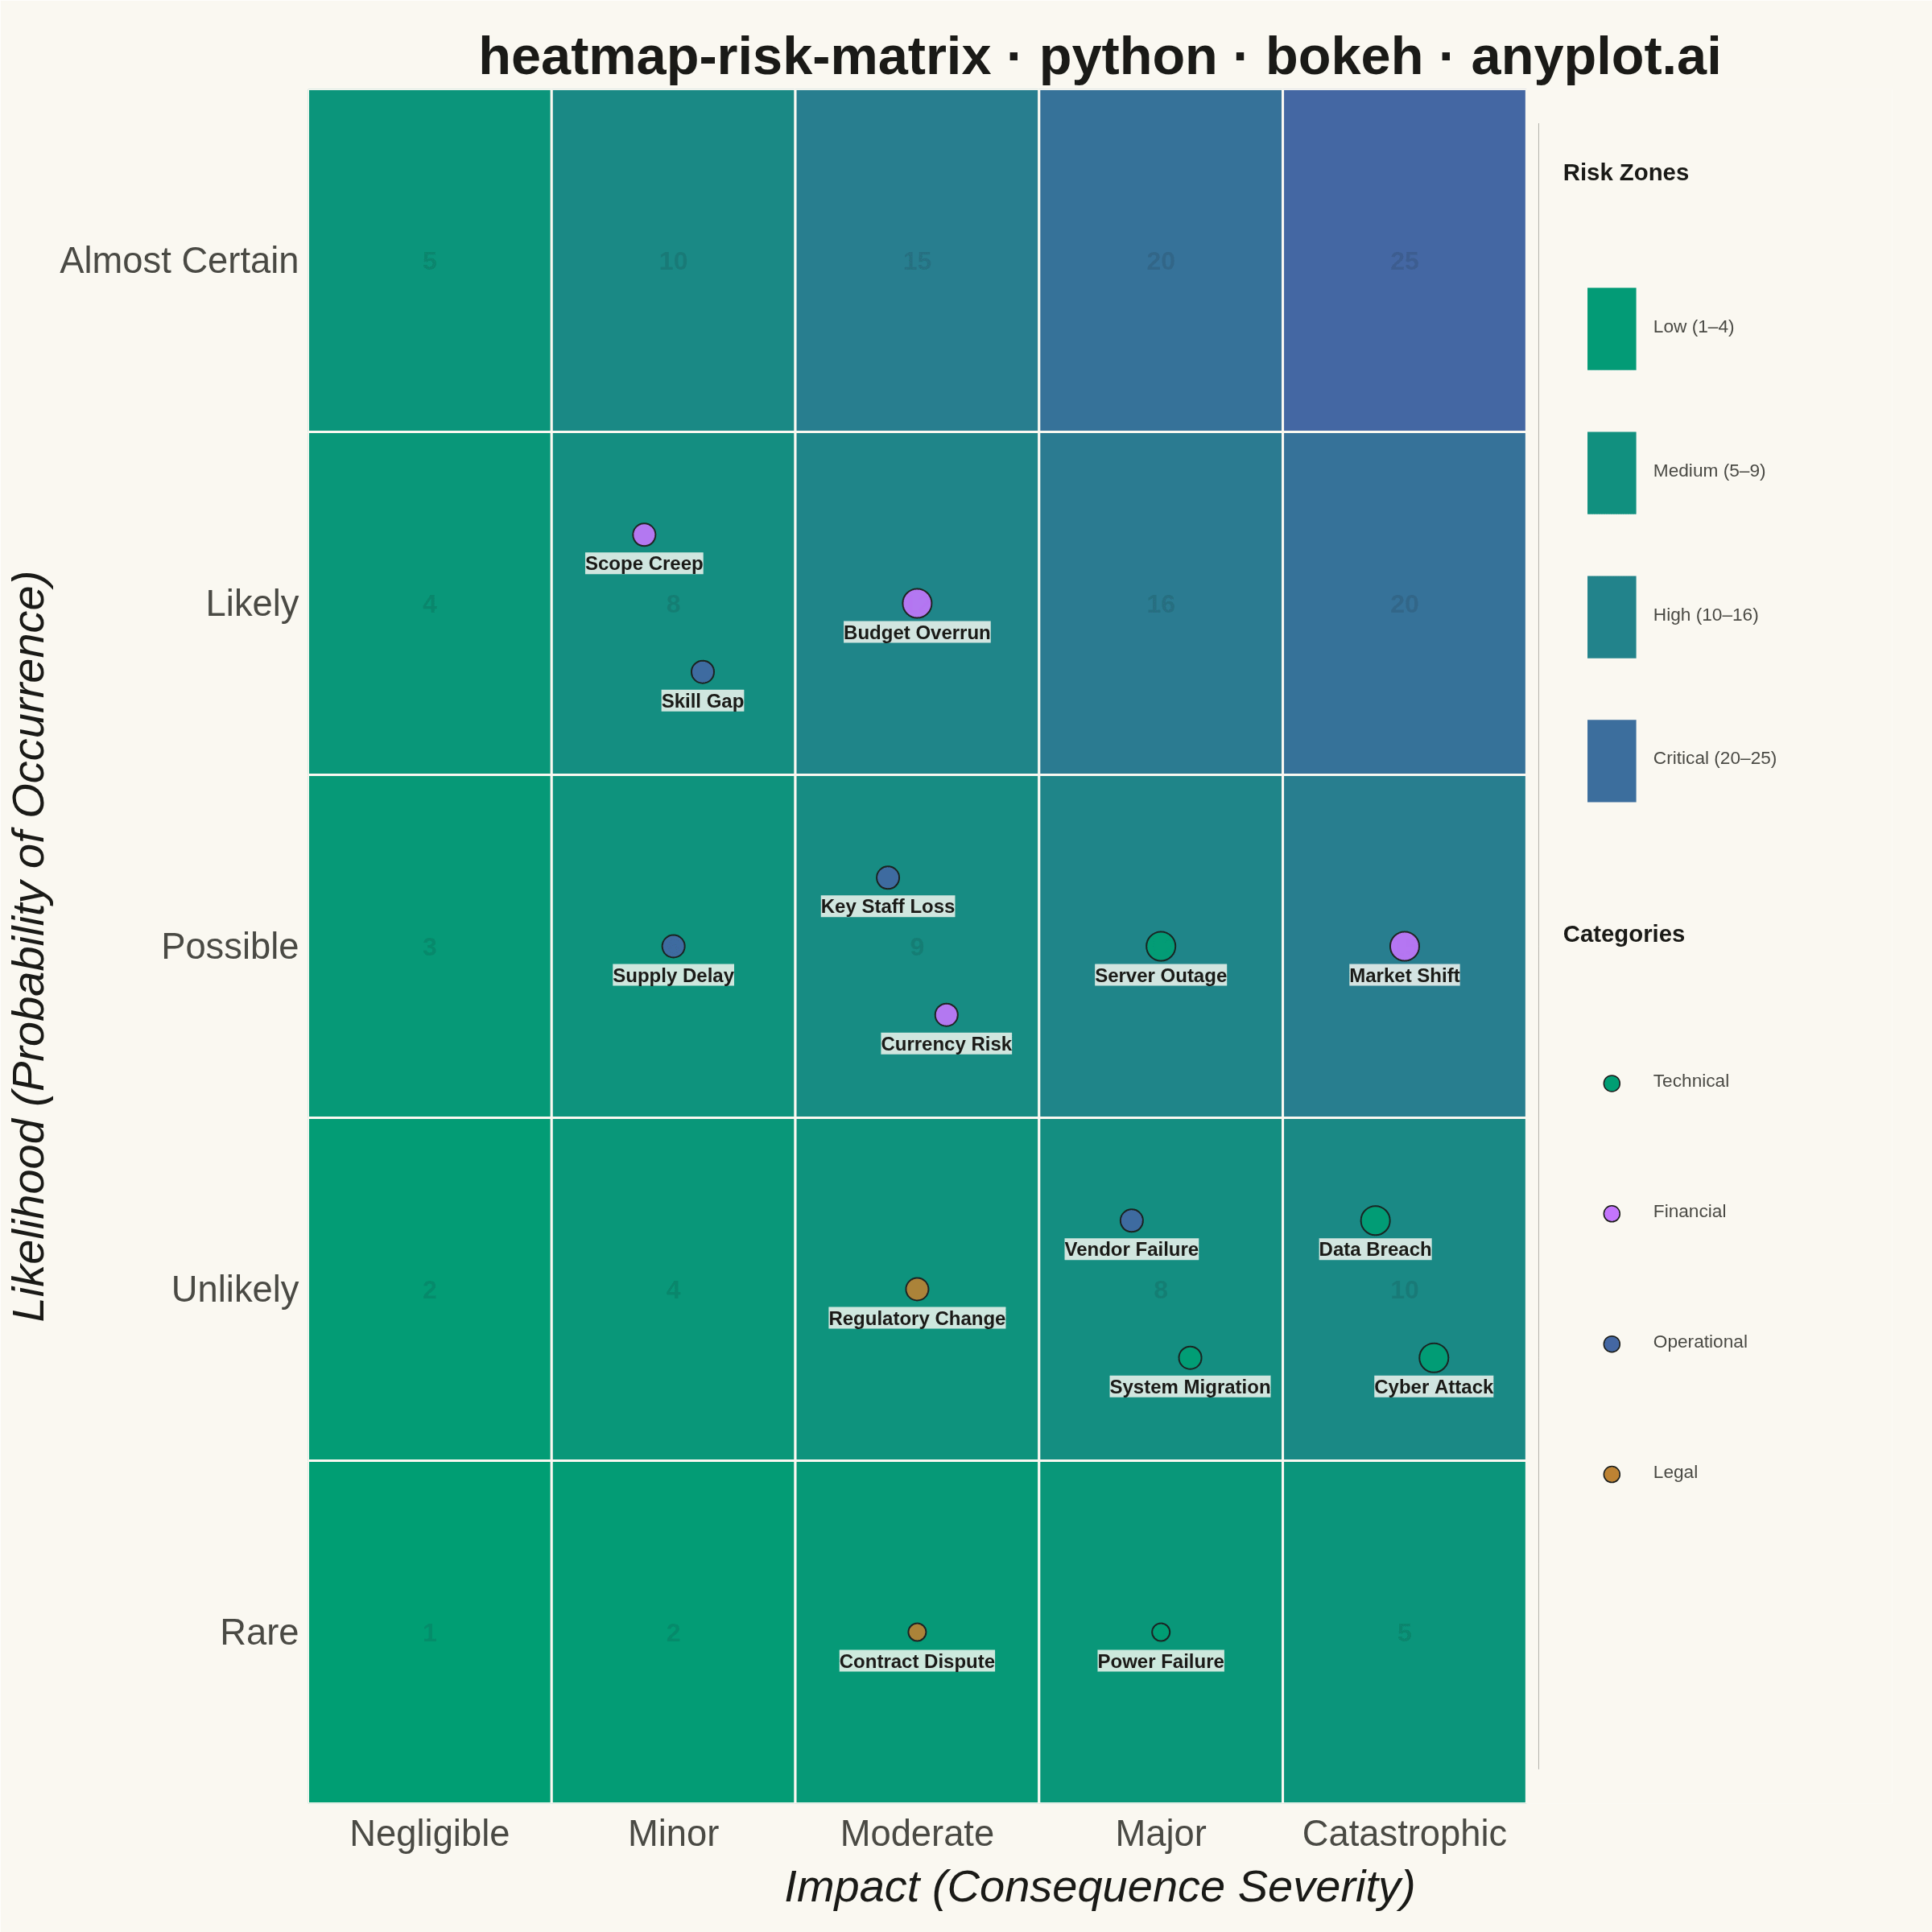
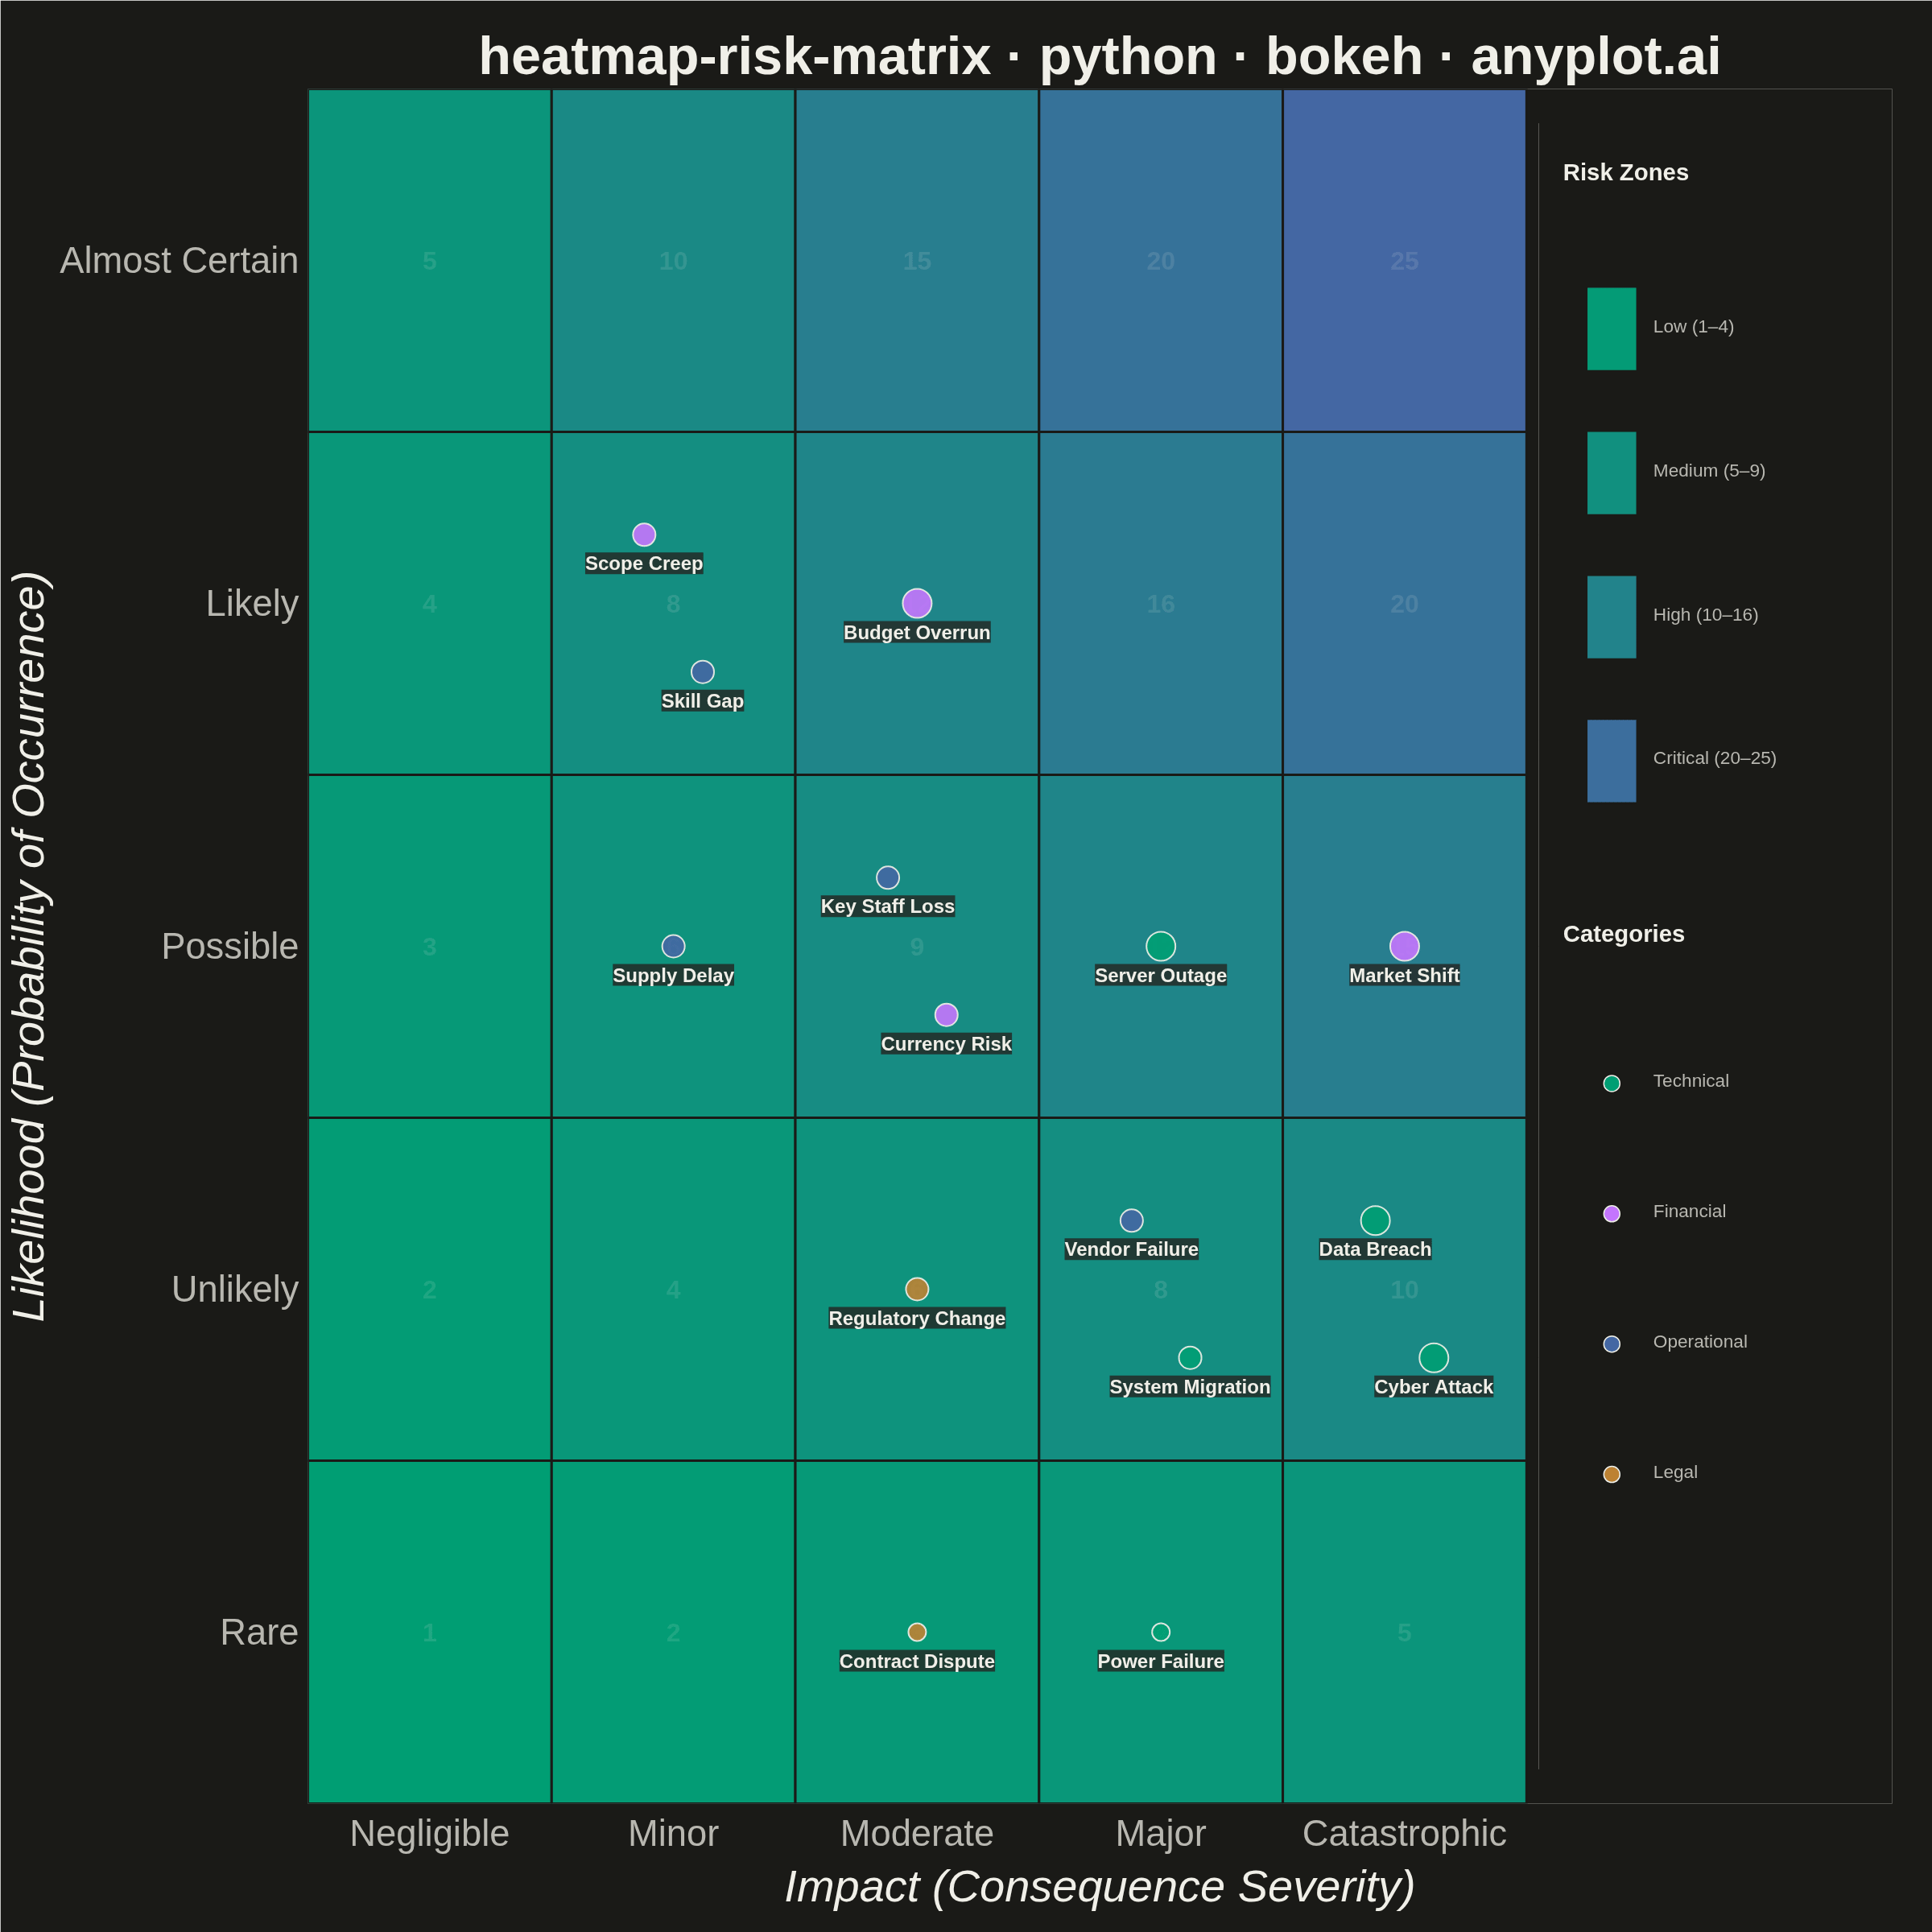
A 5x5 grid heatmap plotting risk likelihood against consequence severity, used to visualize and prioritize risks in project and enterprise risk management. Cells are color-coded from green (low risk) through yellow and orange to red (critical risk), with individual risk items plotted as labeled markers. The risk score for each cell is the product of likelihood and impact, and zones are labeled to indicate risk severity levels (Low, Medium, High, Critical).
""" anyplot.ai
heatmap-risk-matrix: Risk Assessment Matrix (Probability vs Impact)
Library: bokeh 3.9.1 | Python 3.13.14
Quality: 90/100 | Updated: 2026-06-20
"""

import os
import sys


# Prevent this file (bokeh.py) from shadowing the installed bokeh package
_here = os.path.dirname(os.path.abspath(__file__))
sys.path = [p for p in sys.path if os.path.abspath(p) != _here]

import time
from collections import defaultdict
from pathlib import Path

import numpy as np
from bokeh.io import output_file, save
from bokeh.models import ColumnDataSource, Label, LabelSet, LinearColorMapper, Range1d
from bokeh.plotting import figure
from bokeh.transform import transform
from selenium import webdriver
from selenium.webdriver.chrome.options import Options


# Theme tokens
THEME = os.getenv("ANYPLOT_THEME", "light")
PAGE_BG = "#FAF8F1" if THEME == "light" else "#1A1A17"
ELEVATED_BG = "#FFFDF6" if THEME == "light" else "#242420"
INK = "#1A1A17" if THEME == "light" else "#F0EFE8"
INK_SOFT = "#4A4A44" if THEME == "light" else "#B8B7B0"
INK_WATERMARK = "#1A1A1720" if THEME == "light" else "#F0EFE820"

# Imprint categorical palette — positions 1-4 for risk categories
IMPRINT_PALETTE = ["#009E73", "#C475FD", "#4467A3", "#BD8233", "#AE3030", "#2ABCCD", "#954477", "#99B314"]

# Imprint sequential colormap (green→blue) for continuous heatmap — colorblind-safe
_c0 = np.array([0x00, 0x9E, 0x73])  # #009E73 brand green
_c1 = np.array([0x44, 0x67, 0xA3])  # #4467A3 blue
ANYPLOT_SEQ256 = ["#{:02X}{:02X}{:02X}".format(*(_c0 + (_c1 - _c0) * t / 255).round().astype(int)) for t in range(256)]

# Pre-computed zone swatch colors sampled from the gradient at representative t values
# Low(t≈0.06), Medium(t≈0.25), High(t≈0.50), Critical(t≈0.88)
zone_swatches = ["#049B76", "#11907F", "#22838B", "#3C6E9D"]

# Data
np.random.seed(42)

# Build 5×5 background grid with risk scores (likelihood × impact)
grid_x, grid_y, risk_scores, score_text = [], [], [], []
for i in range(5):
    for j in range(5):
        grid_x.append(j + 0.5)
        grid_y.append(i + 0.5)
        score = (i + 1) * (j + 1)
        risk_scores.append(score)
        score_text.append(str(score))

grid_source = ColumnDataSource(data={"x": grid_x, "y": grid_y, "score": risk_scores, "text": score_text})
mapper = LinearColorMapper(palette=ANYPLOT_SEQ256, low=1, high=25)

# Risk items: (name, likelihood 1-5, impact 1-5, category)
risks = [
    ("Server Outage", 3, 4, "Technical"),
    ("Data Breach", 2, 5, "Technical"),
    ("Budget Overrun", 4, 3, "Financial"),
    ("Key Staff Loss", 3, 3, "Operational"),
    ("Vendor Failure", 2, 4, "Operational"),
    ("Scope Creep", 4, 2, "Financial"),
    ("Regulatory Change", 2, 3, "Legal"),
    ("Market Shift", 3, 5, "Financial"),
    ("Power Failure", 1, 4, "Technical"),
    ("Supply Delay", 3, 2, "Operational"),
    ("Cyber Attack", 2, 5, "Technical"),
    ("Contract Dispute", 1, 3, "Legal"),
    ("Skill Gap", 4, 2, "Operational"),
    ("Currency Risk", 3, 3, "Financial"),
    ("System Migration", 2, 4, "Technical"),
]

cat_order = ["Technical", "Financial", "Operational", "Legal"]
cat_colors = {cat: IMPRINT_PALETTE[i] for i, cat in enumerate(cat_order)}

# Group risks by cell to apply structured position offsets (avoids marker/label overlap)
cell_groups = defaultdict(list)
for idx, (name, likelihood, impact, category) in enumerate(risks):
    cell_groups[(impact, likelihood)].append((idx, name, category))

cell_offsets = {
    1: [(0, 0)],
    2: [(-0.12, 0.2), (0.12, -0.2)],
    3: [(-0.18, 0.22), (0.18, 0.22), (0, -0.22)],
    4: [(-0.18, 0.22), (0.18, 0.22), (-0.18, -0.22), (0.18, -0.22)],
}

risk_x = [0.0] * len(risks)
risk_y = [0.0] * len(risks)
risk_names = [""] * len(risks)
risk_marker_colors = [""] * len(risks)
risk_sizes = [0] * len(risks)

for (impact, likelihood), items in cell_groups.items():
    offsets = cell_offsets.get(len(items), cell_offsets[4][: len(items)])
    for pos, (idx, name, category) in enumerate(items):
        ox, oy = offsets[pos]
        risk_x[idx] = impact - 1 + 0.5 + ox
        risk_y[idx] = likelihood - 1 + 0.5 + oy
        risk_names[idx] = name
        risk_marker_colors[idx] = cat_colors[category]
        score = likelihood * impact
        if score >= 20:
            risk_sizes[idx] = 44
        elif score >= 10:
            risk_sizes[idx] = 36
        elif score >= 5:
            risk_sizes[idx] = 28
        else:
            risk_sizes[idx] = 22

risk_source = ColumnDataSource(
    data={"x": risk_x, "y": risk_y, "label": risk_names, "color": risk_marker_colors, "size": risk_sizes}
)

# Plot — 2400×2400 square canvas; x_range extended to 6.5 to hold legend area
W, H = 2400, 2400
title_str = "heatmap-risk-matrix · python · bokeh · anyplot.ai"

p = figure(
    width=W,
    height=H,
    x_range=Range1d(0, 6.5),
    y_range=Range1d(0, 5),
    title=title_str,
    toolbar_location=None,
    min_border_bottom=160,
    min_border_left=180,
    min_border_top=110,
    min_border_right=50,
)

# Background heatmap cells
p.rect(
    x="x",
    y="y",
    width=1,
    height=1,
    source=grid_source,
    fill_color=transform("score", mapper),
    line_color=PAGE_BG,
    line_width=3,
)

# Risk score watermarks in each cell (low alpha)
p.text(
    x="x",
    y="y",
    text="text",
    source=grid_source,
    text_align="center",
    text_baseline="middle",
    text_font_size="24pt",
    text_color=INK_WATERMARK,
    text_font_style="bold",
)

# Risk item markers (size varies by risk score for visual hierarchy)
p.scatter(x="x", y="y", source=risk_source, size="size", color="color", line_color=INK, line_width=2, alpha=0.9)

# Risk name labels below each marker
labels = LabelSet(
    x="x",
    y="y",
    text="label",
    source=risk_source,
    x_offset=0,
    y_offset=-22,
    text_align="center",
    text_baseline="top",
    text_font_size="18pt",
    text_color=INK,
    text_font_style="bold",
    background_fill_color=ELEVATED_BG,
    background_fill_alpha=0.8,
    border_line_color=None,
)
p.add_layout(labels)

# Axis tick overrides — descriptive categorical labels per spec
p.xaxis.ticker = [0.5, 1.5, 2.5, 3.5, 4.5]
p.yaxis.ticker = [0.5, 1.5, 2.5, 3.5, 4.5]
p.xaxis.major_label_overrides = {0.5: "Negligible", 1.5: "Minor", 2.5: "Moderate", 3.5: "Major", 4.5: "Catastrophic"}
p.yaxis.major_label_overrides = {0.5: "Rare", 1.5: "Unlikely", 2.5: "Possible", 3.5: "Likely", 4.5: "Almost Certain"}

# Separator between grid and legend area
p.line([5.05, 5.05], [0.1, 4.9], line_color=INK_SOFT, line_width=1, line_alpha=0.4)

# Zone legend — swatch colors sampled from the actual imprint_seq gradient
zone_labels = ["Low (1–4)", "Medium (5–9)", "High (10–16)", "Critical (20–25)"]
p.add_layout(Label(x=5.15, y=4.72, text="Risk Zones", text_font_size="22pt", text_font_style="bold", text_color=INK))
for idx, (zone_label, swatch_color) in enumerate(zip(zone_labels, zone_swatches, strict=True)):
    py = 4.3 - idx * 0.42
    p.rect(x=[5.35], y=[py], width=0.2, height=0.24, color=swatch_color, line_color=None)
    p.add_layout(Label(x=5.52, y=py, text=zone_label, text_font_size="17pt", text_color=INK_SOFT, y_offset=-9))

# Category legend
p.add_layout(Label(x=5.15, y=2.5, text="Categories", text_font_size="22pt", text_font_style="bold", text_color=INK))
for idx, cat_name in enumerate(cat_order):
    py = 2.1 - idx * 0.38
    p.scatter(x=[5.35], y=[py], size=20, color=cat_colors[cat_name], line_color=INK, line_width=1.5)
    p.add_layout(Label(x=5.52, y=py, text=cat_name, text_font_size="17pt", text_color=INK_SOFT, y_offset=-9))

# Style — theme-adaptive chrome
p.background_fill_color = PAGE_BG
p.border_fill_color = PAGE_BG
p.outline_line_color = None

p.title.text_font_size = "50pt"
p.title.text_color = INK
p.title.align = "center"

p.xaxis.axis_label = "Impact (Consequence Severity)"
p.yaxis.axis_label = "Likelihood (Probability of Occurrence)"
p.xaxis.axis_label_text_font_size = "42pt"
p.yaxis.axis_label_text_font_size = "42pt"
p.xaxis.axis_label_text_color = INK
p.yaxis.axis_label_text_color = INK

p.xaxis.major_label_text_font_size = "34pt"
p.yaxis.major_label_text_font_size = "34pt"
p.xaxis.major_label_text_color = INK_SOFT
p.yaxis.major_label_text_color = INK_SOFT

p.axis.axis_line_color = None
p.axis.major_tick_line_color = None
p.grid.grid_line_color = None

# Save HTML (catalog artifact) then screenshot with headless Chrome
output_file(f"plot-{THEME}.html")
save(p)

opts = Options()
for arg in (
    "--headless=new",
    "--no-sandbox",
    "--disable-dev-shm-usage",
    "--disable-gpu",
    f"--window-size={W},{H}",
    "--hide-scrollbars",
):
    opts.add_argument(arg)
driver = webdriver.Chrome(options=opts)
# CDP override forces an exact W×H viewport regardless of outer window chrome
driver.execute_cdp_cmd(
    "Emulation.setDeviceMetricsOverride", {"width": W, "height": H, "deviceScaleFactor": 1, "mobile": False}
)
driver.get(f"file://{Path(f'plot-{THEME}.html').resolve()}")
time.sleep(3)
driver.save_screenshot(f"plot-{THEME}.png")
driver.quit()
Runnable source as JSON, for any HTTP client: https://api.anyplot.ai/specs/heatmap-risk-matrix/bokeh/code. Any spec id and library id listed in llms-full.txt fit the same URL shape; every URL below is complete and callable.
{
  "spec_id": "heatmap-risk-matrix",
  "language": "python",
  "library": "bokeh",
  "page": "https://anyplot.ai/heatmap-risk-matrix/python/bokeh",
  "hub": "https://anyplot.ai/heatmap-risk-matrix",
  "code_json": "https://api.anyplot.ai/specs/heatmap-risk-matrix/bokeh/code",
  "spec_json": "https://api.anyplot.ai/specs/heatmap-risk-matrix",
  "render_light_png": "https://storage.googleapis.com/anyplot-images/plots/heatmap-risk-matrix/python/bokeh/plot-light.png",
  "render_dark_png": "https://storage.googleapis.com/anyplot-images/plots/heatmap-risk-matrix/python/bokeh/plot-dark.png",
  "interactive_light_html": "https://storage.googleapis.com/anyplot-images/plots/heatmap-risk-matrix/python/bokeh/plot-light.html",
  "interactive_dark_html": "https://storage.googleapis.com/anyplot-images/plots/heatmap-risk-matrix/python/bokeh/plot-dark.html",
  "quality_score": 90.0,
  "license": "MIT",
  "guide": "https://anyplot.ai/llms.txt"
}
Part of Risk Assessment Matrix (Probability vs Impact) on anyplot.ai.