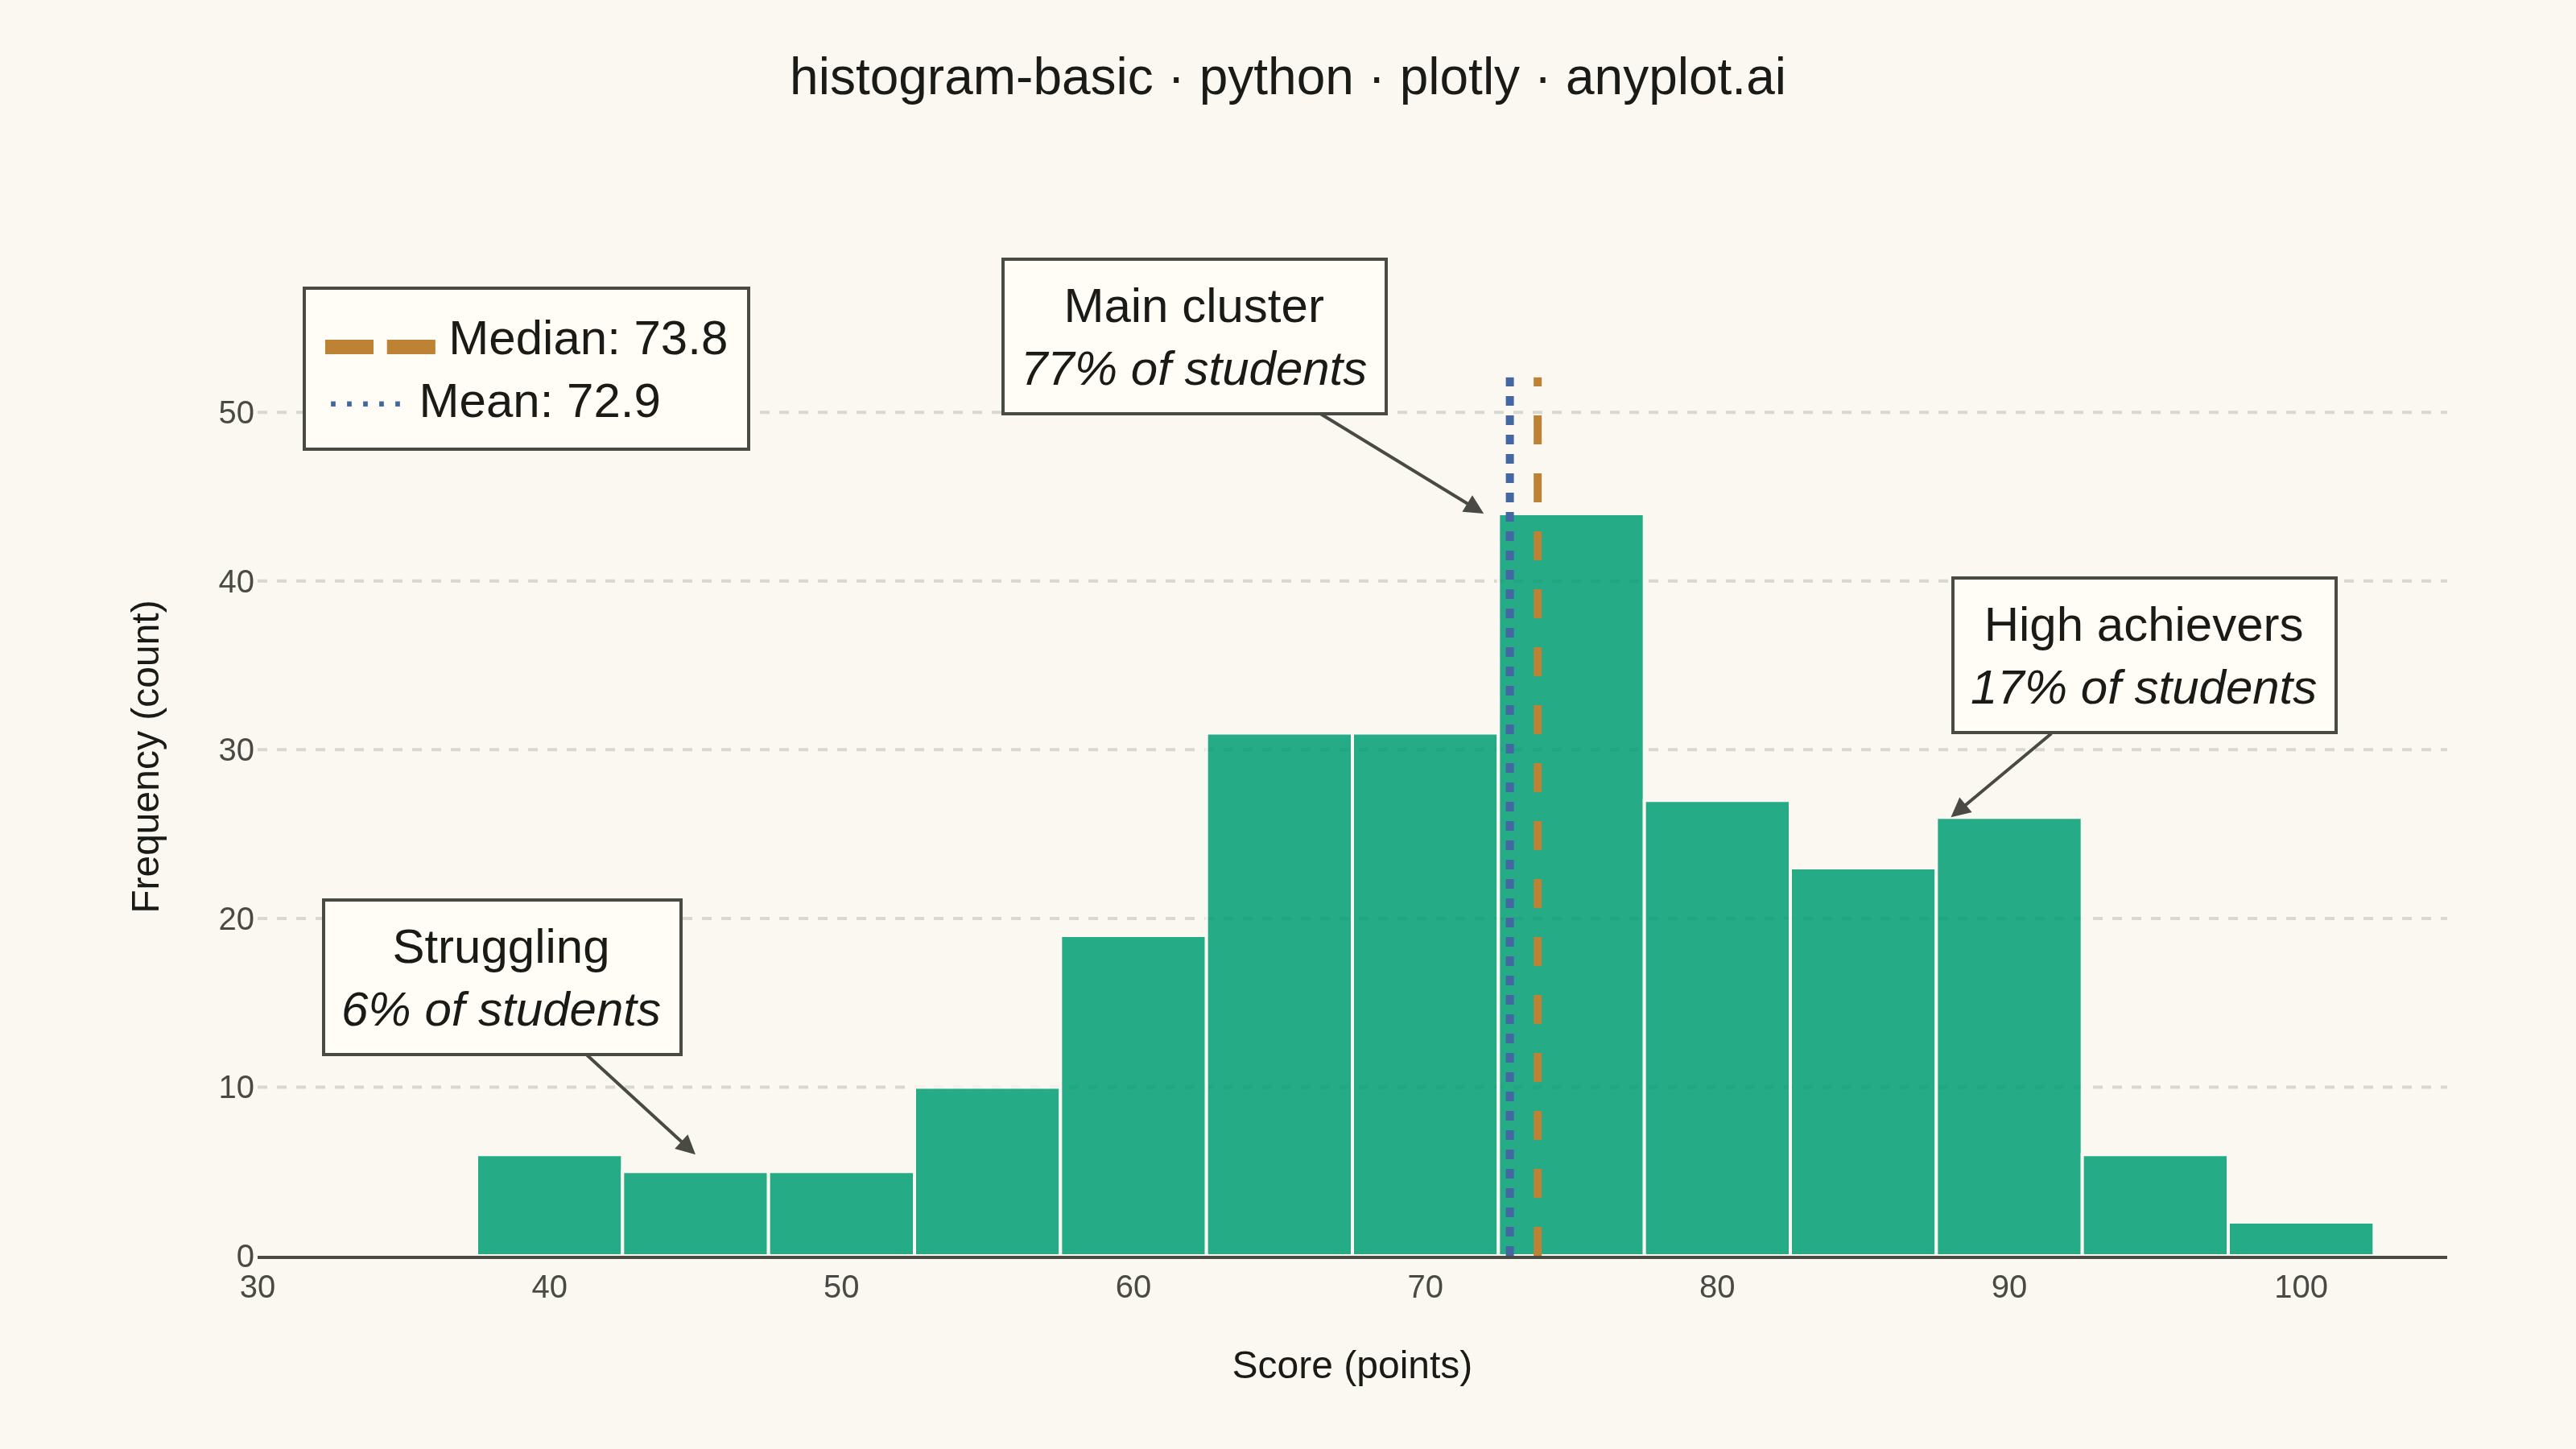
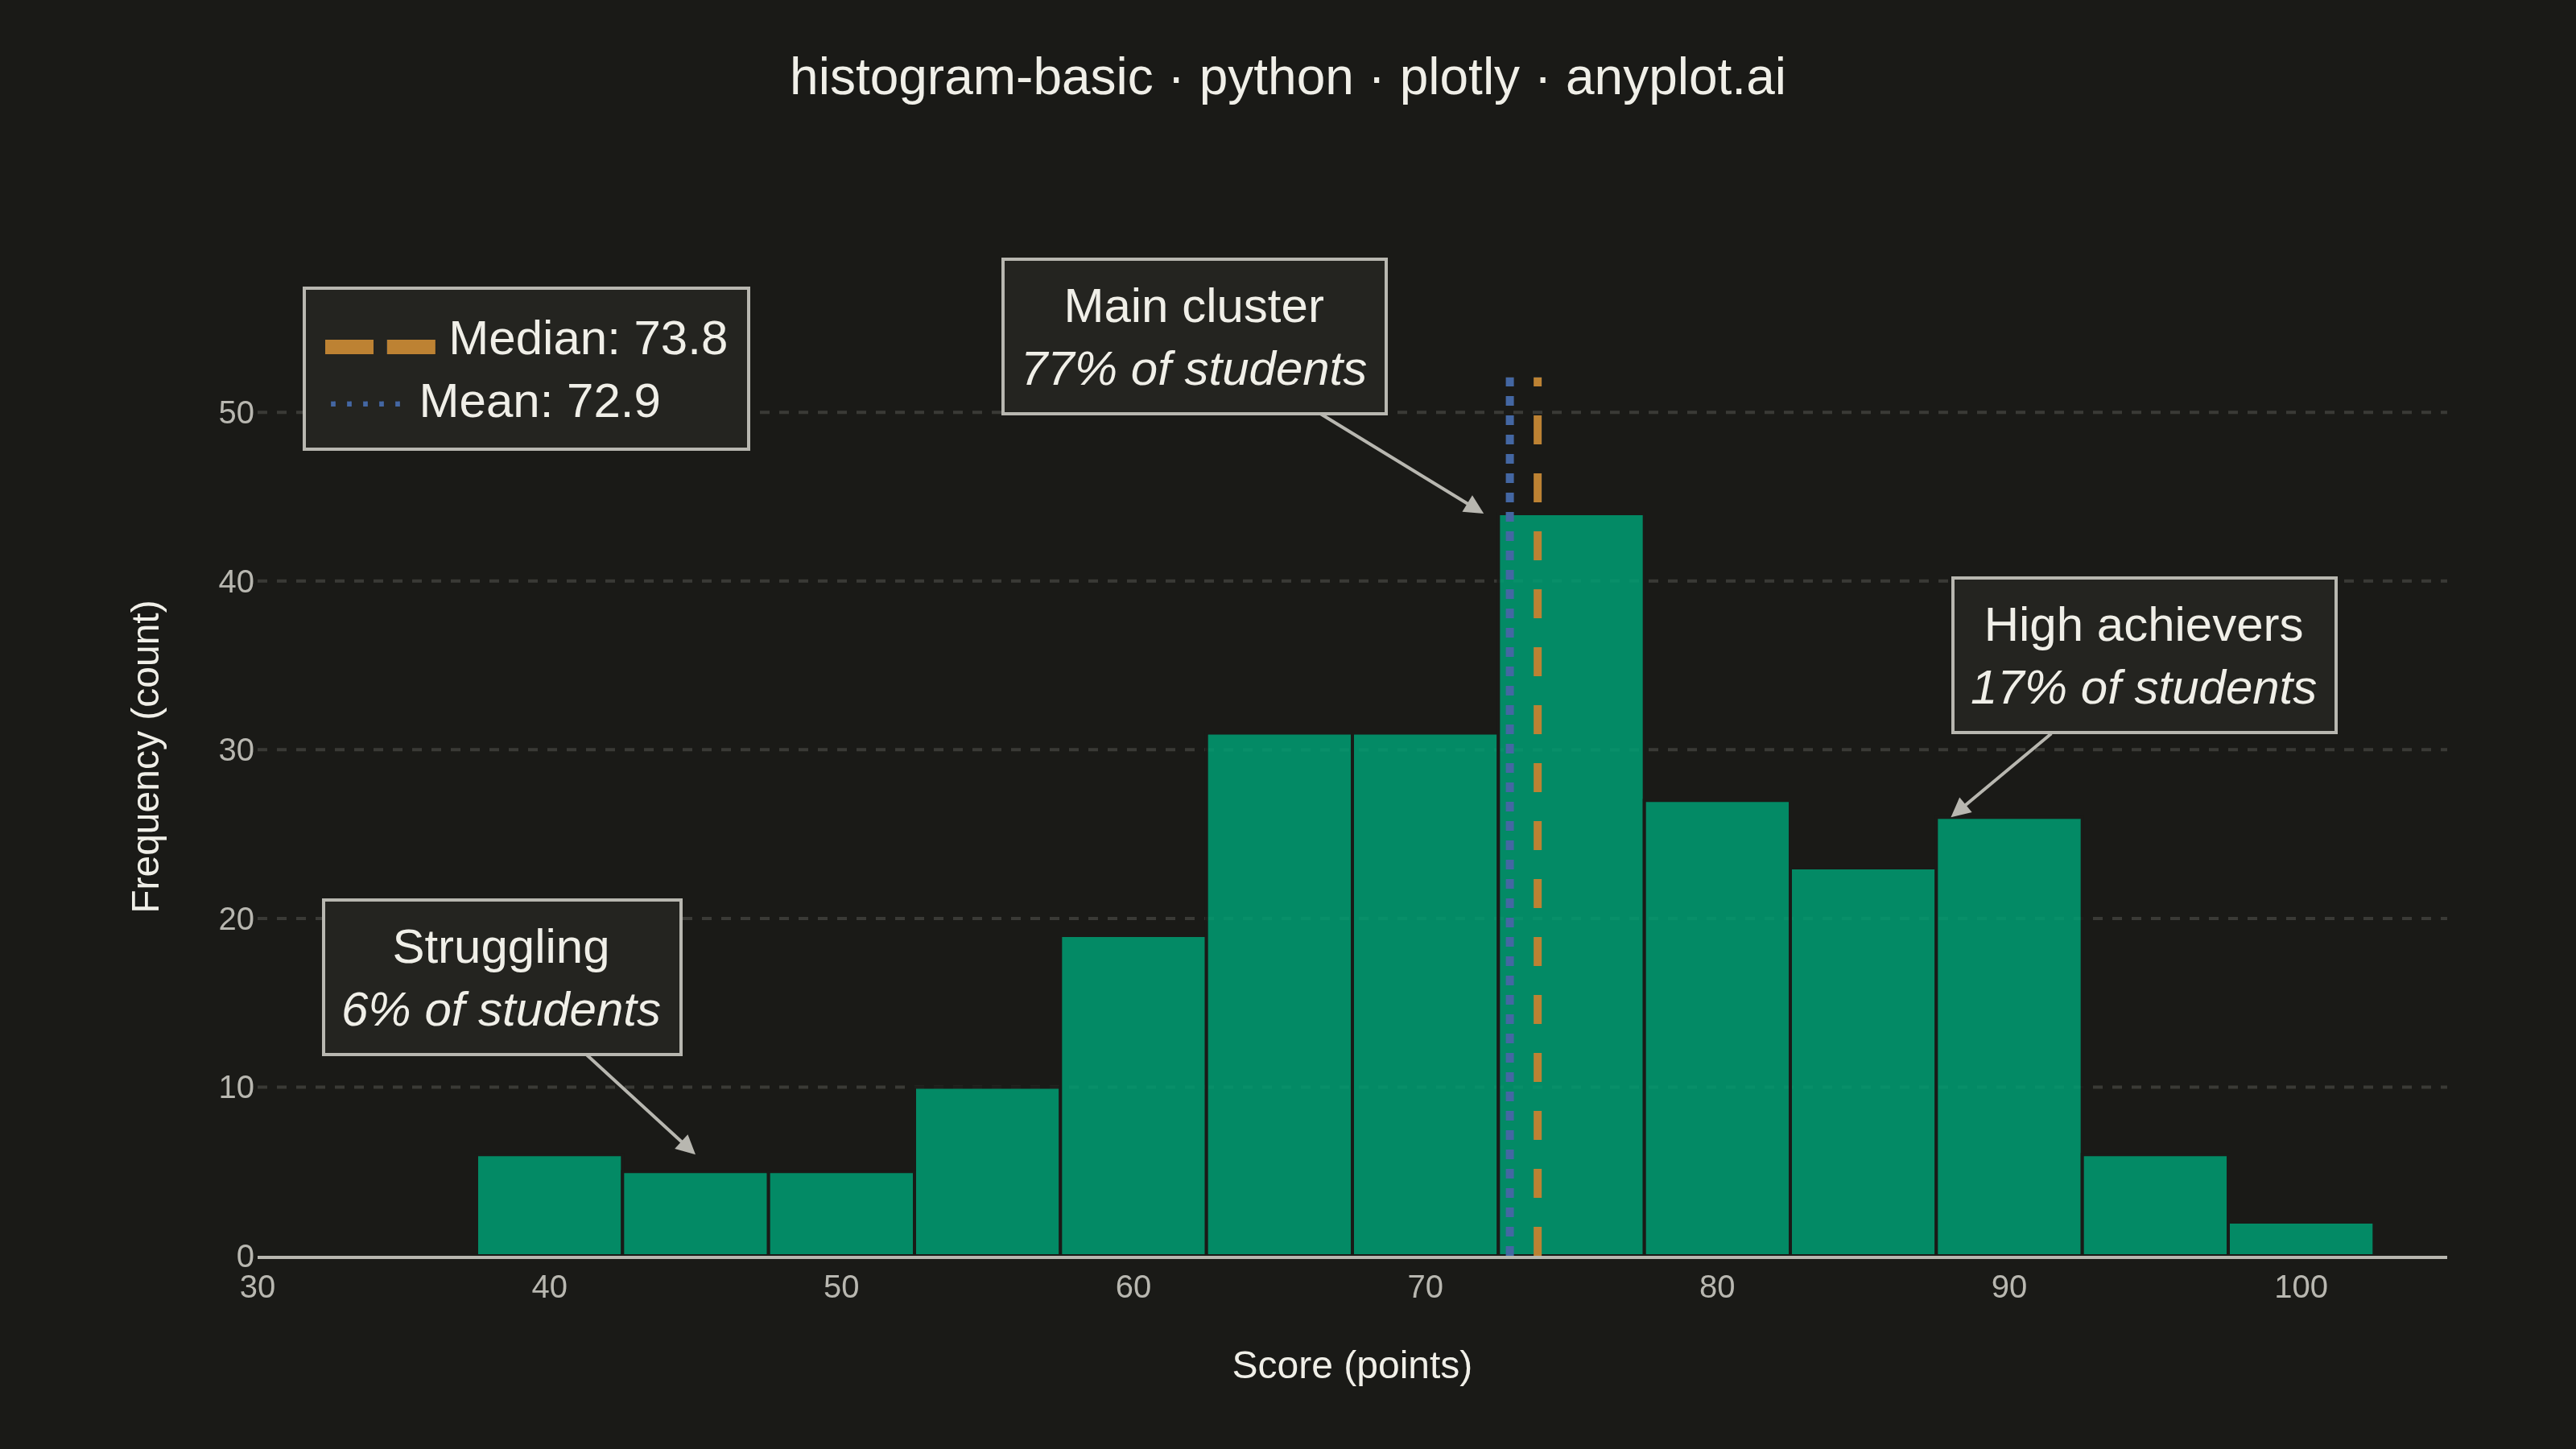
A histogram displays the distribution of a single continuous variable by dividing the data range into bins and showing the frequency (count) of observations in each bin. It reveals the shape of the data distribution, including central tendency, spread, and presence of outliers or multiple modes.
Preview render from the Plotly implementation.