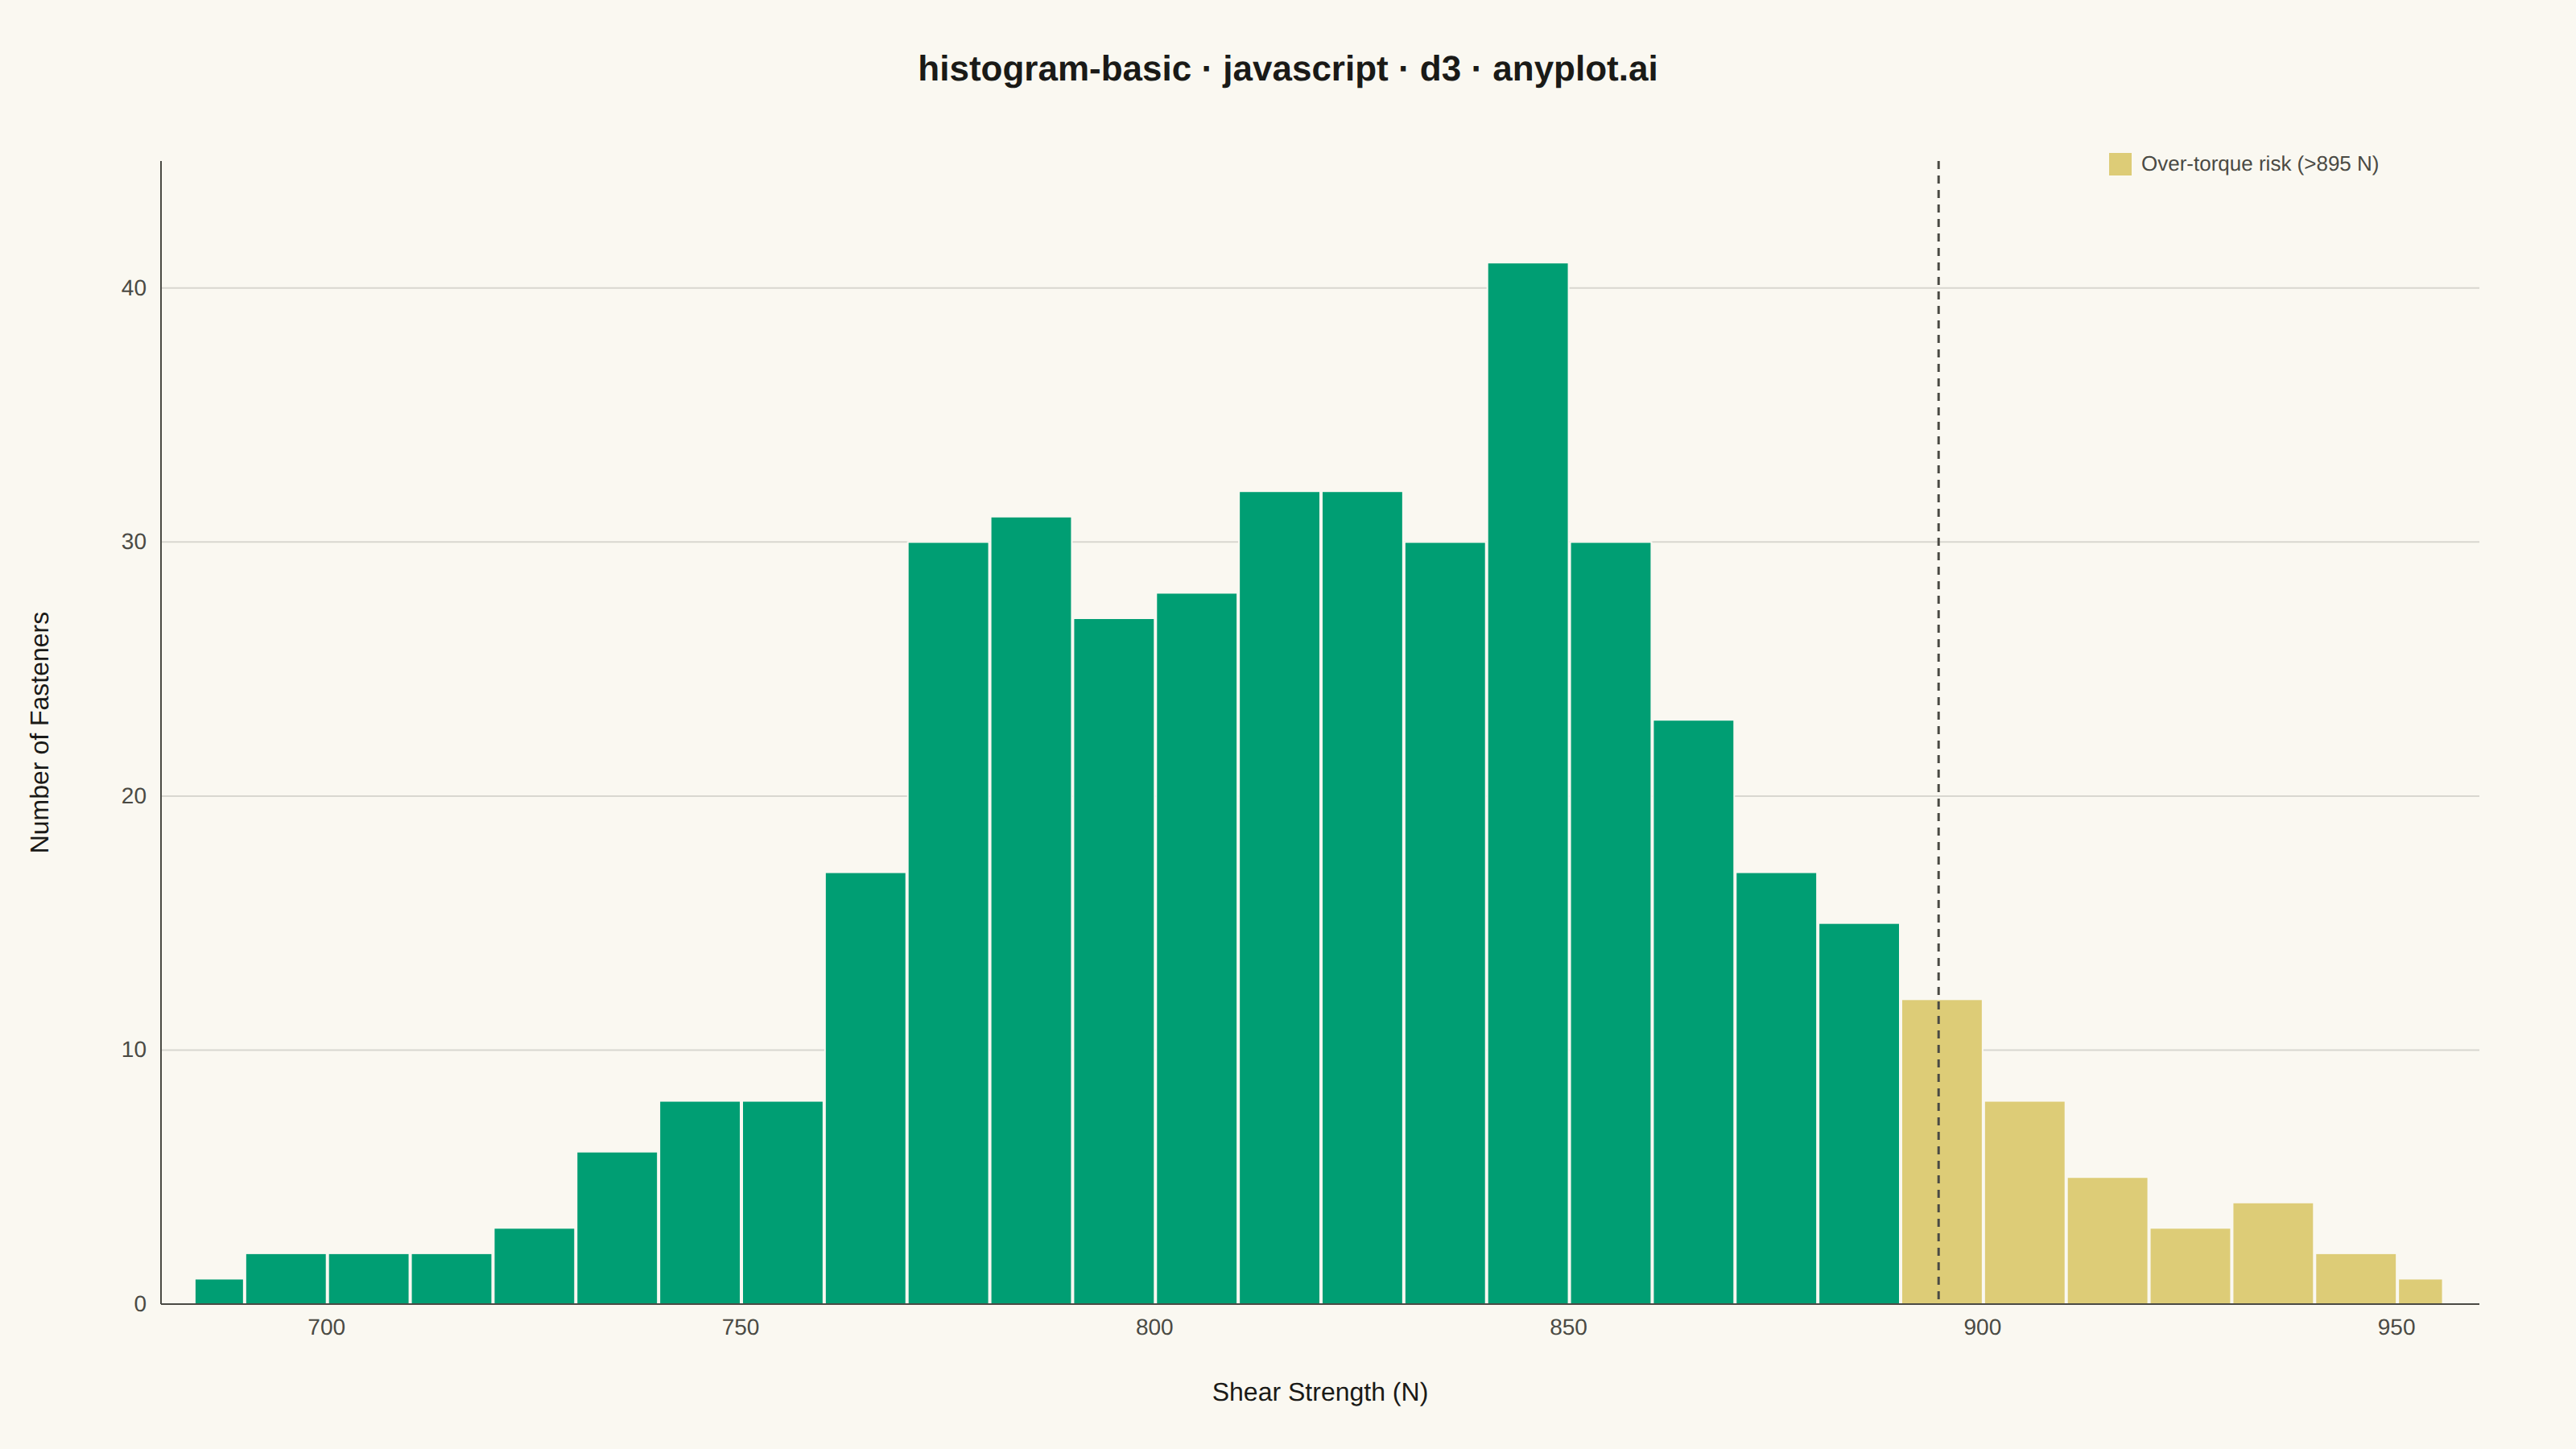
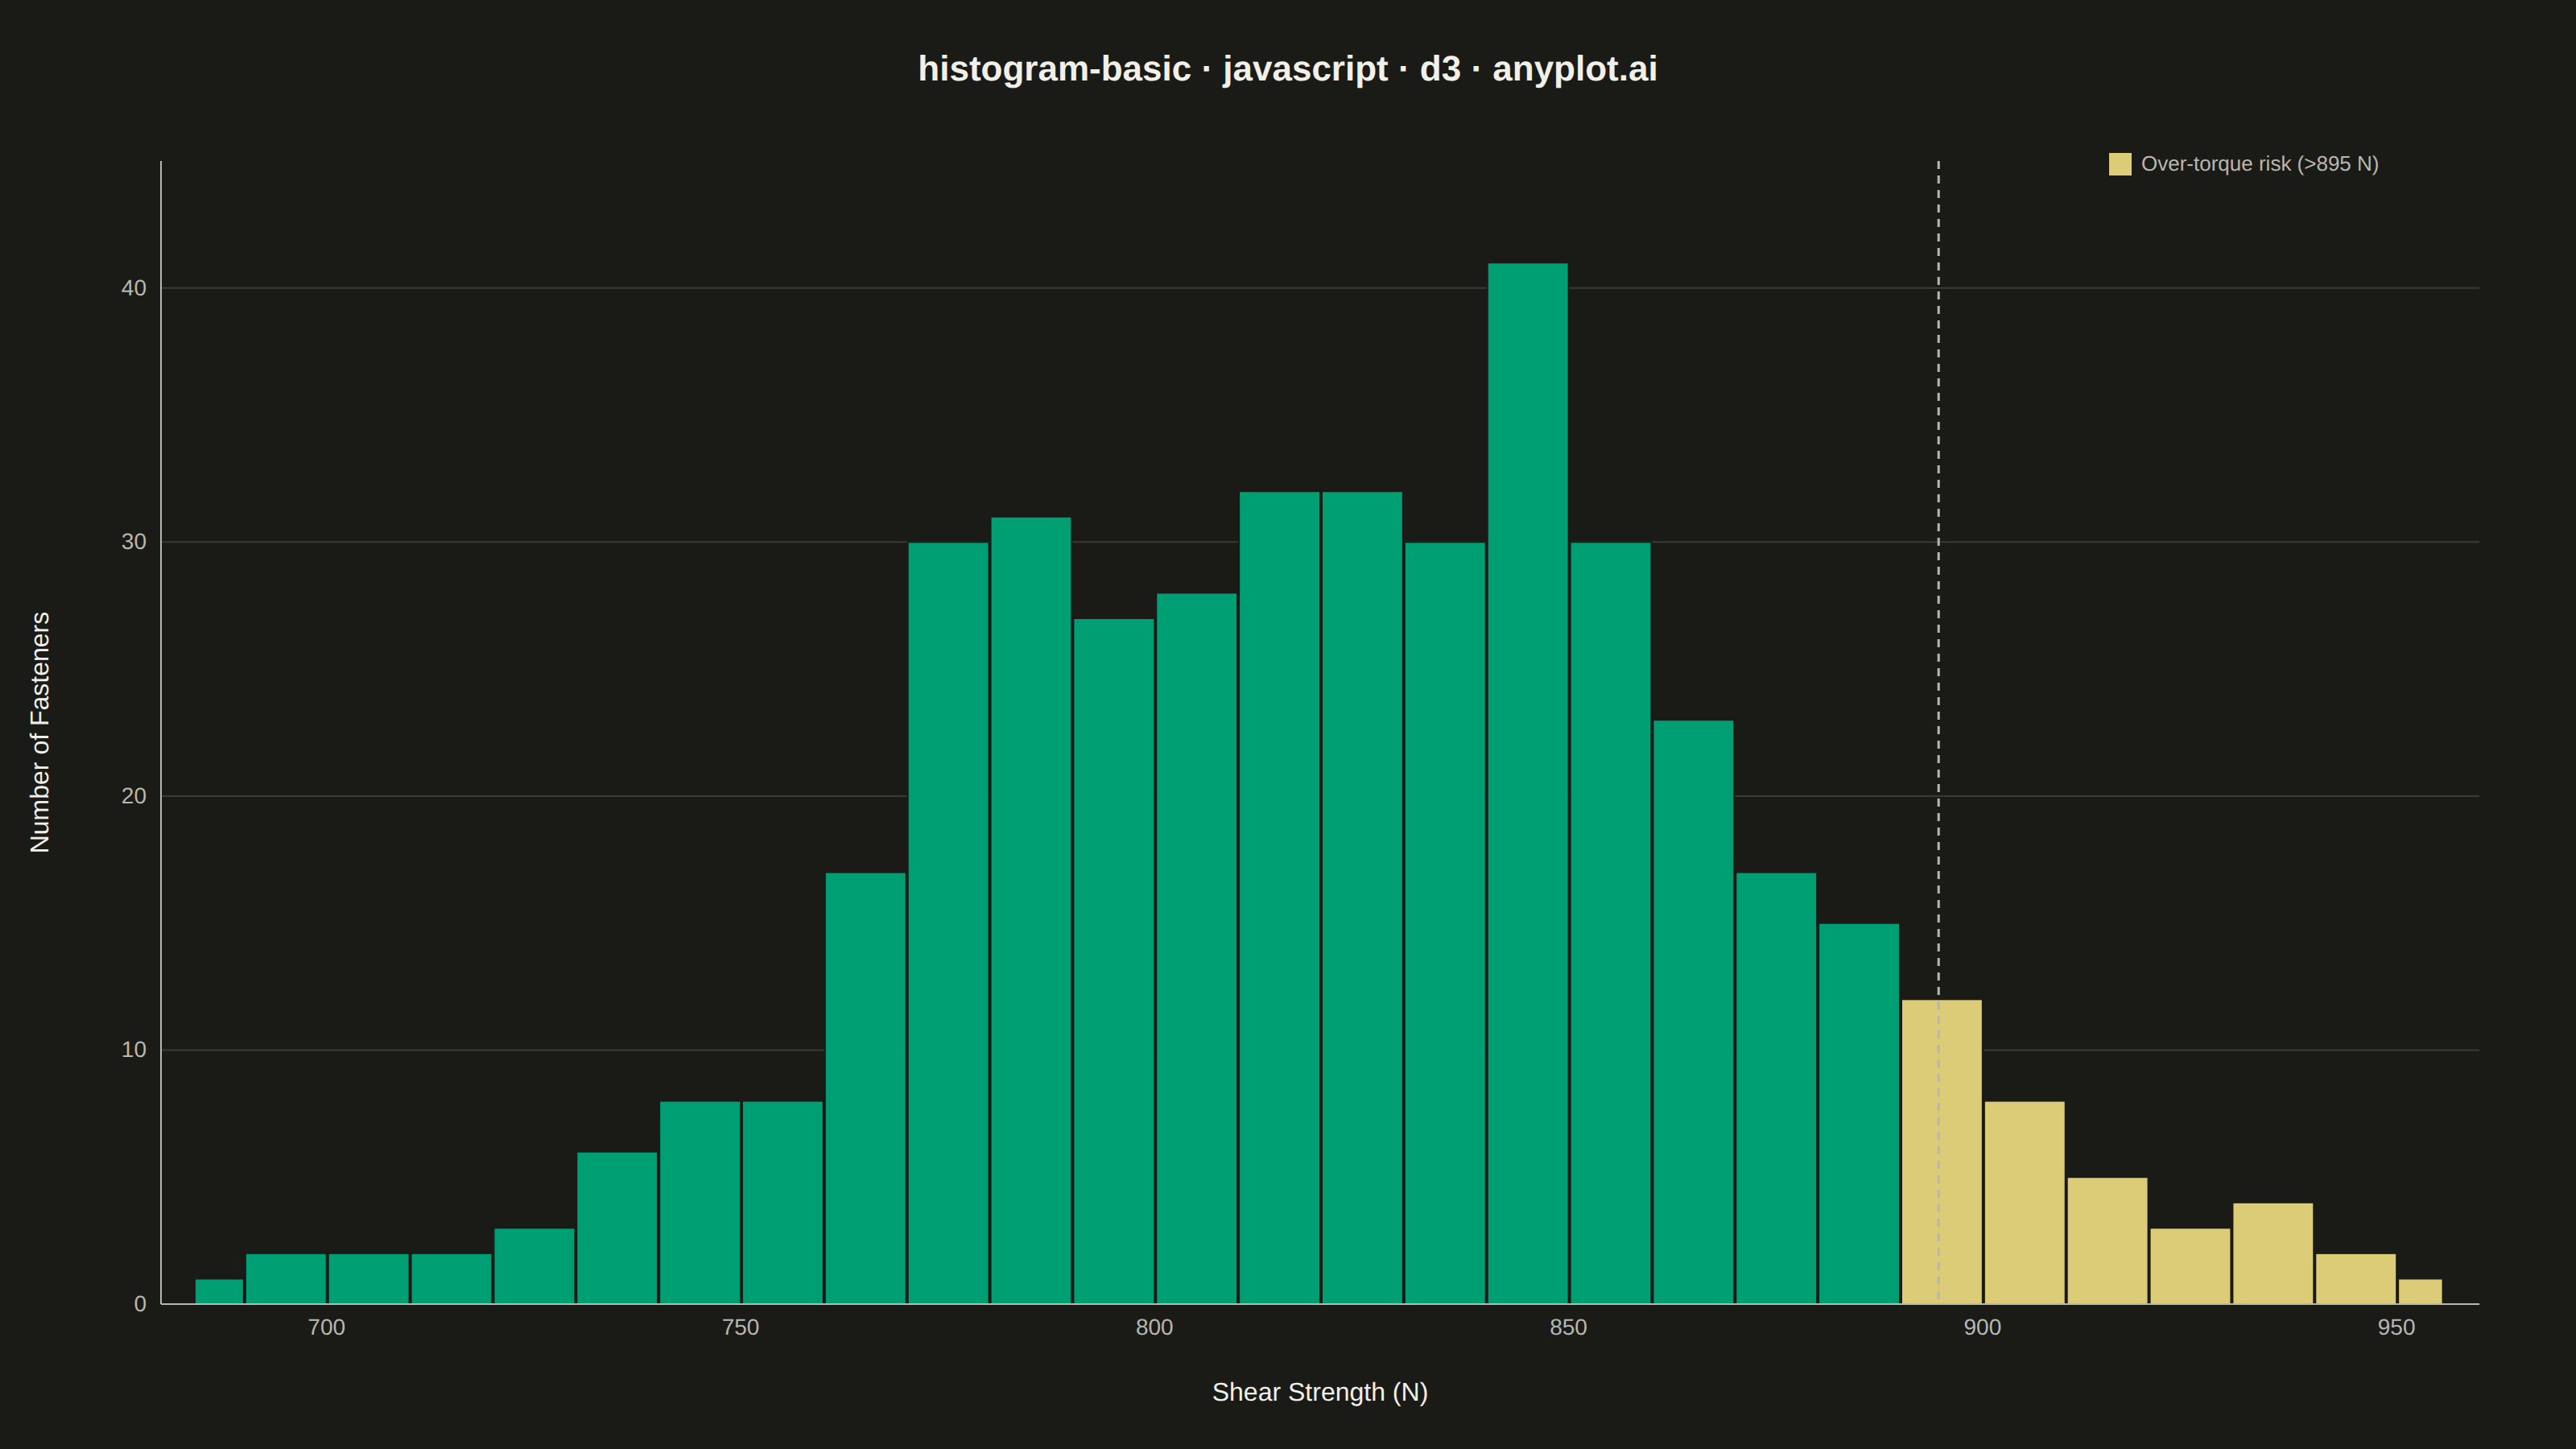
The same plot in 14 other libraries — JavaScript: Chart.js, Apache ECharts, Highcharts, MUI X Charts; Python: Altair, Bokeh, lets-plot, Matplotlib, Plotly, plotnine, Pygal, Seaborn; R: ggplot2; Julia: Makie.jl. Compare all 15 side by side: Basic Histogram in Python, R, Julia and JavaScript.
A histogram displays the distribution of a single continuous variable by dividing the data range into bins and showing the frequency (count) of observations in each bin. It reveals the shape of the data distribution, including central tendency, spread, and presence of outliers or multiple modes.
// anyplot.ai
// histogram-basic: Basic Histogram
// Library: d3 7.9.0 | JavaScript 22.23.2
// Quality: 92/100 | Created: 2026-08-26

const t = window.ANYPLOT_TOKENS;
const { width, height } = window.ANYPLOT_SIZE;
const margin = { top: 100, right: 60, bottom: 90, left: 100 };
const iw = width - margin.left - margin.right;
const ih = height - margin.top - margin.bottom;

// --- Data (in-memory, deterministic LCG) ------------------------------------
// Bolt shear-strength measurements (N), quality-control sample with a slight
// right skew from occasional over-torqued fasteners.
let seed = 42;
function lcg() {
  seed = (seed * 1664525 + 1013904223) % 4294967296;
  return seed / 4294967296;
}
function gaussian() {
  const u1 = 1 - lcg();
  const u2 = lcg();
  return Math.sqrt(-2 * Math.log(u1)) * Math.cos(2 * Math.PI * u2);
}

const shearStrength = [];
for (let i = 0; i < 420; i++) {
  const base = 820 + gaussian() * 45;
  const skewBump = lcg() < 0.12 ? lcg() * 90 : 0;
  shearStrength.push(base + skewBump);
}

// Over-torque caution zone: mean + 1.5 standard deviations, derived from the
// sample itself rather than a hard-coded spec number.
const overTorqueThreshold = d3.mean(shearStrength) + 1.5 * d3.deviation(shearStrength);

// --- Bins ---------------------------------------------------------------
const binGenerator = d3.bin().domain(d3.extent(shearStrength)).thresholds(24);
const bins = binGenerator(shearStrength);

// --- SVG mount ----------------------------------------------------------
const svg = d3.select("#container").append("svg").attr("width", width).attr("height", height);
const g = svg.append("g").attr("transform", `translate(${margin.left},${margin.top})`);

// --- Scales ---------------------------------------------------------------
const x = d3.scaleLinear().domain(d3.extent(shearStrength)).nice().range([0, iw]);
const y = d3
  .scaleLinear()
  .domain([0, d3.max(bins, (d) => d.length)])
  .nice()
  .range([ih, 0]);

// --- Gridlines (y-axis only) -----------------------------------------------
g.append("g")
  .selectAll("line")
  .data(y.ticks(6))
  .join("line")
  .attr("x1", 0)
  .attr("x2", iw)
  .attr("y1", (d) => y(d))
  .attr("y2", (d) => y(d))
  .attr("stroke", t.grid)
  .attr("stroke-width", 1);

// --- Bars ---------------------------------------------------------------
// Bins beyond the over-torque caution zone are flagged in amber (the Imprint
// warning anchor) so the skewed tail the data already contains reads as a
// deliberate QC signal instead of just "the rightmost bars".
const bars = g
  .selectAll("rect.bar")
  .data(bins)
  .join("rect")
  .attr("class", "bar")
  .attr("x", (d) => x(d.x0) + 1)
  .attr("y", (d) => y(d.length))
  .attr("width", (d) => Math.max(0, x(d.x1) - x(d.x0) - 1))
  .attr("height", (d) => ih - y(d.length))
  .attr("fill", (d) => ((d.x0 + d.x1) / 2 >= overTorqueThreshold ? t.amber : t.palette[0]))
  .attr("stroke", t.pageBg)
  .attr("stroke-width", 1);

// --- Over-torque reference line ------------------------------------------
g.append("line")
  .attr("x1", x(overTorqueThreshold))
  .attr("x2", x(overTorqueThreshold))
  .attr("y1", 0)
  .attr("y2", ih)
  .attr("stroke", t.inkSoft)
  .attr("stroke-width", 1.5)
  .attr("stroke-dasharray", "5,4");

// --- Axes -------------------------------------------------------------------
const xAxis = g
  .append("g")
  .attr("transform", `translate(0,${ih})`)
  .call(d3.axisBottom(x).ticks(8).tickSizeOuter(0));
const yAxis = g.append("g").call(d3.axisLeft(y).ticks(6).tickSizeOuter(0));

for (const ax of [xAxis, yAxis]) {
  ax.selectAll("text").attr("fill", t.inkSoft).style("font-size", "14px");
  ax.selectAll("line").attr("stroke", t.inkSoft);
  ax.select(".domain").attr("stroke", t.inkSoft);
}
xAxis.selectAll("line").remove();
yAxis.selectAll("line").remove();

// --- Axis labels --------------------------------------------------------
g.append("text")
  .attr("x", iw / 2)
  .attr("y", ih + 60)
  .attr("text-anchor", "middle")
  .attr("fill", t.ink)
  .style("font-size", "16px")
  .text("Shear Strength (N)");

g.append("text")
  .attr("transform", "rotate(-90)")
  .attr("x", -ih / 2)
  .attr("y", -70)
  .attr("text-anchor", "middle")
  .attr("fill", t.ink)
  .style("font-size", "16px")
  .text("Number of Fasteners");

// --- Over-torque legend (explains the amber semantic, top-right of chart) --
const legend = g.append("g").attr("transform", `translate(${iw - 230}, 6)`);
legend.append("rect").attr("width", 14).attr("height", 14).attr("y", -11).attr("fill", t.amber);
legend
  .append("text")
  .attr("x", 20)
  .attr("fill", t.inkSoft)
  .style("font-size", "13px")
  .text(`Over-torque risk (>${Math.round(overTorqueThreshold)} N)`);

// --- Title --------------------------------------------------------------
svg
  .append("text")
  .attr("x", width / 2)
  .attr("y", 50)
  .attr("text-anchor", "middle")
  .attr("fill", t.ink)
  .style("font-size", "22px")
  .style("font-weight", "600")
  .text("histogram-basic · javascript · d3 · anyplot.ai");

// --- Hover tooltips (interactive; opacity 0 by default, invisible in the ---
// --- static PNG, revealed via d3 mouse events in the exported HTML) --------
const tooltip = svg
  .append("g")
  .attr("class", "tooltip")
  .style("opacity", 0)
  .style("pointer-events", "none");
const tooltipRect = tooltip.append("rect").attr("fill", t.elevatedBg).attr("stroke", t.inkSoft).attr("rx", 4);
const tooltipText = tooltip.append("text").attr("fill", t.ink).style("font-size", "13px");

bars
  .on("mouseover", function (event, d) {
    tooltipText.text(`${Math.round(d.x0)}–${Math.round(d.x1)} N: ${d.length}`);
    const bbox = tooltipText.node().getBBox();
    tooltipRect.attr("width", bbox.width + 16).attr("height", bbox.height + 10);
    tooltipText.attr("x", 8).attr("y", bbox.height + 1);
    const [mx, my] = d3.pointer(event, svg.node());
    tooltip.attr("transform", `translate(${mx + 12},${my - bbox.height - 20})`);
    tooltip.style("opacity", 1);
  })
  .on("mouseout", () => tooltip.style("opacity", 0));
Runnable source as JSON, for any HTTP client: https://api.anyplot.ai/specs/histogram-basic/d3/code. Any spec id and library id listed in llms-full.txt fit the same URL shape; every URL below is complete and callable.
{
  "spec_id": "histogram-basic",
  "language": "javascript",
  "library": "d3",
  "page": "https://anyplot.ai/histogram-basic/javascript/d3",
  "hub": "https://anyplot.ai/histogram-basic",
  "code_json": "https://api.anyplot.ai/specs/histogram-basic/d3/code",
  "spec_json": "https://api.anyplot.ai/specs/histogram-basic",
  "render_light_png": "https://storage.googleapis.com/anyplot-images/plots/histogram-basic/javascript/d3/plot-light.png",
  "render_dark_png": "https://storage.googleapis.com/anyplot-images/plots/histogram-basic/javascript/d3/plot-dark.png",
  "interactive_light_html": "https://storage.googleapis.com/anyplot-images/plots/histogram-basic/javascript/d3/plot-light.html",
  "interactive_dark_html": "https://storage.googleapis.com/anyplot-images/plots/histogram-basic/javascript/d3/plot-dark.html",
  "quality_score": 92.0,
  "license": "MIT",
  "guide": "https://anyplot.ai/llms.txt"
}
Part of Basic Histogram on anyplot.ai.