The same plot in 14 other libraries — Python: Altair, Bokeh, lets-plot, Matplotlib, Plotly, plotnine, Pygal, Seaborn; R: ggplot2; JavaScript: Chart.js, D3.js, Apache ECharts, Highcharts, MUI X Charts. Compare all 15 side by side: Basic Histogram in Python, R, Julia and JavaScript.
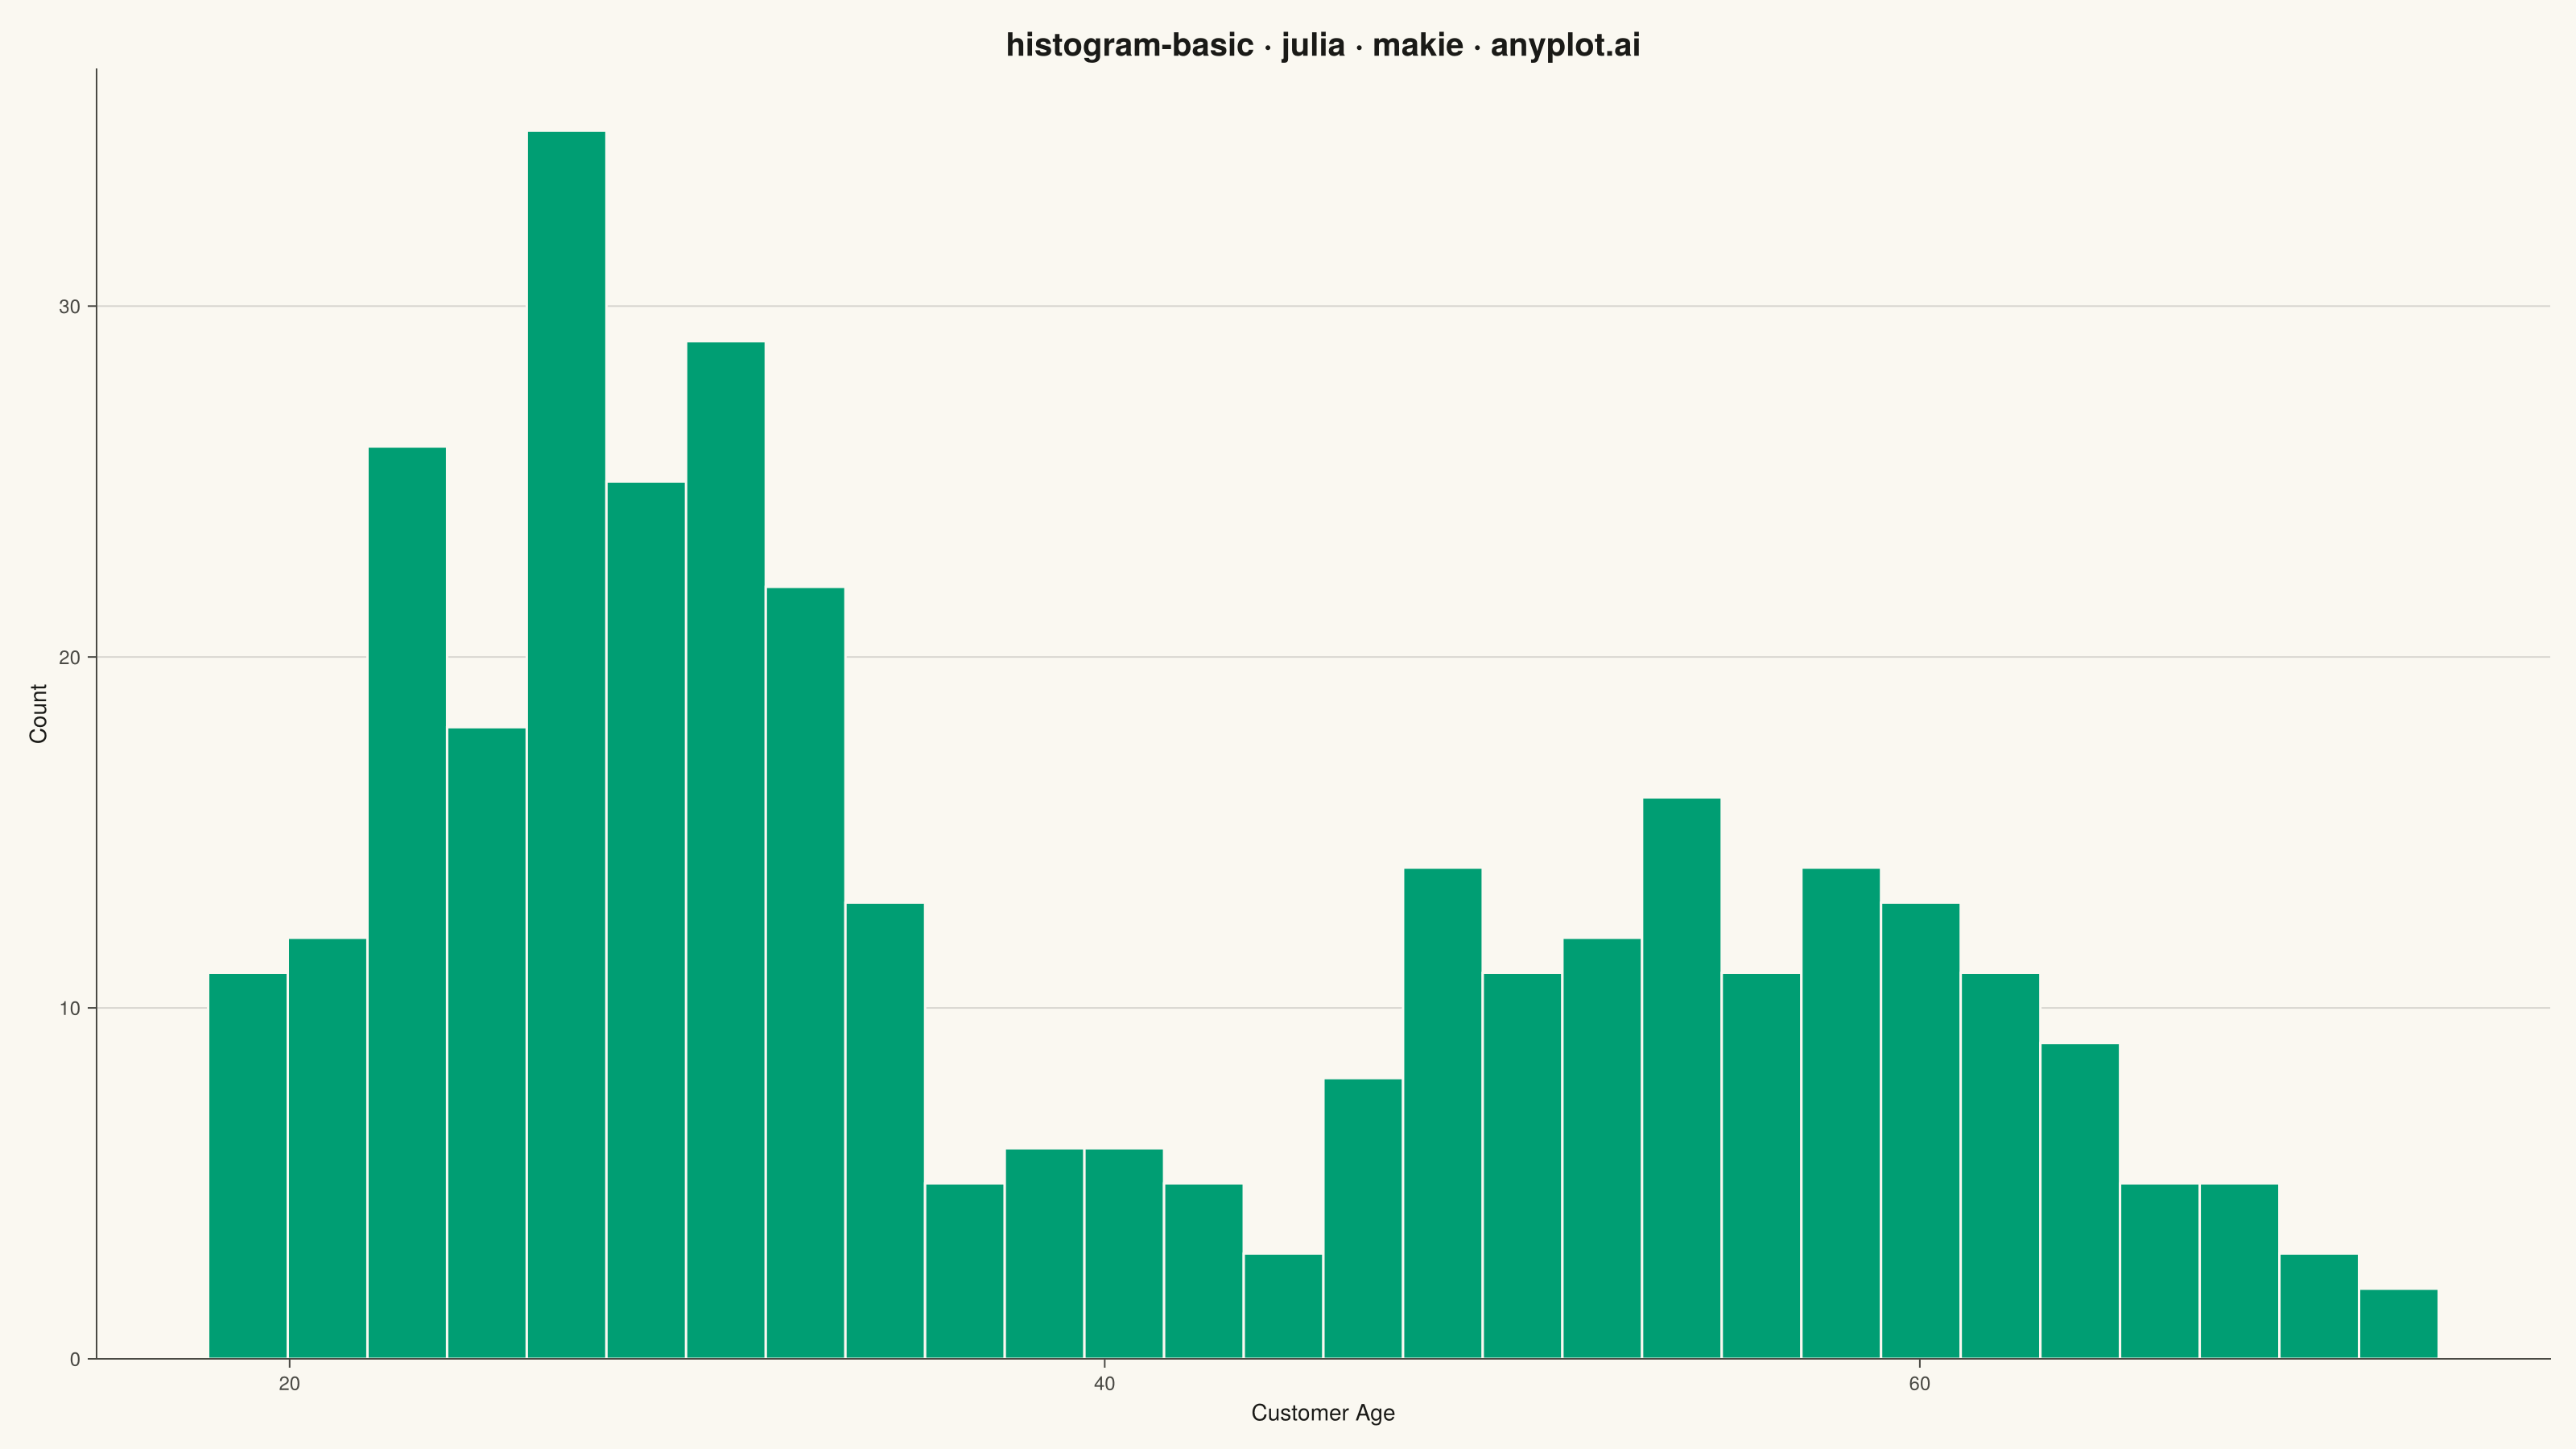
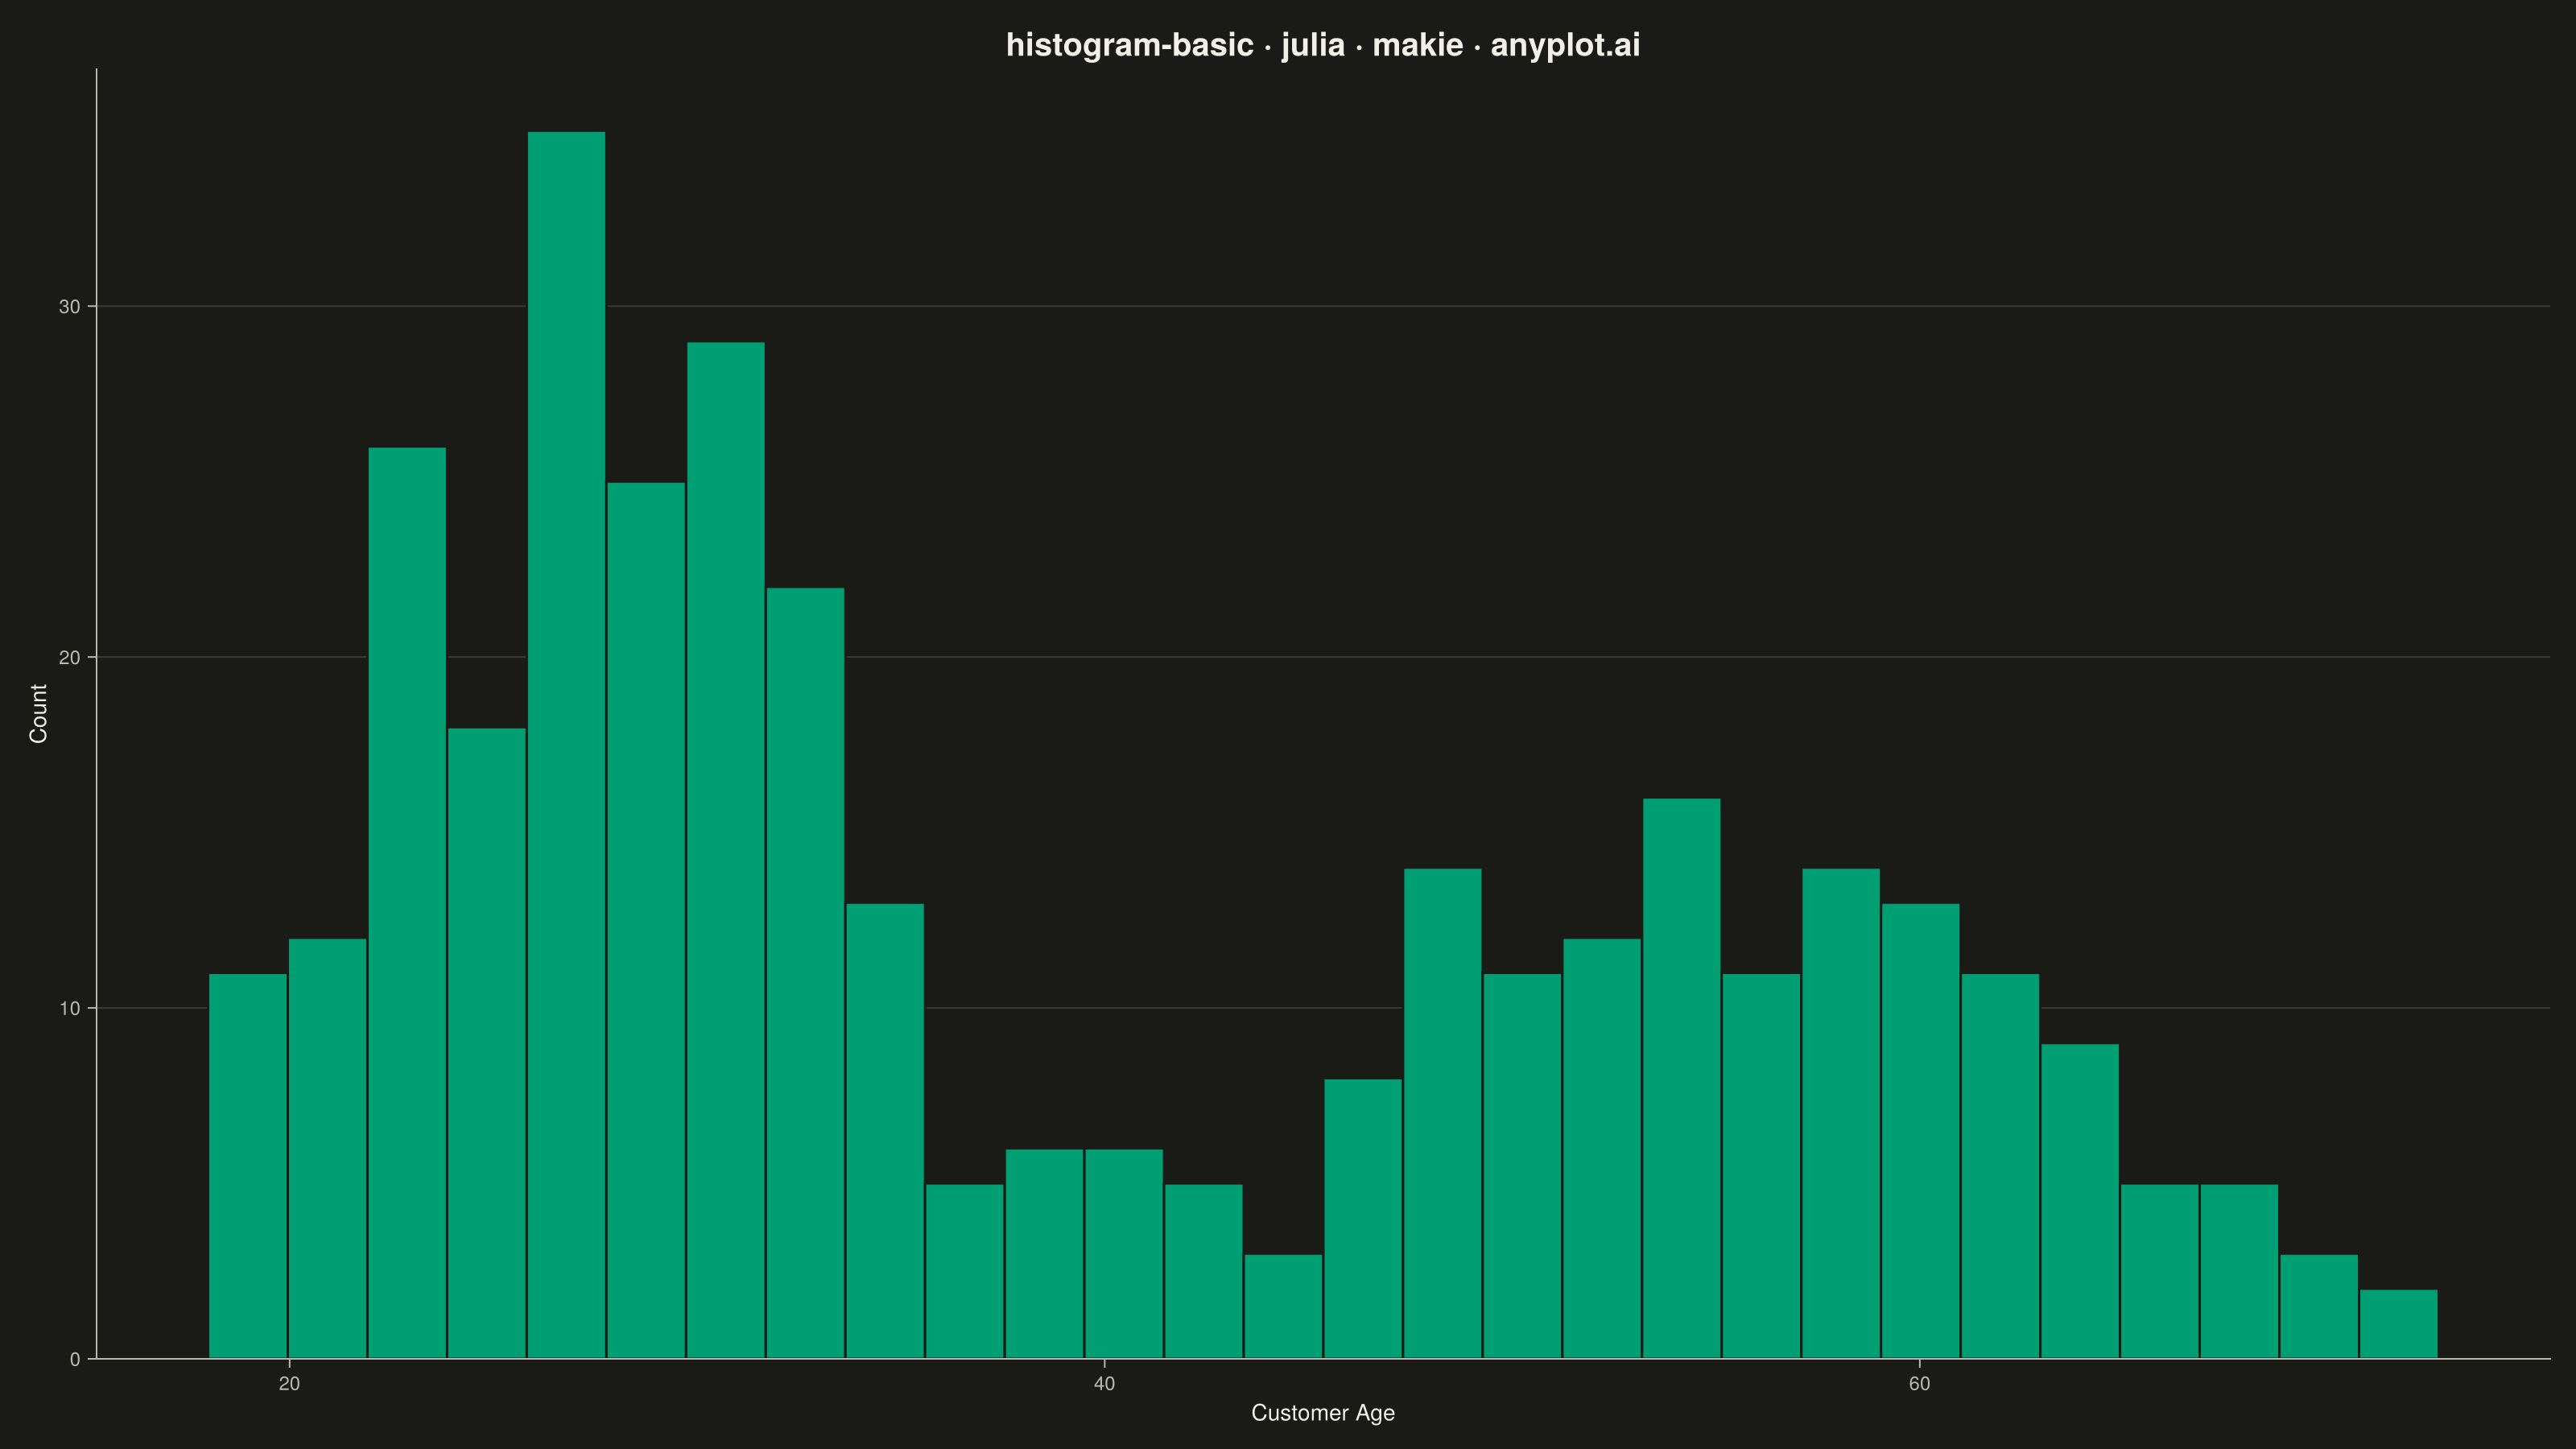
A histogram displays the distribution of a single continuous variable by dividing the data range into bins and showing the frequency (count) of observations in each bin. It reveals the shape of the data distribution, including central tendency, spread, and presence of outliers or multiple modes.
# anyplot.ai
# histogram-basic: Basic Histogram
# Library: makie 0.22.10 | Julia 1.11.9
# Quality: 89/100 | Created: 2026-05-28

using CairoMakie
using Colors
using Random

Random.seed!(42)

# Theme tokens
const THEME   = get(ENV, "ANYPLOT_THEME", "light")
const PAGE_BG = THEME == "light" ? colorant"#FAF8F1" : colorant"#1A1A17"
const INK     = THEME == "light" ? colorant"#1A1A17" : colorant"#F0EFE8"
const INK_SOFT = THEME == "light" ? colorant"#4A4A44" : colorant"#B8B7B0"
const BRAND   = colorant"#009E73"

# Data — customer age distribution (bimodal: young adults + mid-career segment)
ages_young  = randn(200) .* 5 .+ 28
ages_mid    = randn(150) .* 8 .+ 55
ages        = vcat(ages_young, ages_mid)
ages        = clamp.(ages, 18, 75)

# Plot
fig = Figure(
    resolution      = (1600, 900),
    fontsize        = 14,
    backgroundcolor = PAGE_BG,
)

ax = Axis(
    fig[1, 1];
    title             = "histogram-basic · julia · makie · anyplot.ai",
    titlesize         = 22,
    titlecolor        = INK,
    xlabel            = "Customer Age",
    ylabel            = "Count",
    xlabelsize        = 14,
    ylabelsize        = 14,
    xlabelcolor       = INK,
    ylabelcolor       = INK,
    xticklabelsize    = 12,
    yticklabelsize    = 12,
    xticklabelcolor   = INK_SOFT,
    yticklabelcolor   = INK_SOFT,
    xtickcolor        = INK_SOFT,
    ytickcolor        = INK_SOFT,
    backgroundcolor   = PAGE_BG,
    topspinevisible   = false,
    rightspinevisible = false,
    leftspinecolor    = INK_SOFT,
    bottomspinecolor  = INK_SOFT,
    xgridvisible      = false,
    ygridcolor        = RGBAf(INK.r, INK.g, INK.b, 0.15f0),
    yminorgridvisible = false,
    xminorgridvisible = false,
)

hist!(ax, ages;
    bins        = 28,
    color       = BRAND,
    strokecolor = PAGE_BG,
    strokewidth = 1.5,
)

# Bimodal valley reference line separating the two customer segments
vlines!(ax, [42.0]; color = INK_SOFT, linestyle = :dash, linewidth = 1.5)

# Segment annotations above each distribution peak
text!(ax, 27.0, 37.0; text = "Young Adult\nSegment", color = INK,
    fontsize = 12, align = (:center, :bottom))
text!(ax, 55.0, 19.0; text = "Mid-Career\nSegment", color = INK,
    fontsize = 12, align = (:center, :bottom))

ylims!(ax, 0, 52)

# Save
save("plot-$(THEME).png", fig; px_per_unit = 2)
Runnable source as JSON, for any HTTP client: https://api.anyplot.ai/specs/histogram-basic/makie/code. Any spec id and library id listed in llms-full.txt fit the same URL shape; every URL below is complete and callable.
{
  "spec_id": "histogram-basic",
  "language": "julia",
  "library": "makie",
  "page": "https://anyplot.ai/histogram-basic/julia/makie",
  "hub": "https://anyplot.ai/histogram-basic",
  "code_json": "https://api.anyplot.ai/specs/histogram-basic/makie/code",
  "spec_json": "https://api.anyplot.ai/specs/histogram-basic",
  "render_light_png": "https://storage.googleapis.com/anyplot-images/plots/histogram-basic/julia/makie/plot-light.png",
  "render_dark_png": "https://storage.googleapis.com/anyplot-images/plots/histogram-basic/julia/makie/plot-dark.png",
  "quality_score": 89.0,
  "license": "MIT",
  "guide": "https://anyplot.ai/llms.txt"
}
Part of Basic Histogram on anyplot.ai.