The same plot in 14 other libraries — JavaScript: Chart.js, D3.js, Apache ECharts, Highcharts; Python: Altair, Bokeh, lets-plot, Matplotlib, Plotly, plotnine, Pygal, Seaborn; R: ggplot2; Julia: Makie.jl. Compare all 15 side by side: Basic Histogram in Python, R, Julia and JavaScript.
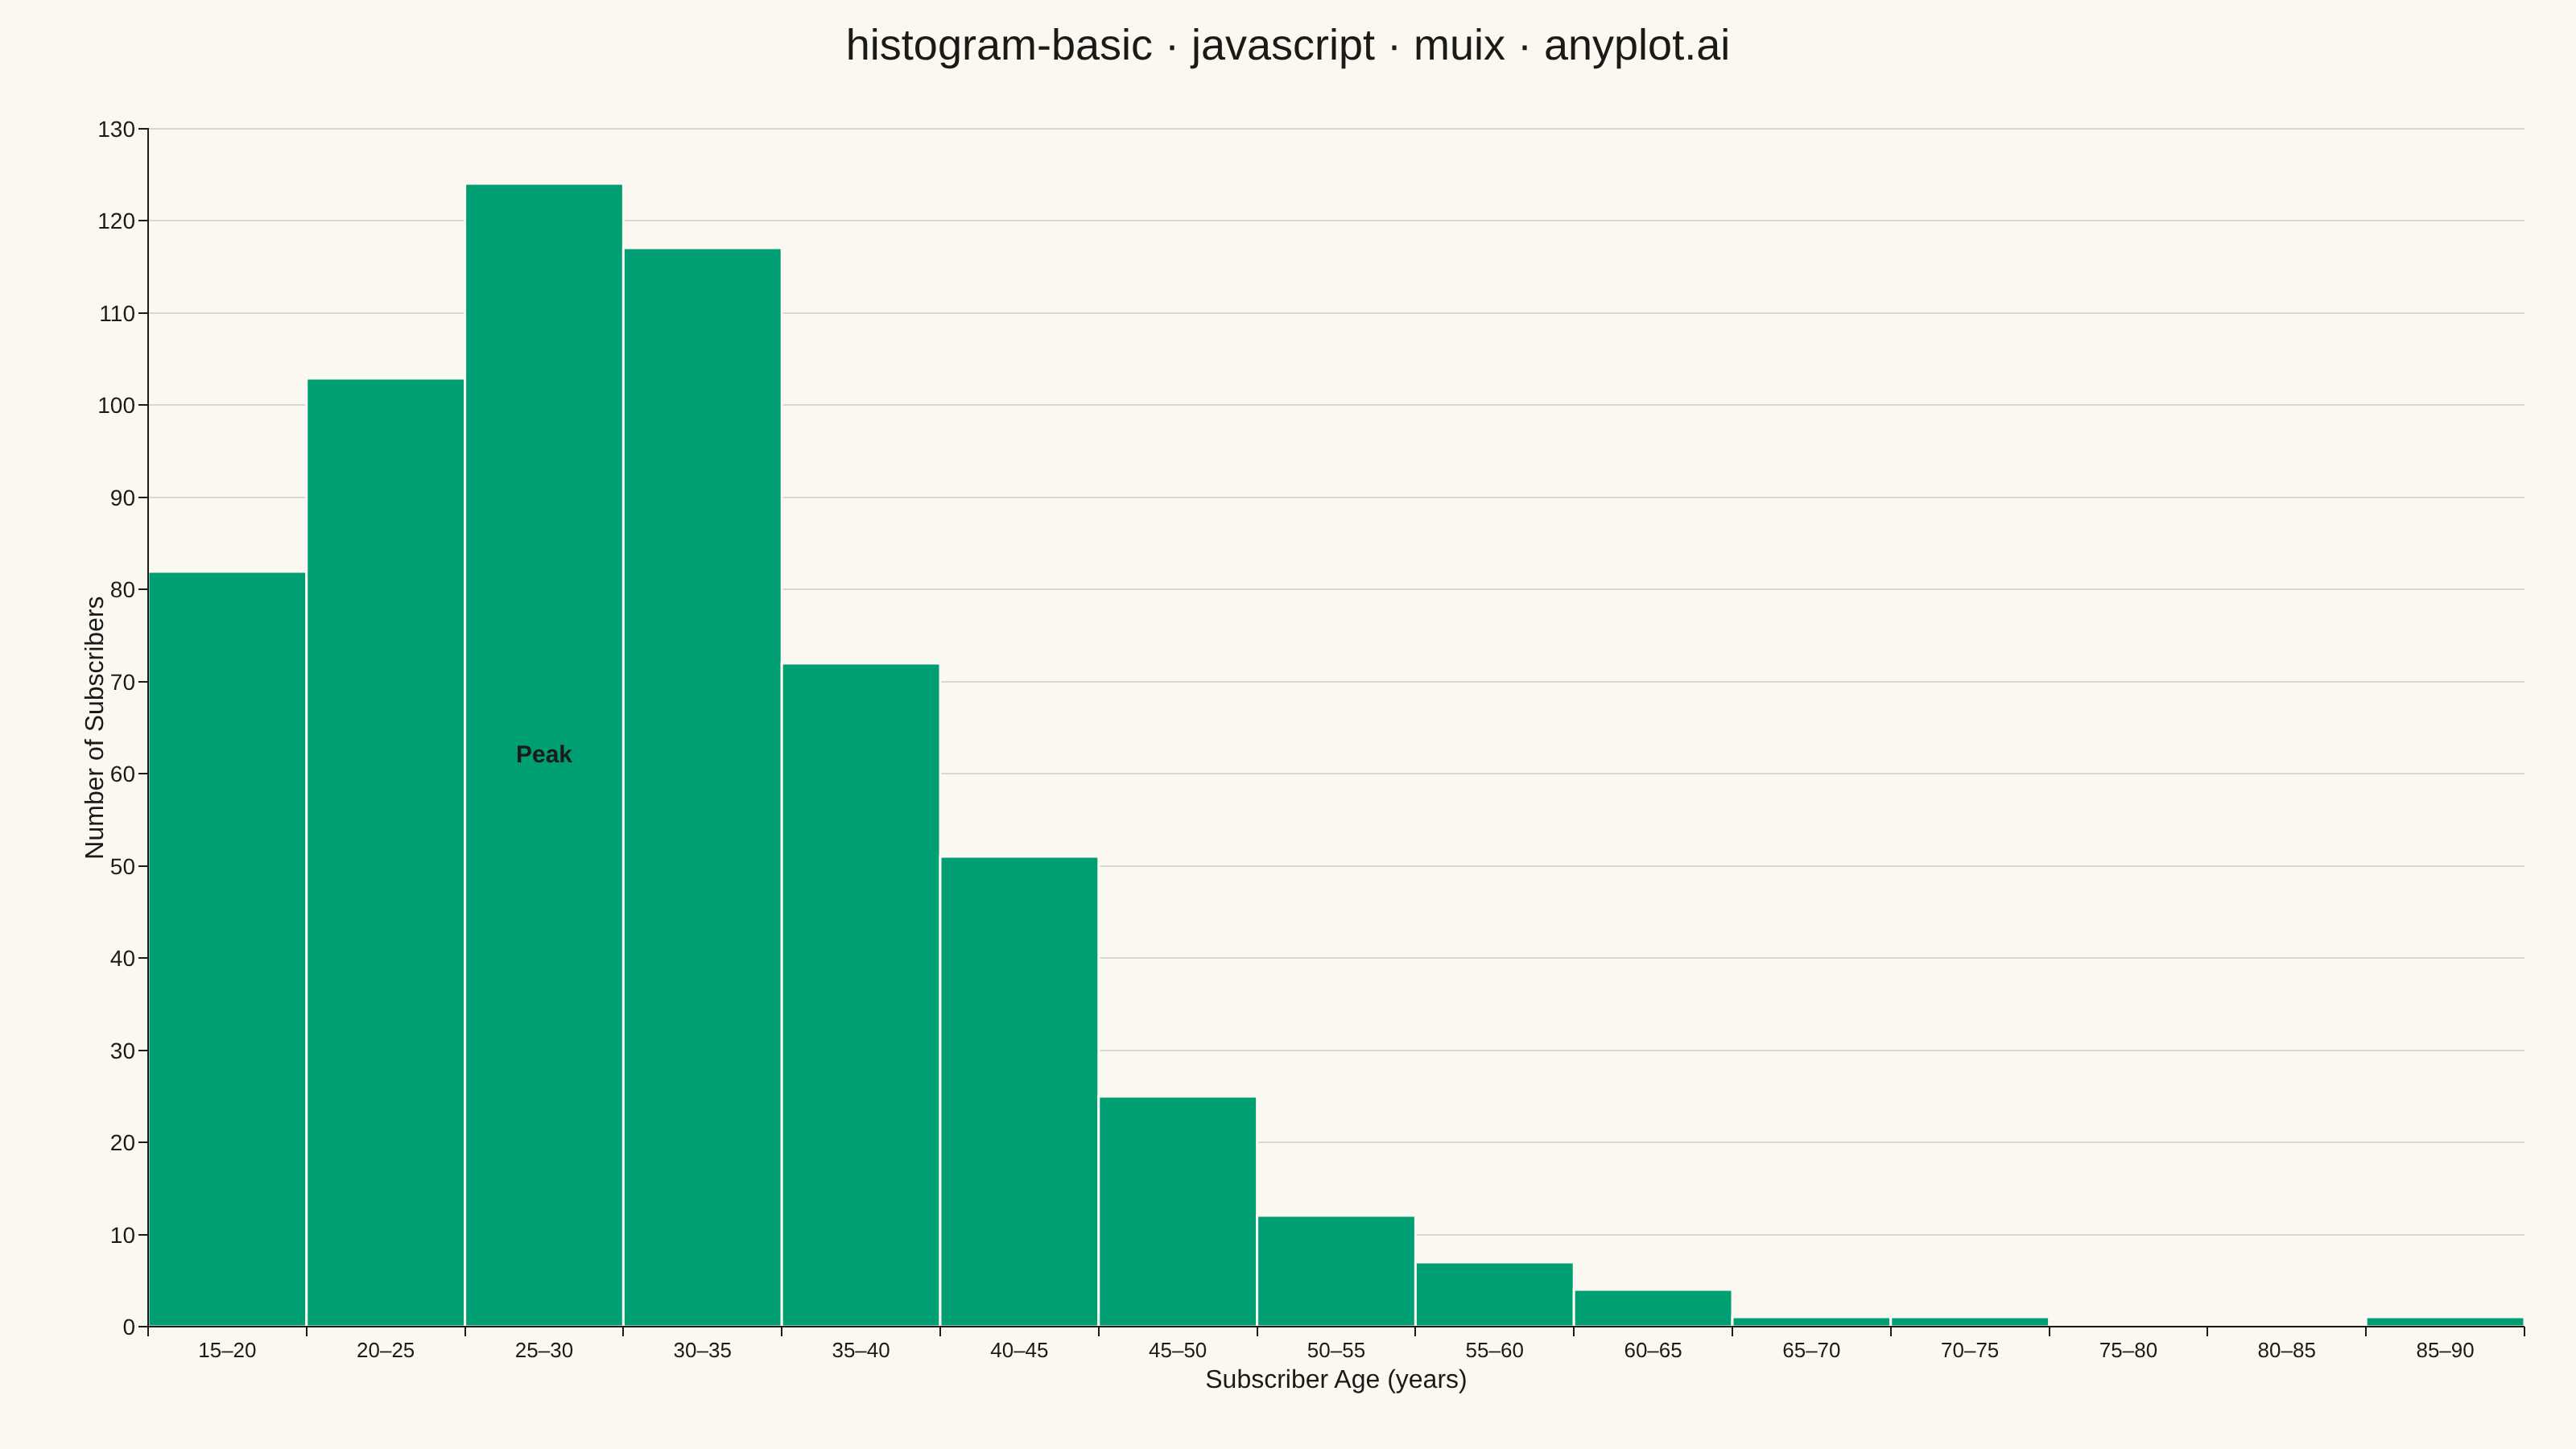
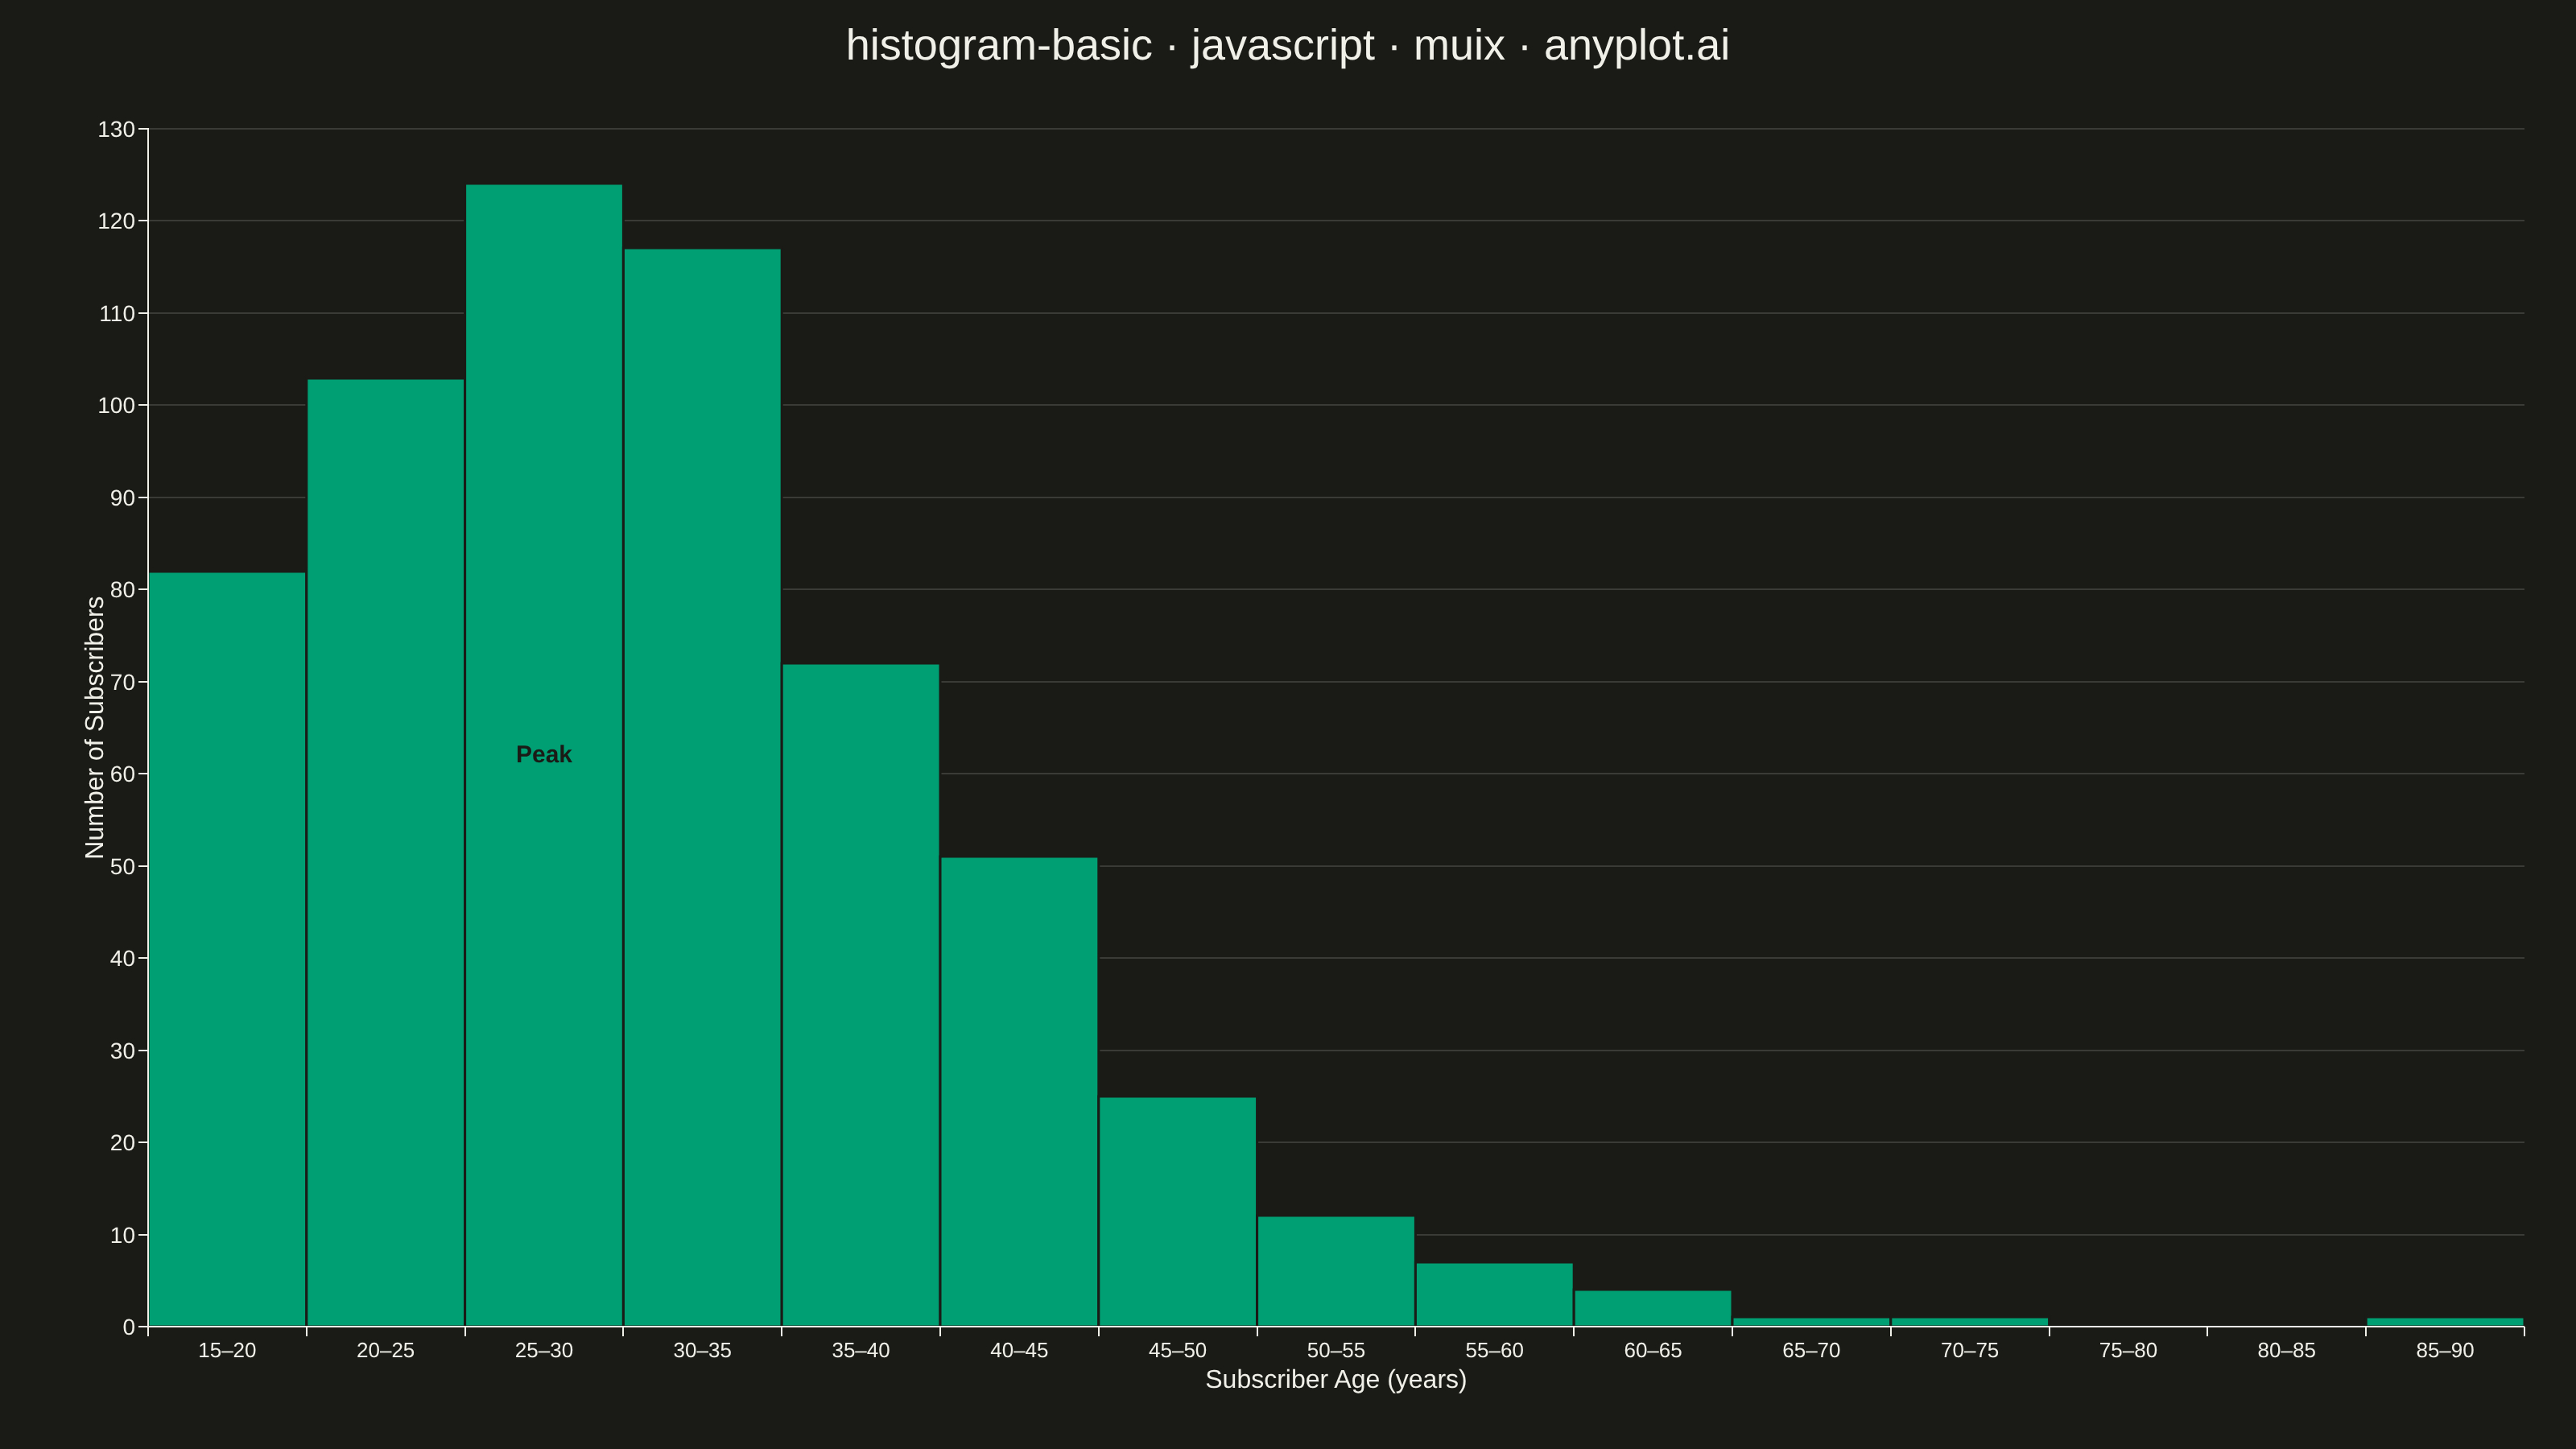
A histogram displays the distribution of a single continuous variable by dividing the data range into bins and showing the frequency (count) of observations in each bin. It reveals the shape of the data distribution, including central tendency, spread, and presence of outliers or multiple modes.
// anyplot.ai
// histogram-basic: Basic Histogram
// Library: muix 7.29.1 | JavaScript 22.23.2
// Quality: 89/100 | Created: 2026-08-26
import { BarChart } from "@mui/x-charts/BarChart";

const t = window.ANYPLOT_TOKENS;
const TITLE = "histogram-basic · javascript · muix · anyplot.ai";
const TITLE_HEIGHT = 56;

// --- Data (in-memory, deterministic): subscriber ages for a streaming service
// Deterministic LCG so the sampled distribution is stable across renders —
// the browser has no seeded Math.random().
function makeLcg(seed) {
  let state = seed >>> 0;
  return function next() {
    state = (state * 1664525 + 1013904223) >>> 0;
    return state / 4294967296;
  };
}
const rand = makeLcg(42);
function gaussianSample() {
  const u1 = Math.max(rand(), 1e-9);
  const u2 = rand();
  return Math.sqrt(-2 * Math.log(u1)) * Math.cos(2 * Math.PI * u2);
}

// Log-normal draw: a young-skewed subscriber base with a long tail of older
// loyal customers, rather than a perfectly symmetric bell curve.
const SAMPLE_COUNT = 600;
const LOG_MU = Math.log(29);
const LOG_SIGMA = 0.34;
const ages = Array.from({ length: SAMPLE_COUNT }, () => {
  const raw = Math.exp(LOG_MU + LOG_SIGMA * gaussianSample());
  return Math.round(Math.min(85, Math.max(16, raw)));
});

// Bin into 5-year age brackets covering the observed range.
const BIN_WIDTH = 5;
const minAge = Math.min(...ages);
const maxAge = Math.max(...ages);
const binStart = Math.floor(minAge / BIN_WIDTH) * BIN_WIDTH;
const binEnd = Math.ceil((maxAge + 1) / BIN_WIDTH) * BIN_WIDTH;
const binCount = (binEnd - binStart) / BIN_WIDTH;
const binLabels = Array.from(
  { length: binCount },
  (_, i) => `${binStart + i * BIN_WIDTH}–${binStart + (i + 1) * BIN_WIDTH}`,
);
const counts = new Array(binCount).fill(0);
ages.forEach((age) => {
  const idx = Math.min(binCount - 1, Math.floor((age - binStart) / BIN_WIDTH));
  counts[idx] += 1;
});

// Call out the modal bin so the shape of the distribution reads at a glance,
// not just from bar heights alone.
const peakIndex = counts.indexOf(Math.max(...counts));
const PEAK_LABEL_COLOR = "#1A1A17"; // fixed (not theme-adaptive): stays legible on the brand-green bar in both themes

// --- Chart (default-exported component — the harness mounts it) -------------
export default function Chart() {
  const { width, height } = window.ANYPLOT_SIZE;
  const chartHeight = height - TITLE_HEIGHT;

  return (
    <div style={{ width, height }}>
      <div
        style={{
          height: TITLE_HEIGHT,
          lineHeight: `${TITLE_HEIGHT}px`,
          textAlign: "center",
          fontSize: 27,
          fontWeight: 500,
          color: t.ink,
        }}
      >
        {TITLE}
      </div>
      <BarChart
        width={width}
        height={chartHeight}
        skipAnimation
        barLabel={(item) => (item.dataIndex === peakIndex ? "Peak" : undefined)}
        series={[
          {
            data: counts,
            label: "Subscribers",
            color: t.palette[0],
            valueFormatter: (v) => `${v} subscribers`,
          },
        ]}
        xAxis={[
          {
            scaleType: "band",
            data: binLabels,
            label: "Subscriber Age (years)",
            labelStyle: { fontSize: 16, fontWeight: 500 },
            tickLabelStyle: { fontSize: 13 },
            // No gap between bins — a histogram's bars are contiguous by
            // convention; the stroke below (sx) draws the bin-edge lines.
            categoryGapRatio: 0,
          },
        ]}
        yAxis={[
          {
            min: 0,
            label: "Number of Subscribers",
            labelStyle: { fontSize: 16, fontWeight: 500 },
            tickLabelStyle: { fontSize: 14 },
          },
        ]}
        grid={{ horizontal: true }}
        margin={{ left: 92, right: 32, top: 24, bottom: 76 }}
        slotProps={{ legend: { hidden: true } }}
        sx={{
          "& .MuiBarElement-root": { stroke: t.pageBg, strokeWidth: 1.5 },
          "& .MuiBarLabel-root": {
            fill: PEAK_LABEL_COLOR,
            fontWeight: 700,
            fontSize: "15px",
          },
          "& .MuiChartsAxis-tickLabel": { fontSize: "13px" },
        }}
      />
    </div>
  );
}
Runnable source as JSON, for any HTTP client: https://api.anyplot.ai/specs/histogram-basic/muix/code. Any spec id and library id listed in llms-full.txt fit the same URL shape; every URL below is complete and callable.
{
  "spec_id": "histogram-basic",
  "language": "javascript",
  "library": "muix",
  "page": "https://anyplot.ai/histogram-basic/javascript/muix",
  "hub": "https://anyplot.ai/histogram-basic",
  "code_json": "https://api.anyplot.ai/specs/histogram-basic/muix/code",
  "spec_json": "https://api.anyplot.ai/specs/histogram-basic",
  "render_light_png": "https://storage.googleapis.com/anyplot-images/plots/histogram-basic/javascript/muix/plot-light.png",
  "render_dark_png": "https://storage.googleapis.com/anyplot-images/plots/histogram-basic/javascript/muix/plot-dark.png",
  "interactive_light_html": "https://storage.googleapis.com/anyplot-images/plots/histogram-basic/javascript/muix/plot-light.html",
  "interactive_dark_html": "https://storage.googleapis.com/anyplot-images/plots/histogram-basic/javascript/muix/plot-dark.html",
  "quality_score": 89.0,
  "license": "MIT",
  "guide": "https://anyplot.ai/llms.txt"
}
Part of Basic Histogram on anyplot.ai.