The same plot in 14 other libraries — JavaScript: D3.js, Apache ECharts, Highcharts, MUI X Charts; Python: Altair, Bokeh, lets-plot, Matplotlib, Plotly, plotnine, Pygal, Seaborn; R: ggplot2; Julia: Makie.jl. Compare all 15 side by side: Basic Histogram in Python, R, Julia and JavaScript.
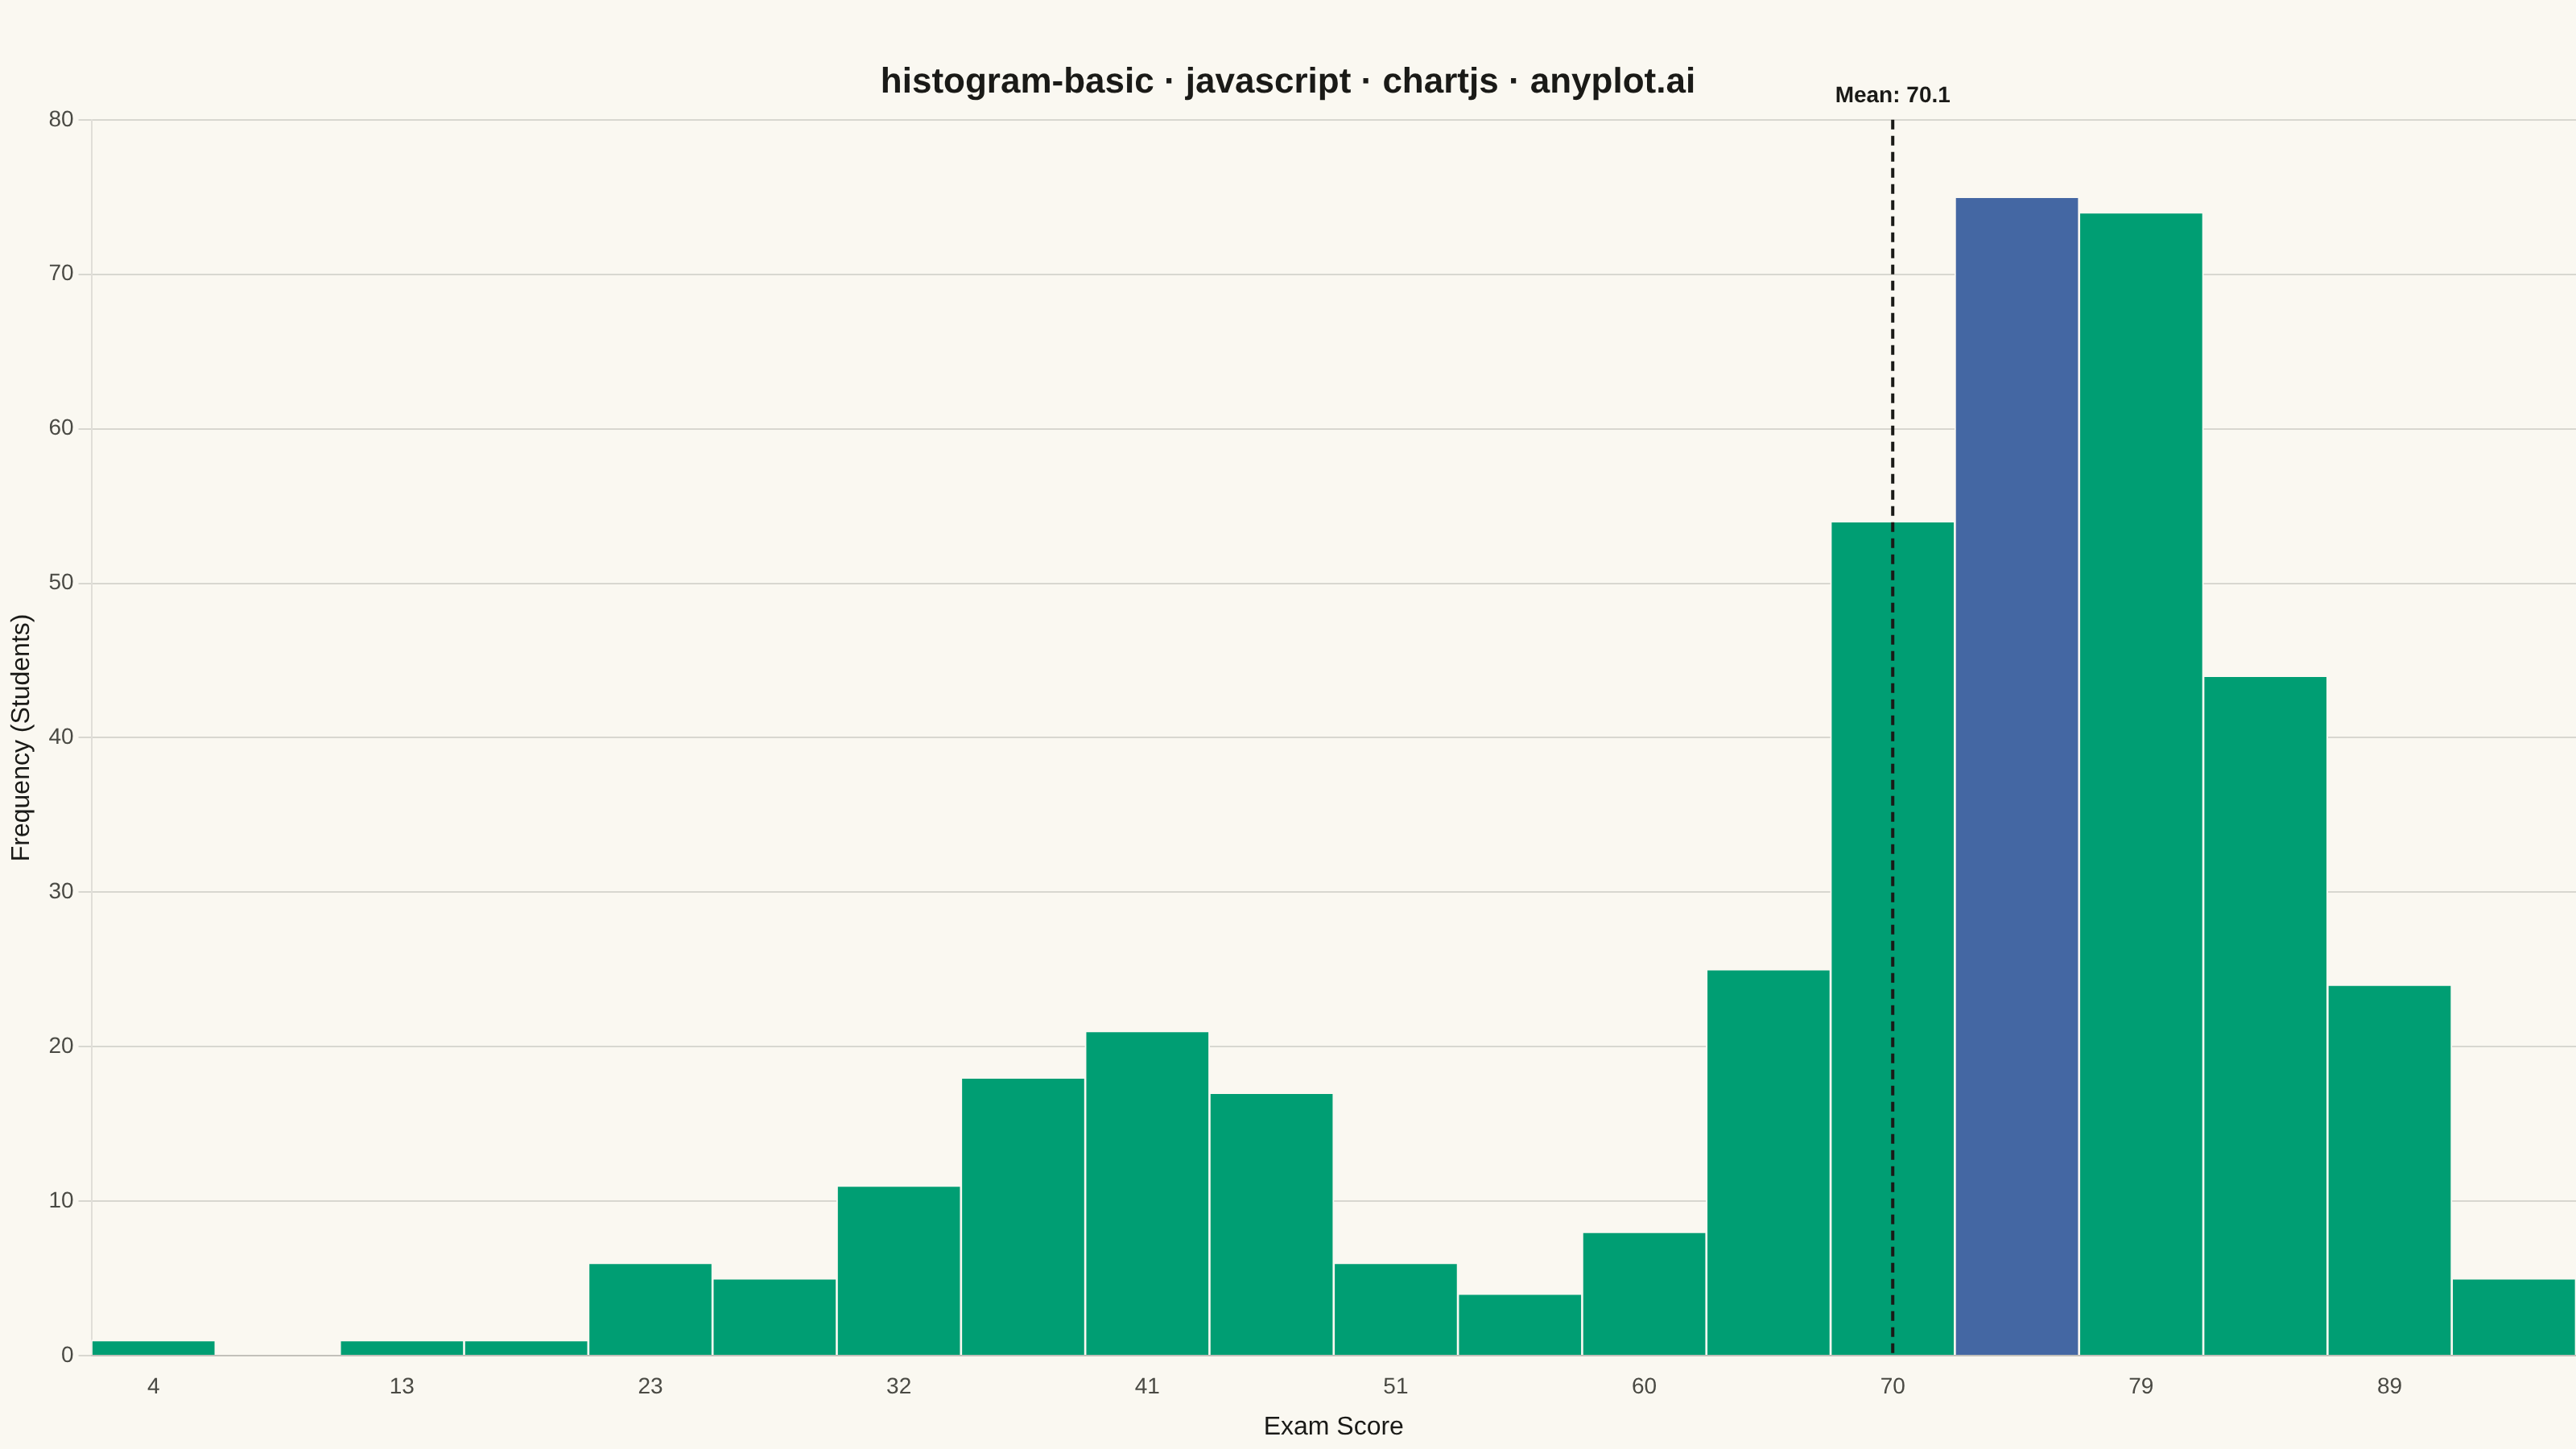
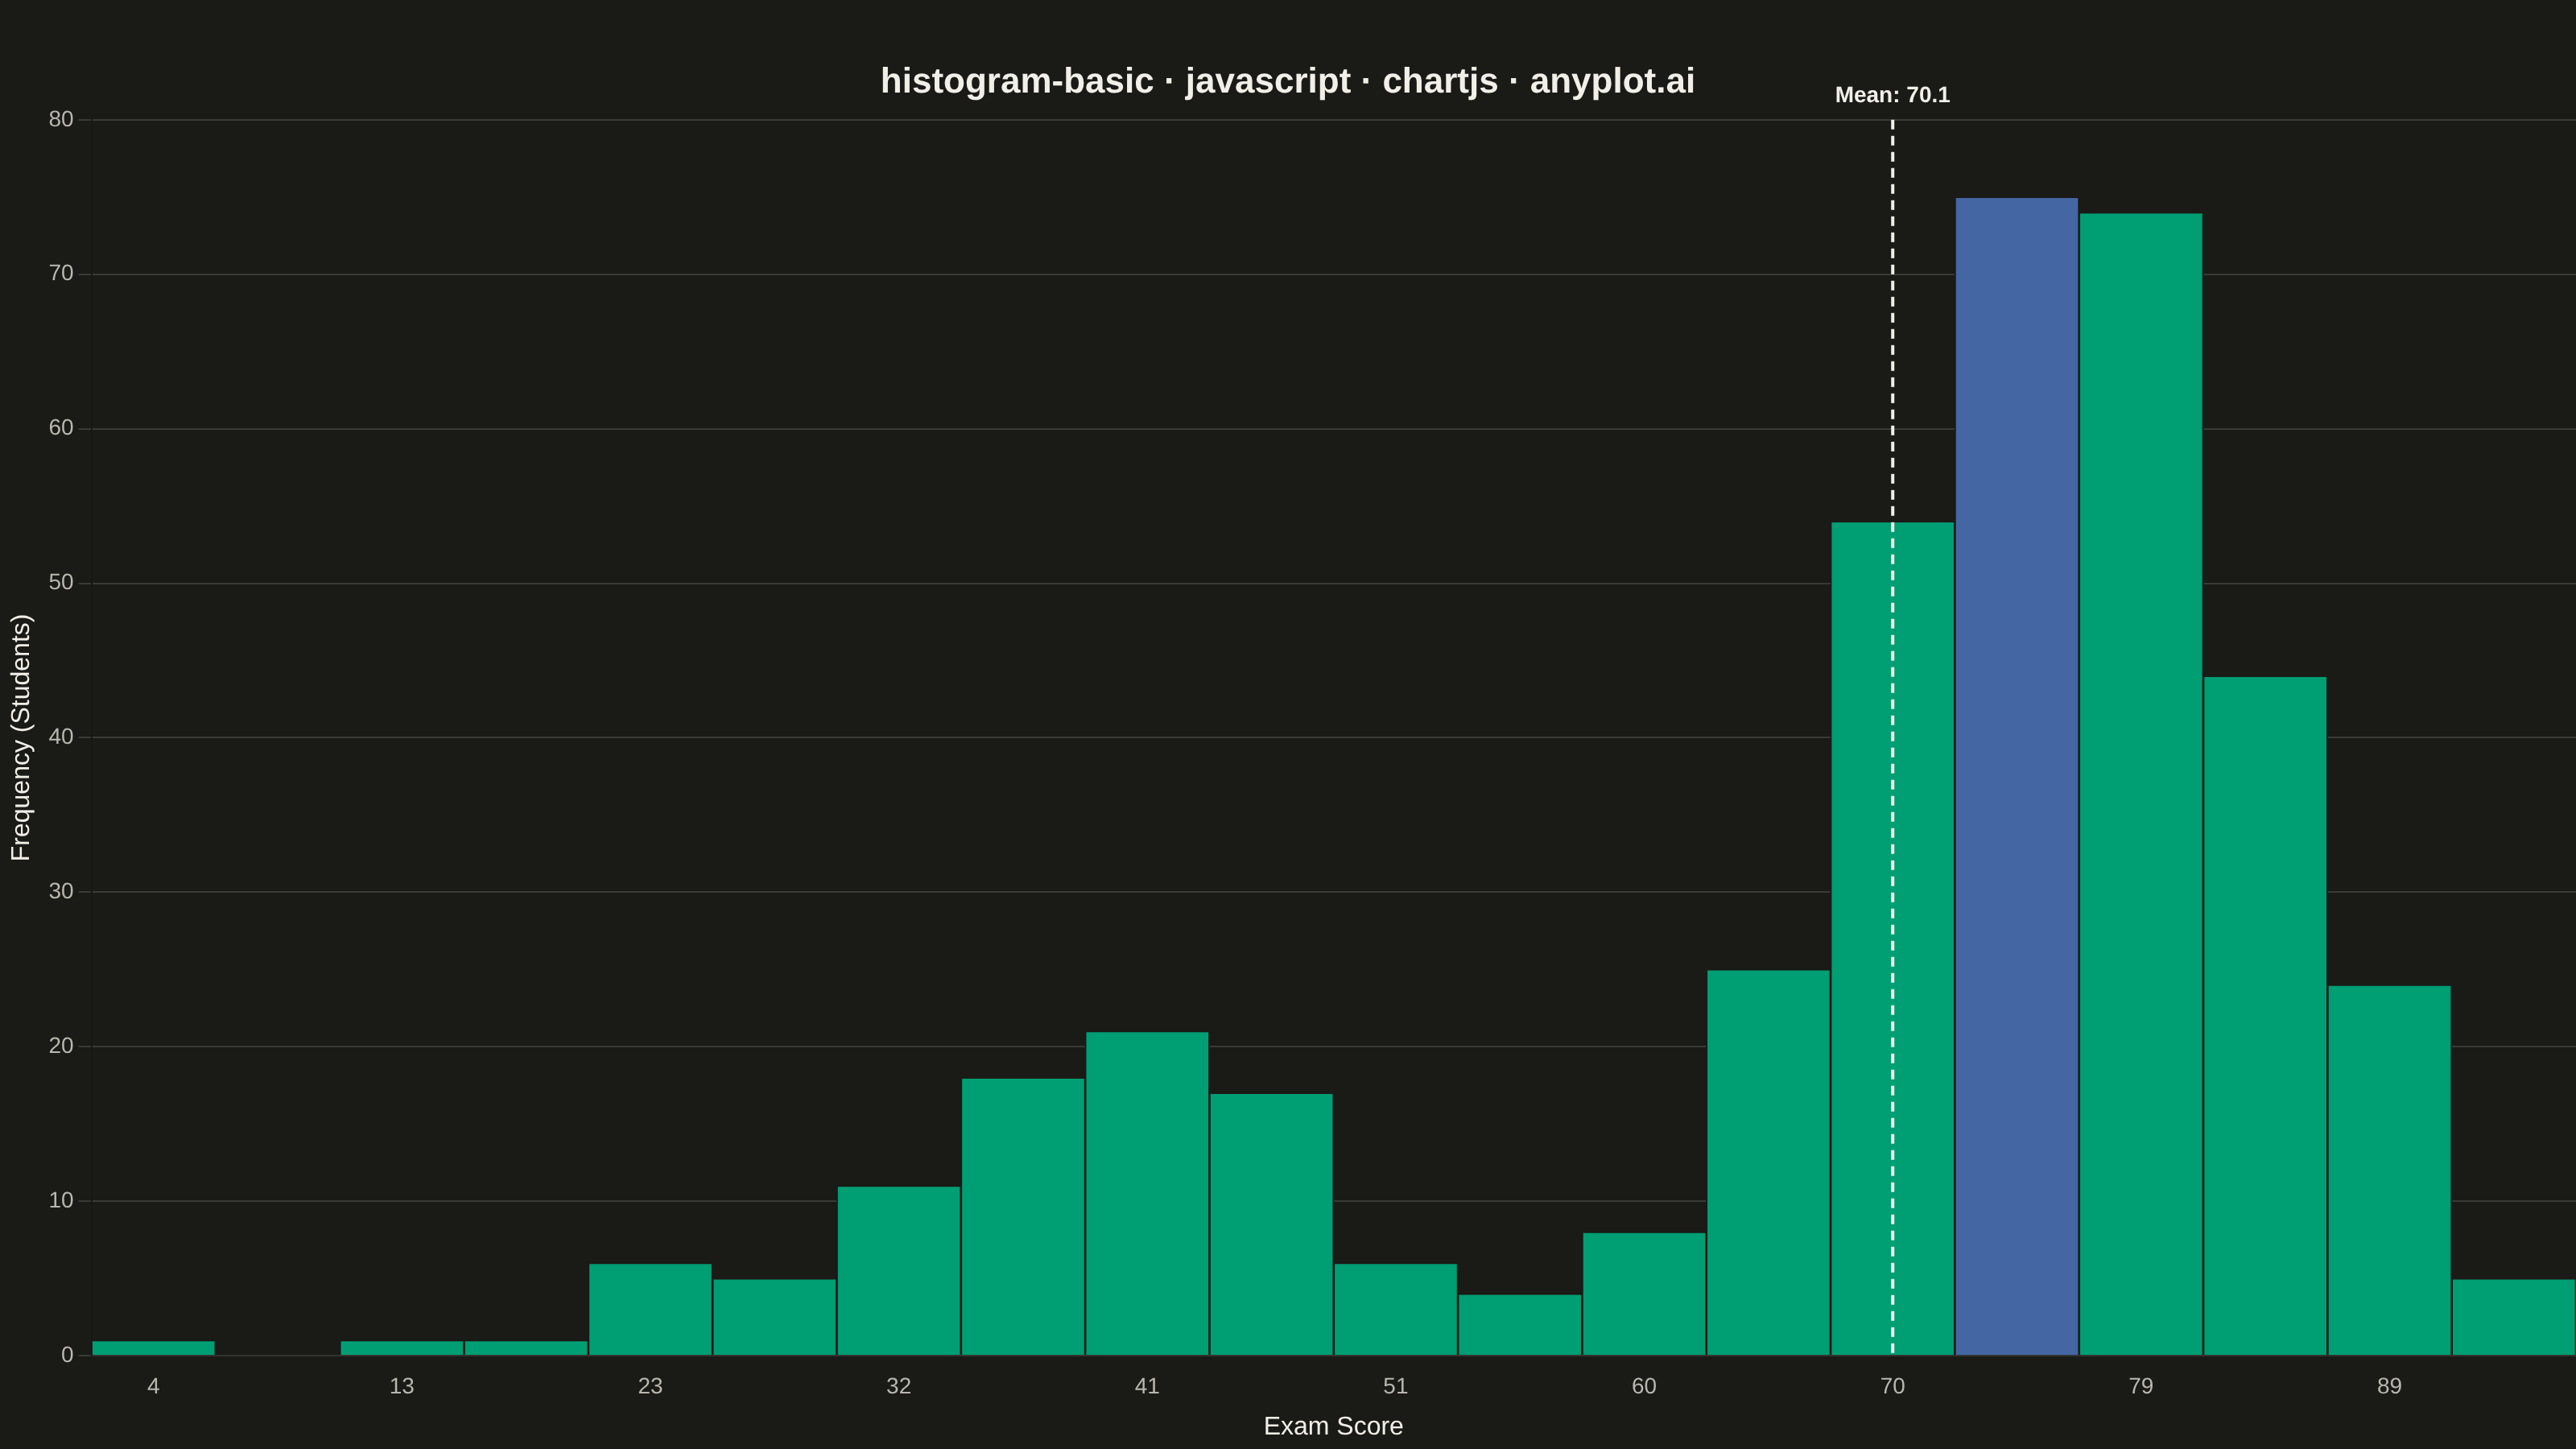
A histogram displays the distribution of a single continuous variable by dividing the data range into bins and showing the frequency (count) of observations in each bin. It reveals the shape of the data distribution, including central tendency, spread, and presence of outliers or multiple modes.
// anyplot.ai
// histogram-basic: Basic Histogram
// Library: chartjs 4.4.7 | JavaScript 22.23.2
// Quality: 91/100 | Created: 2026-08-26

const t = window.ANYPLOT_TOKENS;

// --- Data (in-memory, deterministic) ---------------------------------------
function makeLcg(seed) {
  let state = seed >>> 0;
  return function lcg() {
    state = (1664525 * state + 1013904223) >>> 0;
    return state / 4294967296;
  };
}

function normal(rand, mean, stdDev) {
  let sum = 0;
  for (let i = 0; i < 12; i++) sum += rand();
  return mean + (sum - 6) * stdDev;
}

const rand = makeLcg(42);
const examScores = [];
for (let i = 0; i < 400; i++) {
  // Most students cluster near a strong score; a clearly separated,
  // sizeable group struggles, producing a legible second mode near 40.
  const score = rand() < 0.8 ? normal(rand, 78, 8) : normal(rand, 40, 10);
  examScores.push(Math.max(0, Math.min(100, score)));
}

// --- Binning -----------------------------------------------------------------
const binCount = 20;
const minScore = Math.min(...examScores);
const maxScore = Math.max(...examScores);
const binWidth = (maxScore - minScore) / binCount;
const counts = new Array(binCount).fill(0);
examScores.forEach((score) => {
  const idx = Math.min(binCount - 1, Math.floor((score - minScore) / binWidth));
  counts[idx]++;
});
const labels = counts.map((_, i) => Math.round(minScore + i * binWidth));

// The tallest bin gets a two-tone accent to call out the most common range;
// the mean-score bin gets a dashed reference line (custom plugin below).
const modalIndex = counts.indexOf(Math.max(...counts));
const meanScore = examScores.reduce((sum, v) => sum + v, 0) / examScores.length;
const meanBinIndex = Math.min(
  binCount - 1,
  Math.floor((meanScore - minScore) / binWidth)
);
const barColors = counts.map((_, i) => (i === modalIndex ? t.palette[2] : t.palette[0]));

// --- Mount -----------------------------------------------------------------
const canvas = document.createElement("canvas");
document.getElementById("container").appendChild(canvas);

// --- Custom plugin: dashed mean-score reference line ------------------------
const meanLinePlugin = {
  id: "meanLine",
  afterDatasetsDraw(chart) {
    const bar = chart.getDatasetMeta(0).data[meanBinIndex];
    if (!bar) return;
    const { ctx, chartArea } = chart;
    const x = Math.min(Math.max(bar.x, chartArea.left + 45), chartArea.right - 45);
    ctx.save();
    ctx.strokeStyle = t.ink;
    ctx.lineWidth = 2;
    ctx.setLineDash([6, 4]);
    ctx.beginPath();
    ctx.moveTo(x, chartArea.top);
    ctx.lineTo(x, chartArea.bottom);
    ctx.stroke();
    ctx.setLineDash([]);
    ctx.fillStyle = t.ink;
    ctx.font = "bold 14px sans-serif";
    ctx.textAlign = "center";
    ctx.textBaseline = "bottom";
    ctx.fillText(`Mean: ${meanScore.toFixed(1)}`, x, chartArea.top - 8);
    ctx.restore();
  },
};

// --- Chart -----------------------------------------------------------------
new Chart(canvas, {
  type: "bar",
  data: {
    labels,
    datasets: [
      {
        label: "Frequency",
        data: counts,
        backgroundColor: barColors,
        borderColor: t.pageBg,
        borderWidth: 1,
        categoryPercentage: 1.0,
        barPercentage: 1.0,
      },
    ],
  },
  options: {
    responsive: true,
    maintainAspectRatio: false,
    animation: false,
    layout: {
      padding: { top: 28 },
    },
    plugins: {
      title: {
        display: true,
        text: "histogram-basic · javascript · chartjs · anyplot.ai",
        color: t.ink,
        font: { size: 22 },
      },
      legend: { display: false },
    },
    scales: {
      x: {
        ticks: {
          color: t.inkSoft,
          font: { size: 14 },
          autoSkip: true,
          maxTicksLimit: 10,
        },
        grid: { display: false },
        title: {
          display: true,
          text: "Exam Score",
          color: t.ink,
          font: { size: 16 },
        },
      },
      y: {
        beginAtZero: true,
        ticks: { color: t.inkSoft, font: { size: 14 } },
        grid: { color: t.grid },
        title: {
          display: true,
          text: "Frequency (Students)",
          color: t.ink,
          font: { size: 16 },
        },
      },
    },
  },
  plugins: [meanLinePlugin],
});
Runnable source as JSON, for any HTTP client: https://api.anyplot.ai/specs/histogram-basic/chartjs/code. Any spec id and library id listed in llms-full.txt fit the same URL shape; every URL below is complete and callable.
{
  "spec_id": "histogram-basic",
  "language": "javascript",
  "library": "chartjs",
  "page": "https://anyplot.ai/histogram-basic/javascript/chartjs",
  "hub": "https://anyplot.ai/histogram-basic",
  "code_json": "https://api.anyplot.ai/specs/histogram-basic/chartjs/code",
  "spec_json": "https://api.anyplot.ai/specs/histogram-basic",
  "render_light_png": "https://storage.googleapis.com/anyplot-images/plots/histogram-basic/javascript/chartjs/plot-light.png",
  "render_dark_png": "https://storage.googleapis.com/anyplot-images/plots/histogram-basic/javascript/chartjs/plot-dark.png",
  "interactive_light_html": "https://storage.googleapis.com/anyplot-images/plots/histogram-basic/javascript/chartjs/plot-light.html",
  "interactive_dark_html": "https://storage.googleapis.com/anyplot-images/plots/histogram-basic/javascript/chartjs/plot-dark.html",
  "quality_score": 91.0,
  "license": "MIT",
  "guide": "https://anyplot.ai/llms.txt"
}
Part of Basic Histogram on anyplot.ai.