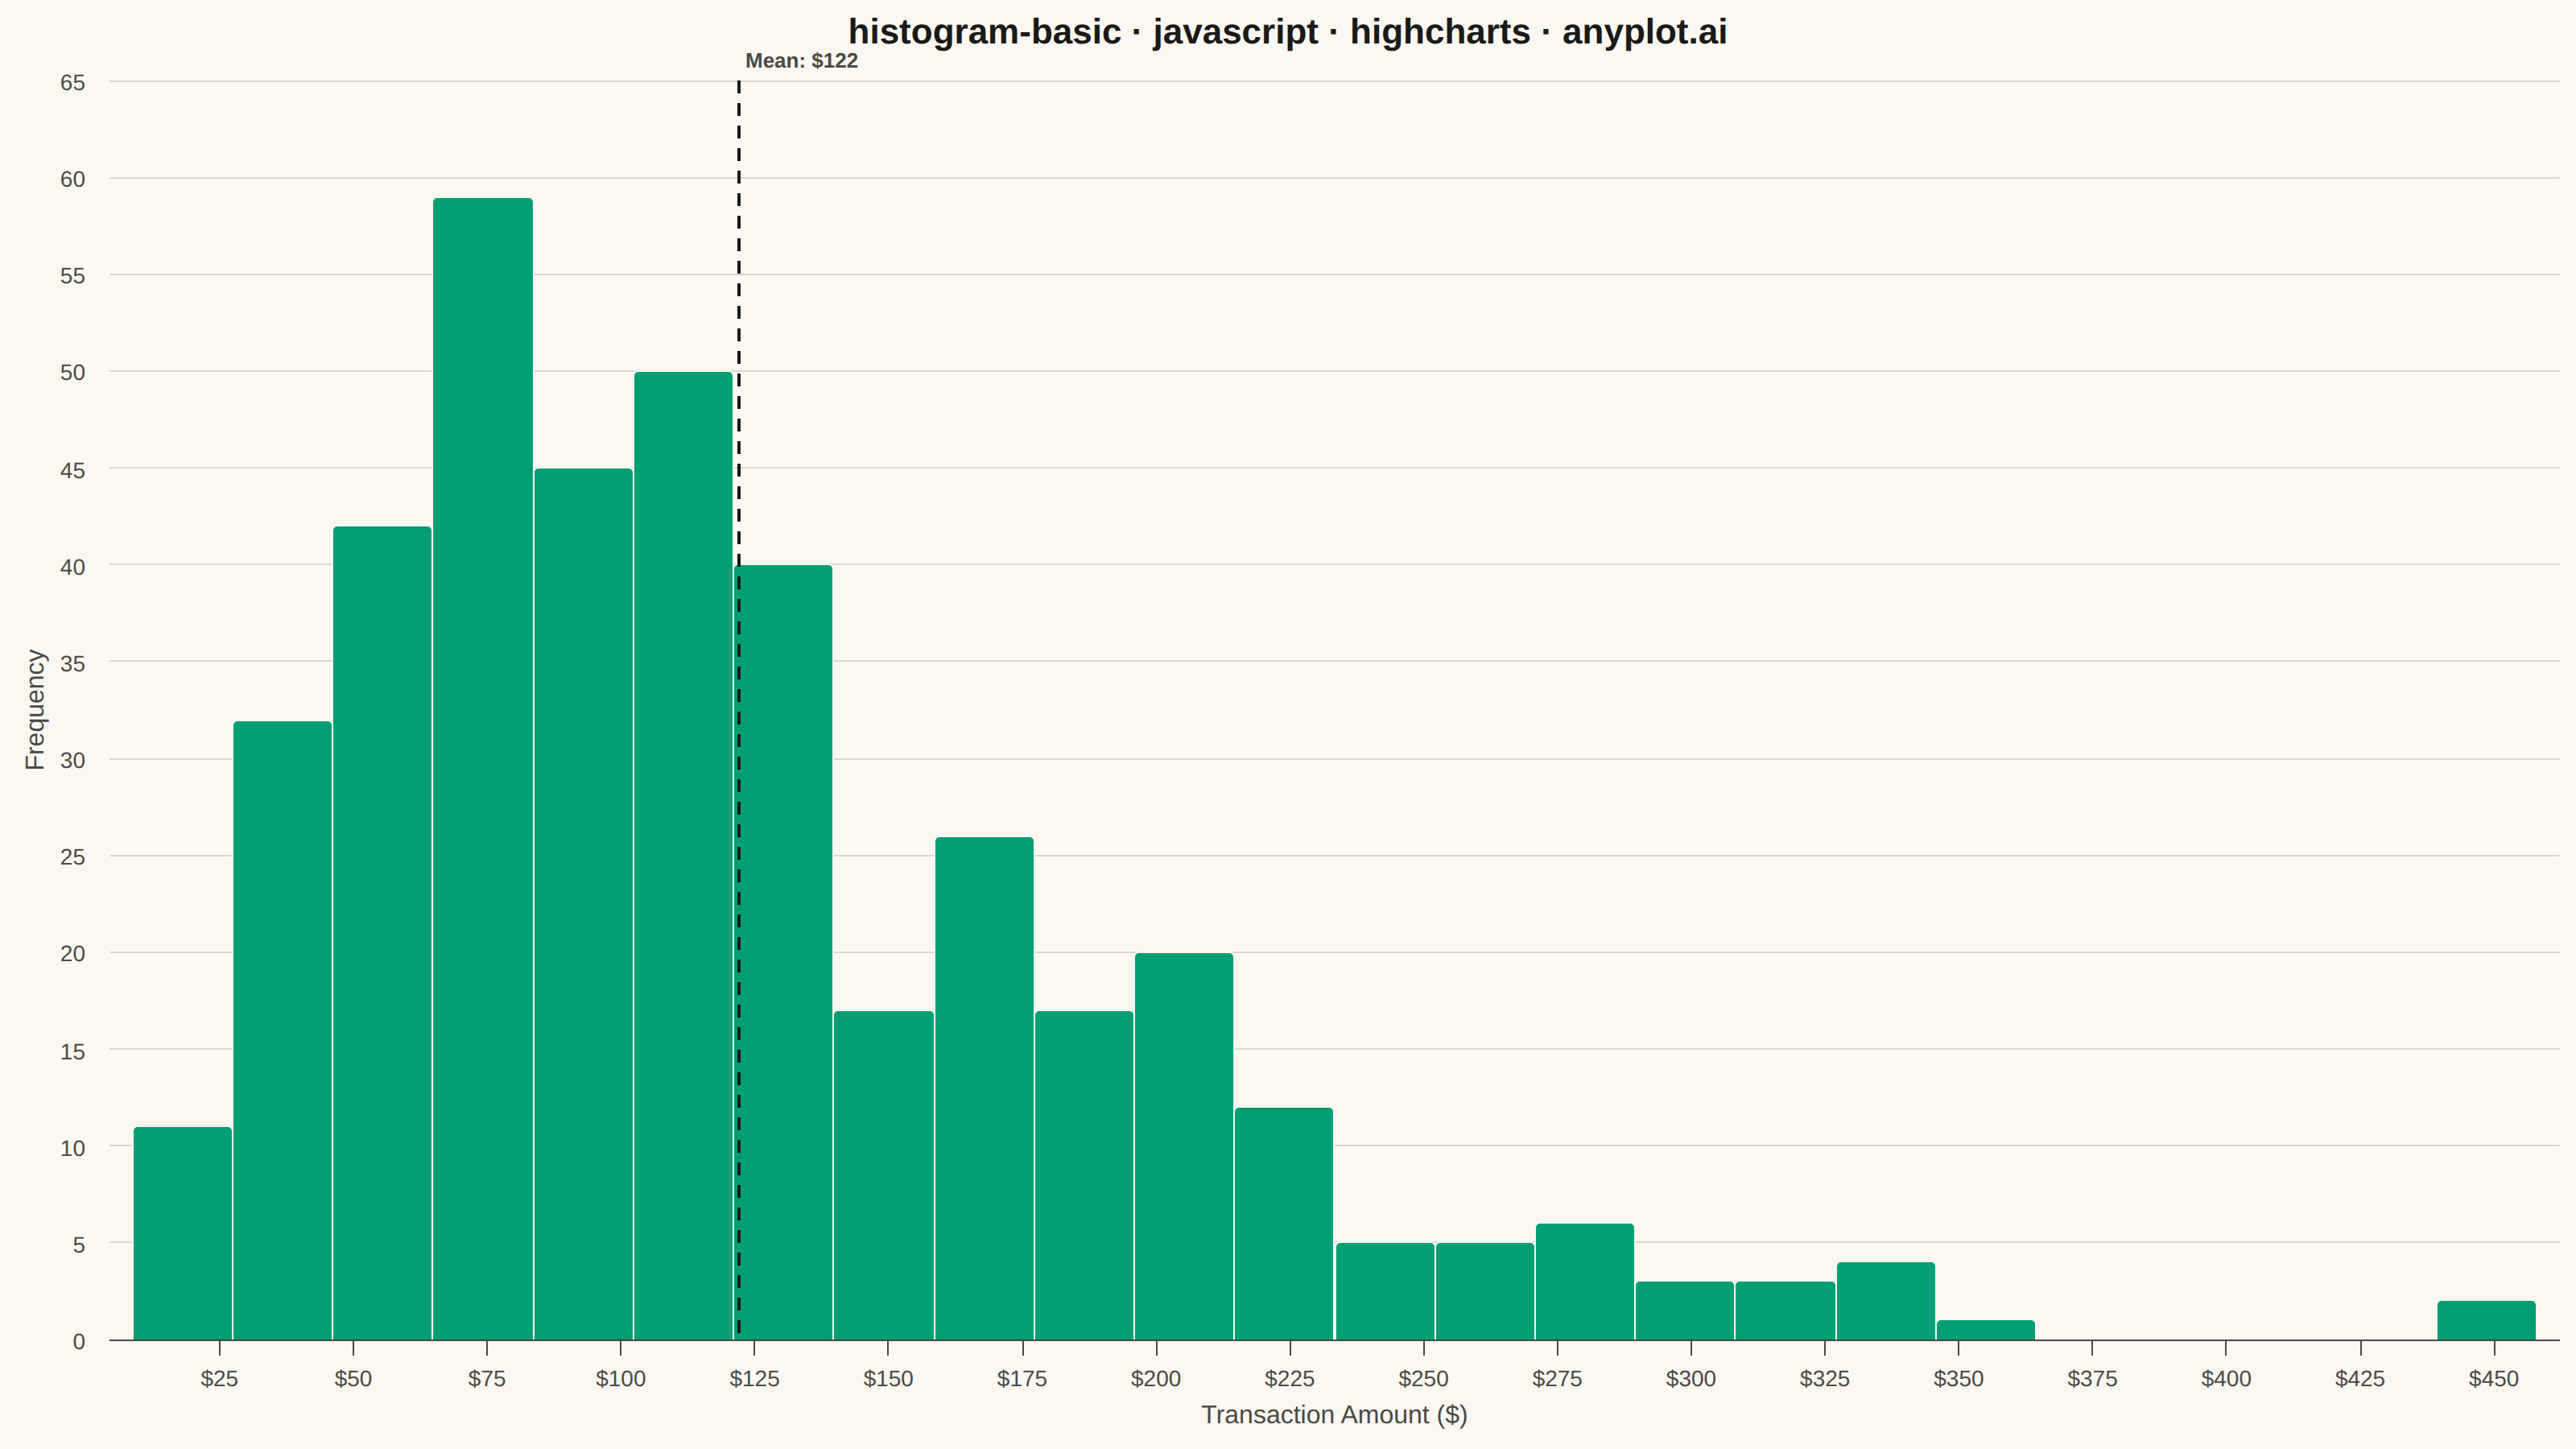
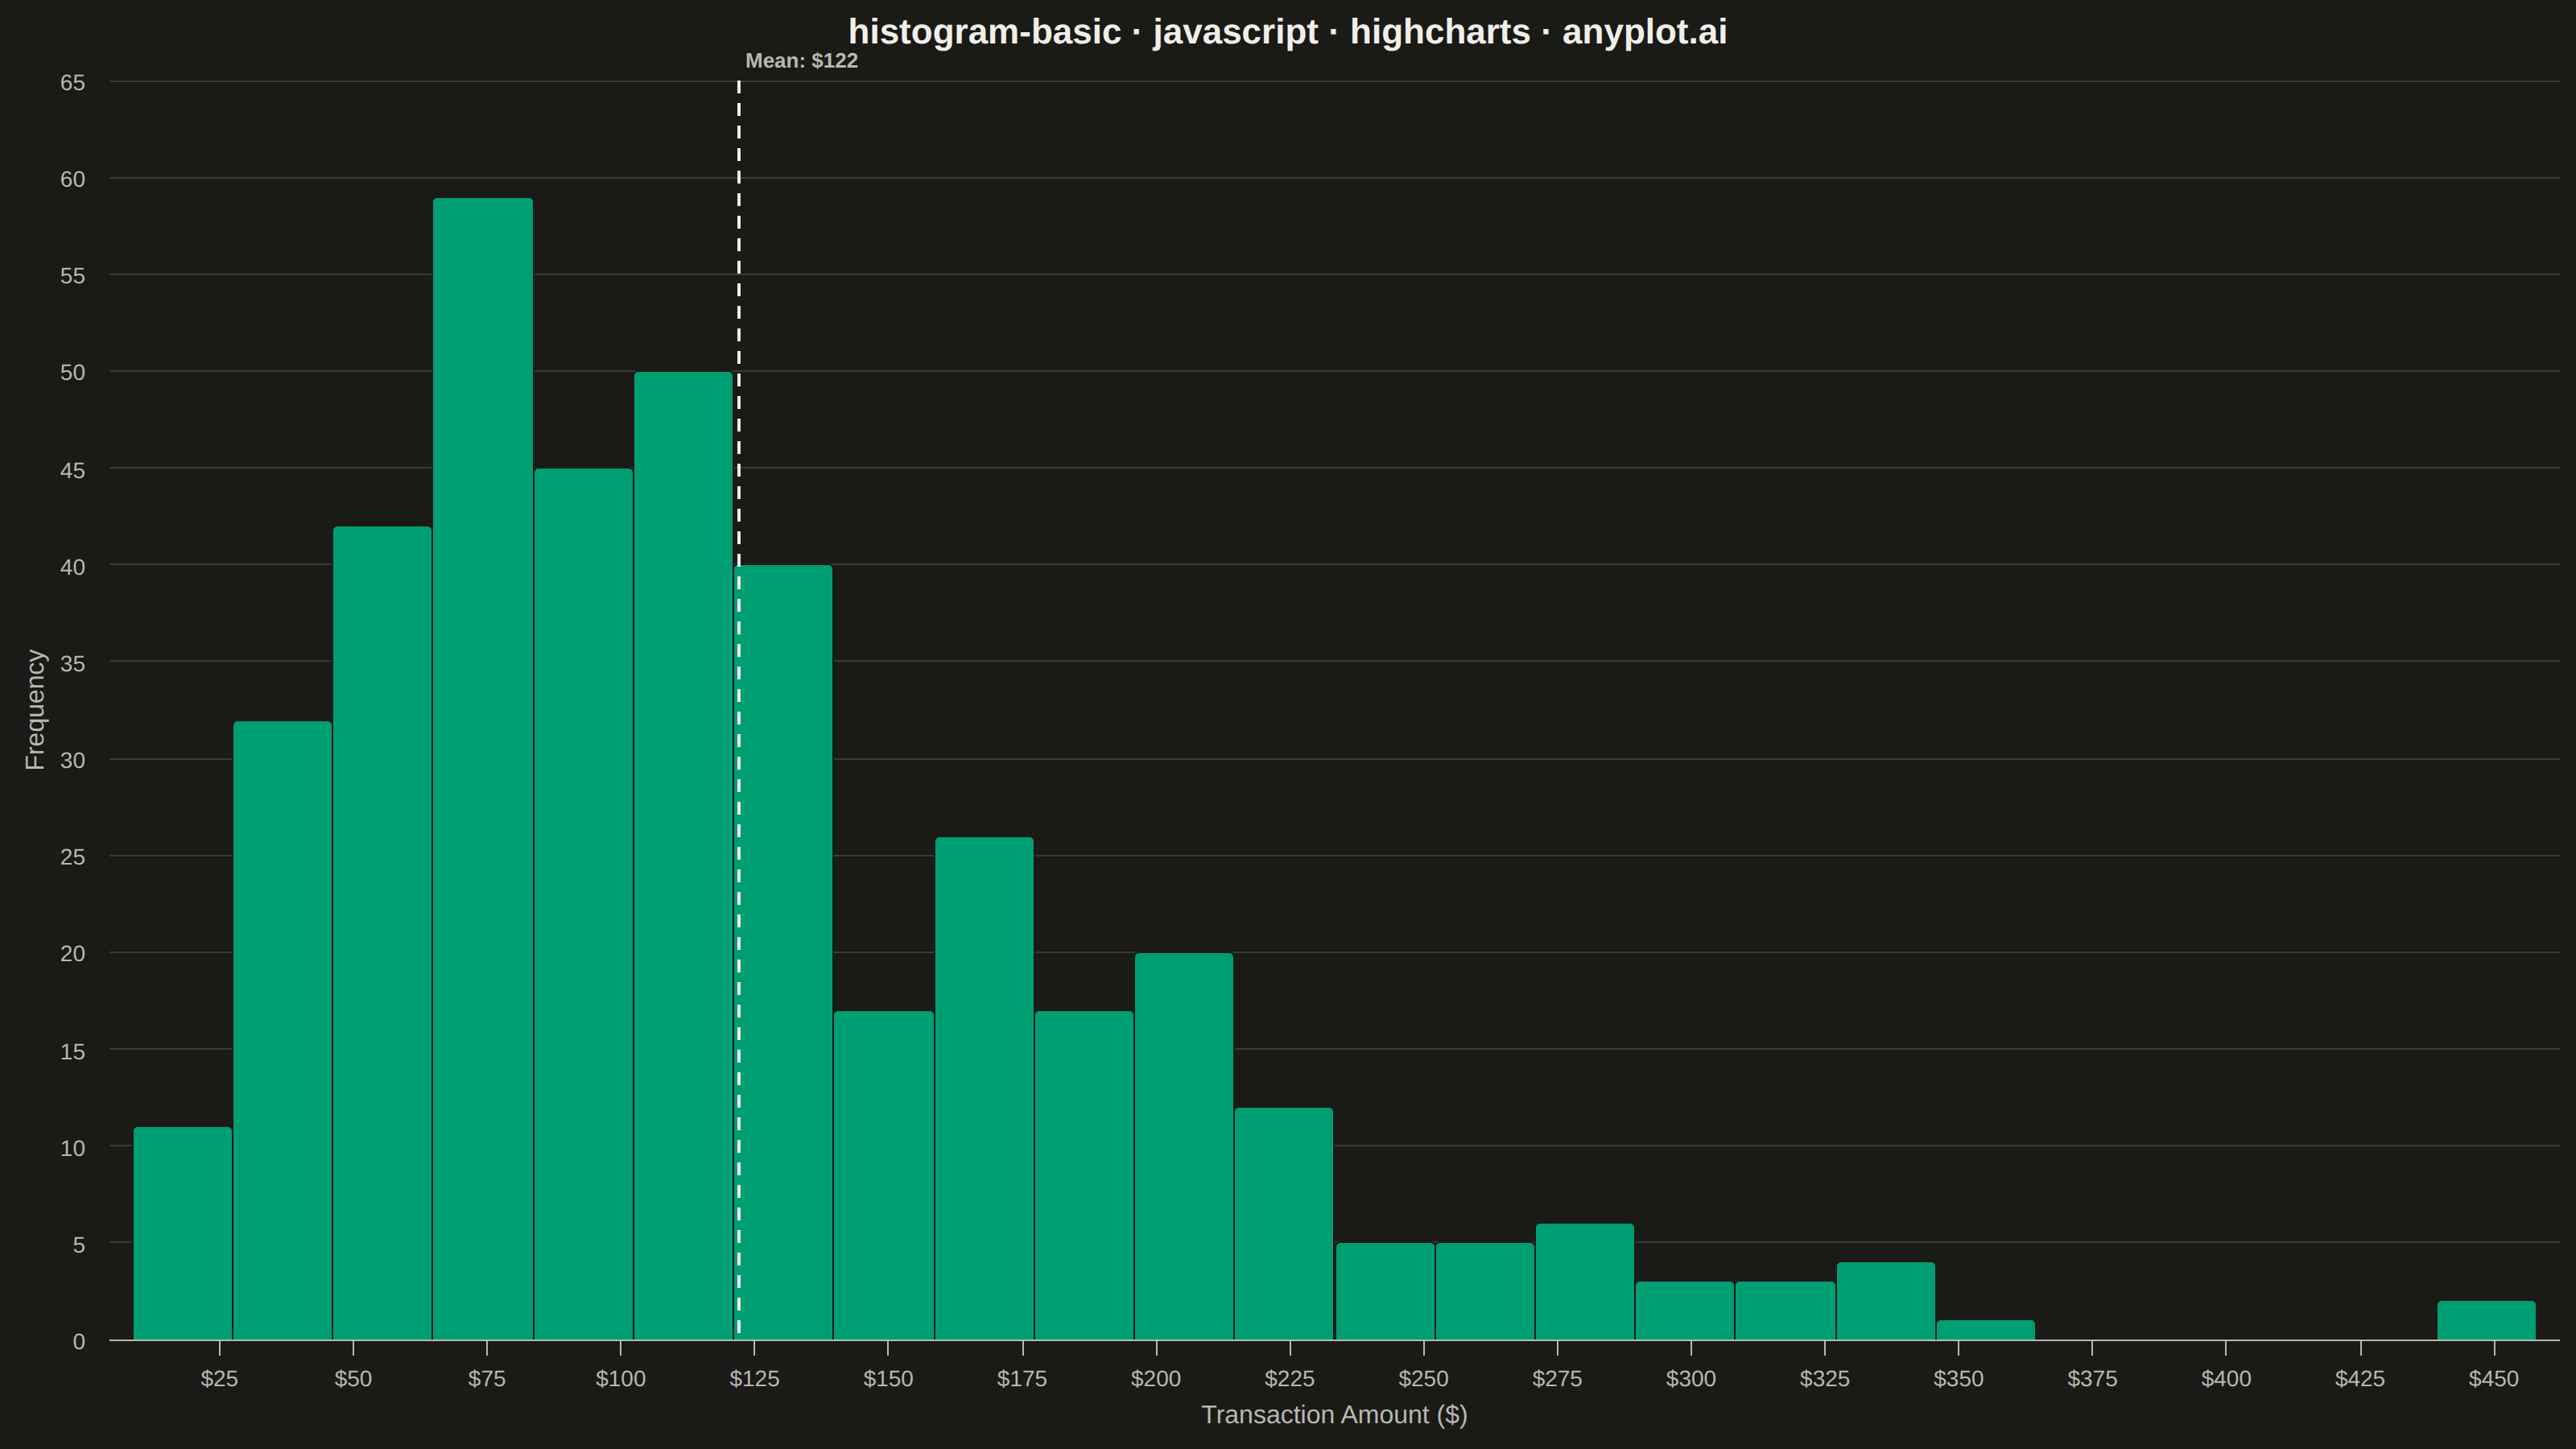
The same plot in 14 other libraries — JavaScript: Chart.js, D3.js, Apache ECharts, MUI X Charts; Python: Altair, Bokeh, lets-plot, Matplotlib, Plotly, plotnine, Pygal, Seaborn; R: ggplot2; Julia: Makie.jl. Compare all 15 side by side: Basic Histogram in Python, R, Julia and JavaScript.
A histogram displays the distribution of a single continuous variable by dividing the data range into bins and showing the frequency (count) of observations in each bin. It reveals the shape of the data distribution, including central tendency, spread, and presence of outliers or multiple modes.
// anyplot.ai
// histogram-basic: Basic Histogram
// Library: highcharts 12.6.0 | JavaScript 22.23.2
// Quality: 85/100 | Created: 2026-08-26

const t = window.ANYPLOT_TOKENS;

// --- Data (in-memory, deterministic) ----------------------------------------
// Retail transaction amounts ($), right-skewed: many small purchases, a
// gradually thinning tail of larger ones — a Gamma(shape=3, scale=40) draw
// via a sum of exponentials, generated with a fixed-seed LCG.
let seed = 42;
function random() {
  seed = (seed + 0x6d2b79f5) | 0;
  let z = Math.imul(seed ^ (seed >>> 15), 1 | seed);
  z = (z + Math.imul(z ^ (z >>> 7), 61 | z)) ^ z;
  return ((z ^ (z >>> 14)) >>> 0) / 4294967296;
}
function exponential(rate) {
  return -Math.log(1 - random()) / rate;
}

const SAMPLE_SIZE = 400;
const GAMMA_SCALE = 40;
const transactionAmounts = [];
for (let i = 0; i < SAMPLE_SIZE; i++) {
  const gamma =
    exponential(1 / GAMMA_SCALE) +
    exponential(1 / GAMMA_SCALE) +
    exponential(1 / GAMMA_SCALE);
  transactionAmounts.push(gamma);
}

// --- Binning -----------------------------------------------------------------
const BIN_COUNT = 24;
const dataMin = Math.min(...transactionAmounts);
const dataMax = Math.max(...transactionAmounts);
const binWidth = (dataMax - dataMin) / BIN_COUNT;

const binCounts = new Array(BIN_COUNT).fill(0);
transactionAmounts.forEach((value) => {
  const idx = Math.min(
    BIN_COUNT - 1,
    Math.floor((value - dataMin) / binWidth)
  );
  binCounts[idx] += 1;
});

const histogramData = binCounts.map((count, idx) => ({
  x: dataMin + (idx + 0.5) * binWidth,
  y: count,
}));

const meanAmount =
  transactionAmounts.reduce((sum, v) => sum + v, 0) / transactionAmounts.length;

// --- Chart -------------------------------------------------------------------
Highcharts.chart("container", {
  chart: {
    type: "column",
    backgroundColor: "transparent",
    animation: false,
    style: { fontFamily: "inherit" },
  },
  credits: { enabled: false },
  colors: t.palette,
  title: {
    text: "histogram-basic · javascript · highcharts · anyplot.ai",
    style: { color: t.ink, fontSize: "22px", fontWeight: "600" },
  },
  xAxis: {
    title: {
      text: "Transaction Amount ($)",
      style: { color: t.inkSoft, fontSize: "16px" },
    },
    lineColor: t.inkSoft,
    tickColor: t.inkSoft,
    gridLineColor: t.grid,
    labels: {
      style: { color: t.inkSoft, fontSize: "14px" },
      formatter() {
        return "$" + Math.round(this.value);
      },
    },
    plotLines: [
      {
        value: meanAmount,
        color: t.ink,
        width: 2,
        dashStyle: "Dash",
        zIndex: 5,
        label: {
          text: `Mean: $${meanAmount.toFixed(0)}`,
          style: { color: t.inkSoft, fontSize: "13px", fontWeight: "600" },
          rotation: 0,
          y: -8,
          x: 4,
        },
      },
    ],
  },
  yAxis: {
    min: 0,
    title: {
      text: "Frequency",
      style: { color: t.inkSoft, fontSize: "16px" },
    },
    gridLineColor: t.grid,
    labels: { style: { color: t.inkSoft, fontSize: "14px" } },
  },
  legend: { enabled: false },
  tooltip: {
    headerFormat: "",
    pointFormatter() {
      const lo = this.x - binWidth / 2;
      const hi = this.x + binWidth / 2;
      return `$${lo.toFixed(0)}–$${hi.toFixed(0)}: <b>${this.y}</b>`;
    },
  },
  plotOptions: {
    series: { animation: false },
    column: {
      pointRange: binWidth,
      pointPadding: 0,
      groupPadding: 0,
      borderWidth: 1,
      borderColor: t.pageBg,
      states: {
        hover: {
          brightness: 0.1,
          borderColor: t.ink,
        },
      },
    },
  },
  series: [{ name: "Transactions", data: histogramData, color: t.palette[0] }],
});
Runnable source as JSON, for any HTTP client: https://api.anyplot.ai/specs/histogram-basic/highcharts/code. Any spec id and library id listed in llms-full.txt fit the same URL shape; every URL below is complete and callable.
{
  "spec_id": "histogram-basic",
  "language": "javascript",
  "library": "highcharts",
  "page": "https://anyplot.ai/histogram-basic/javascript/highcharts",
  "hub": "https://anyplot.ai/histogram-basic",
  "code_json": "https://api.anyplot.ai/specs/histogram-basic/highcharts/code",
  "spec_json": "https://api.anyplot.ai/specs/histogram-basic",
  "render_light_png": "https://storage.googleapis.com/anyplot-images/plots/histogram-basic/javascript/highcharts/plot-light.png",
  "render_dark_png": "https://storage.googleapis.com/anyplot-images/plots/histogram-basic/javascript/highcharts/plot-dark.png",
  "interactive_light_html": "https://storage.googleapis.com/anyplot-images/plots/histogram-basic/javascript/highcharts/plot-light.html",
  "interactive_dark_html": "https://storage.googleapis.com/anyplot-images/plots/histogram-basic/javascript/highcharts/plot-dark.html",
  "quality_score": 85.0,
  "license": "MIT",
  "guide": "https://anyplot.ai/llms.txt"
}
Part of Basic Histogram on anyplot.ai.