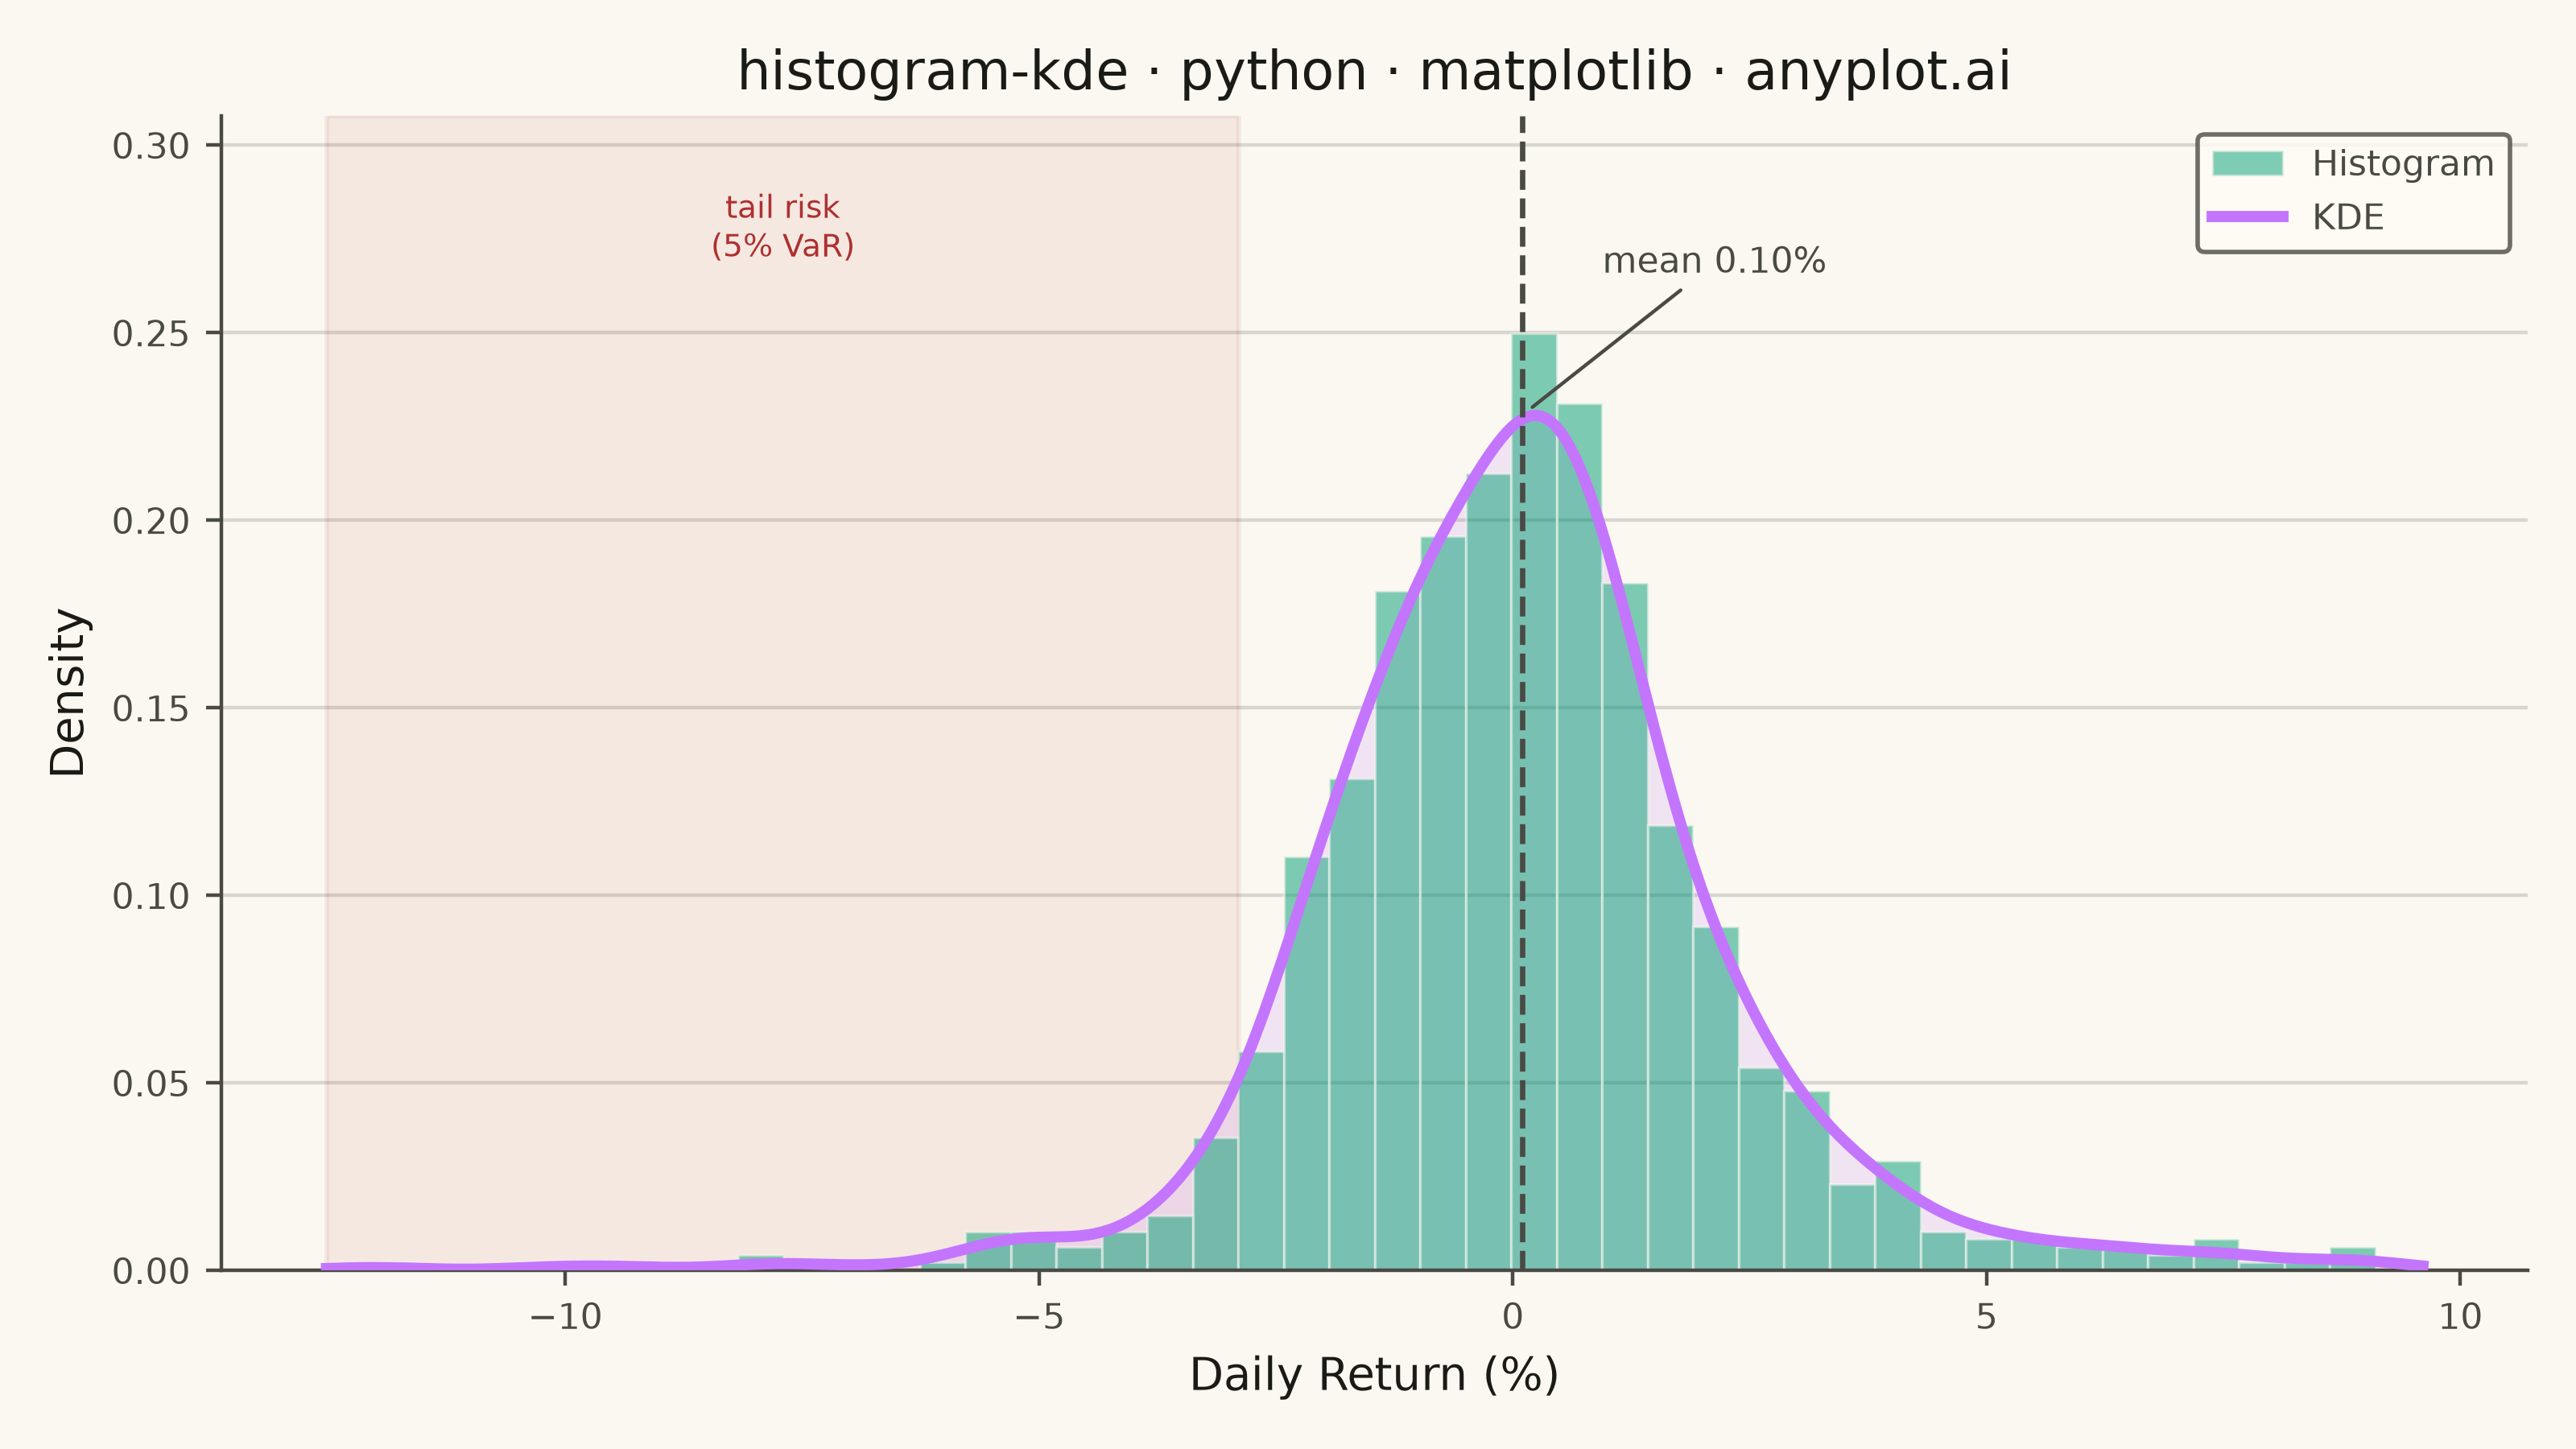
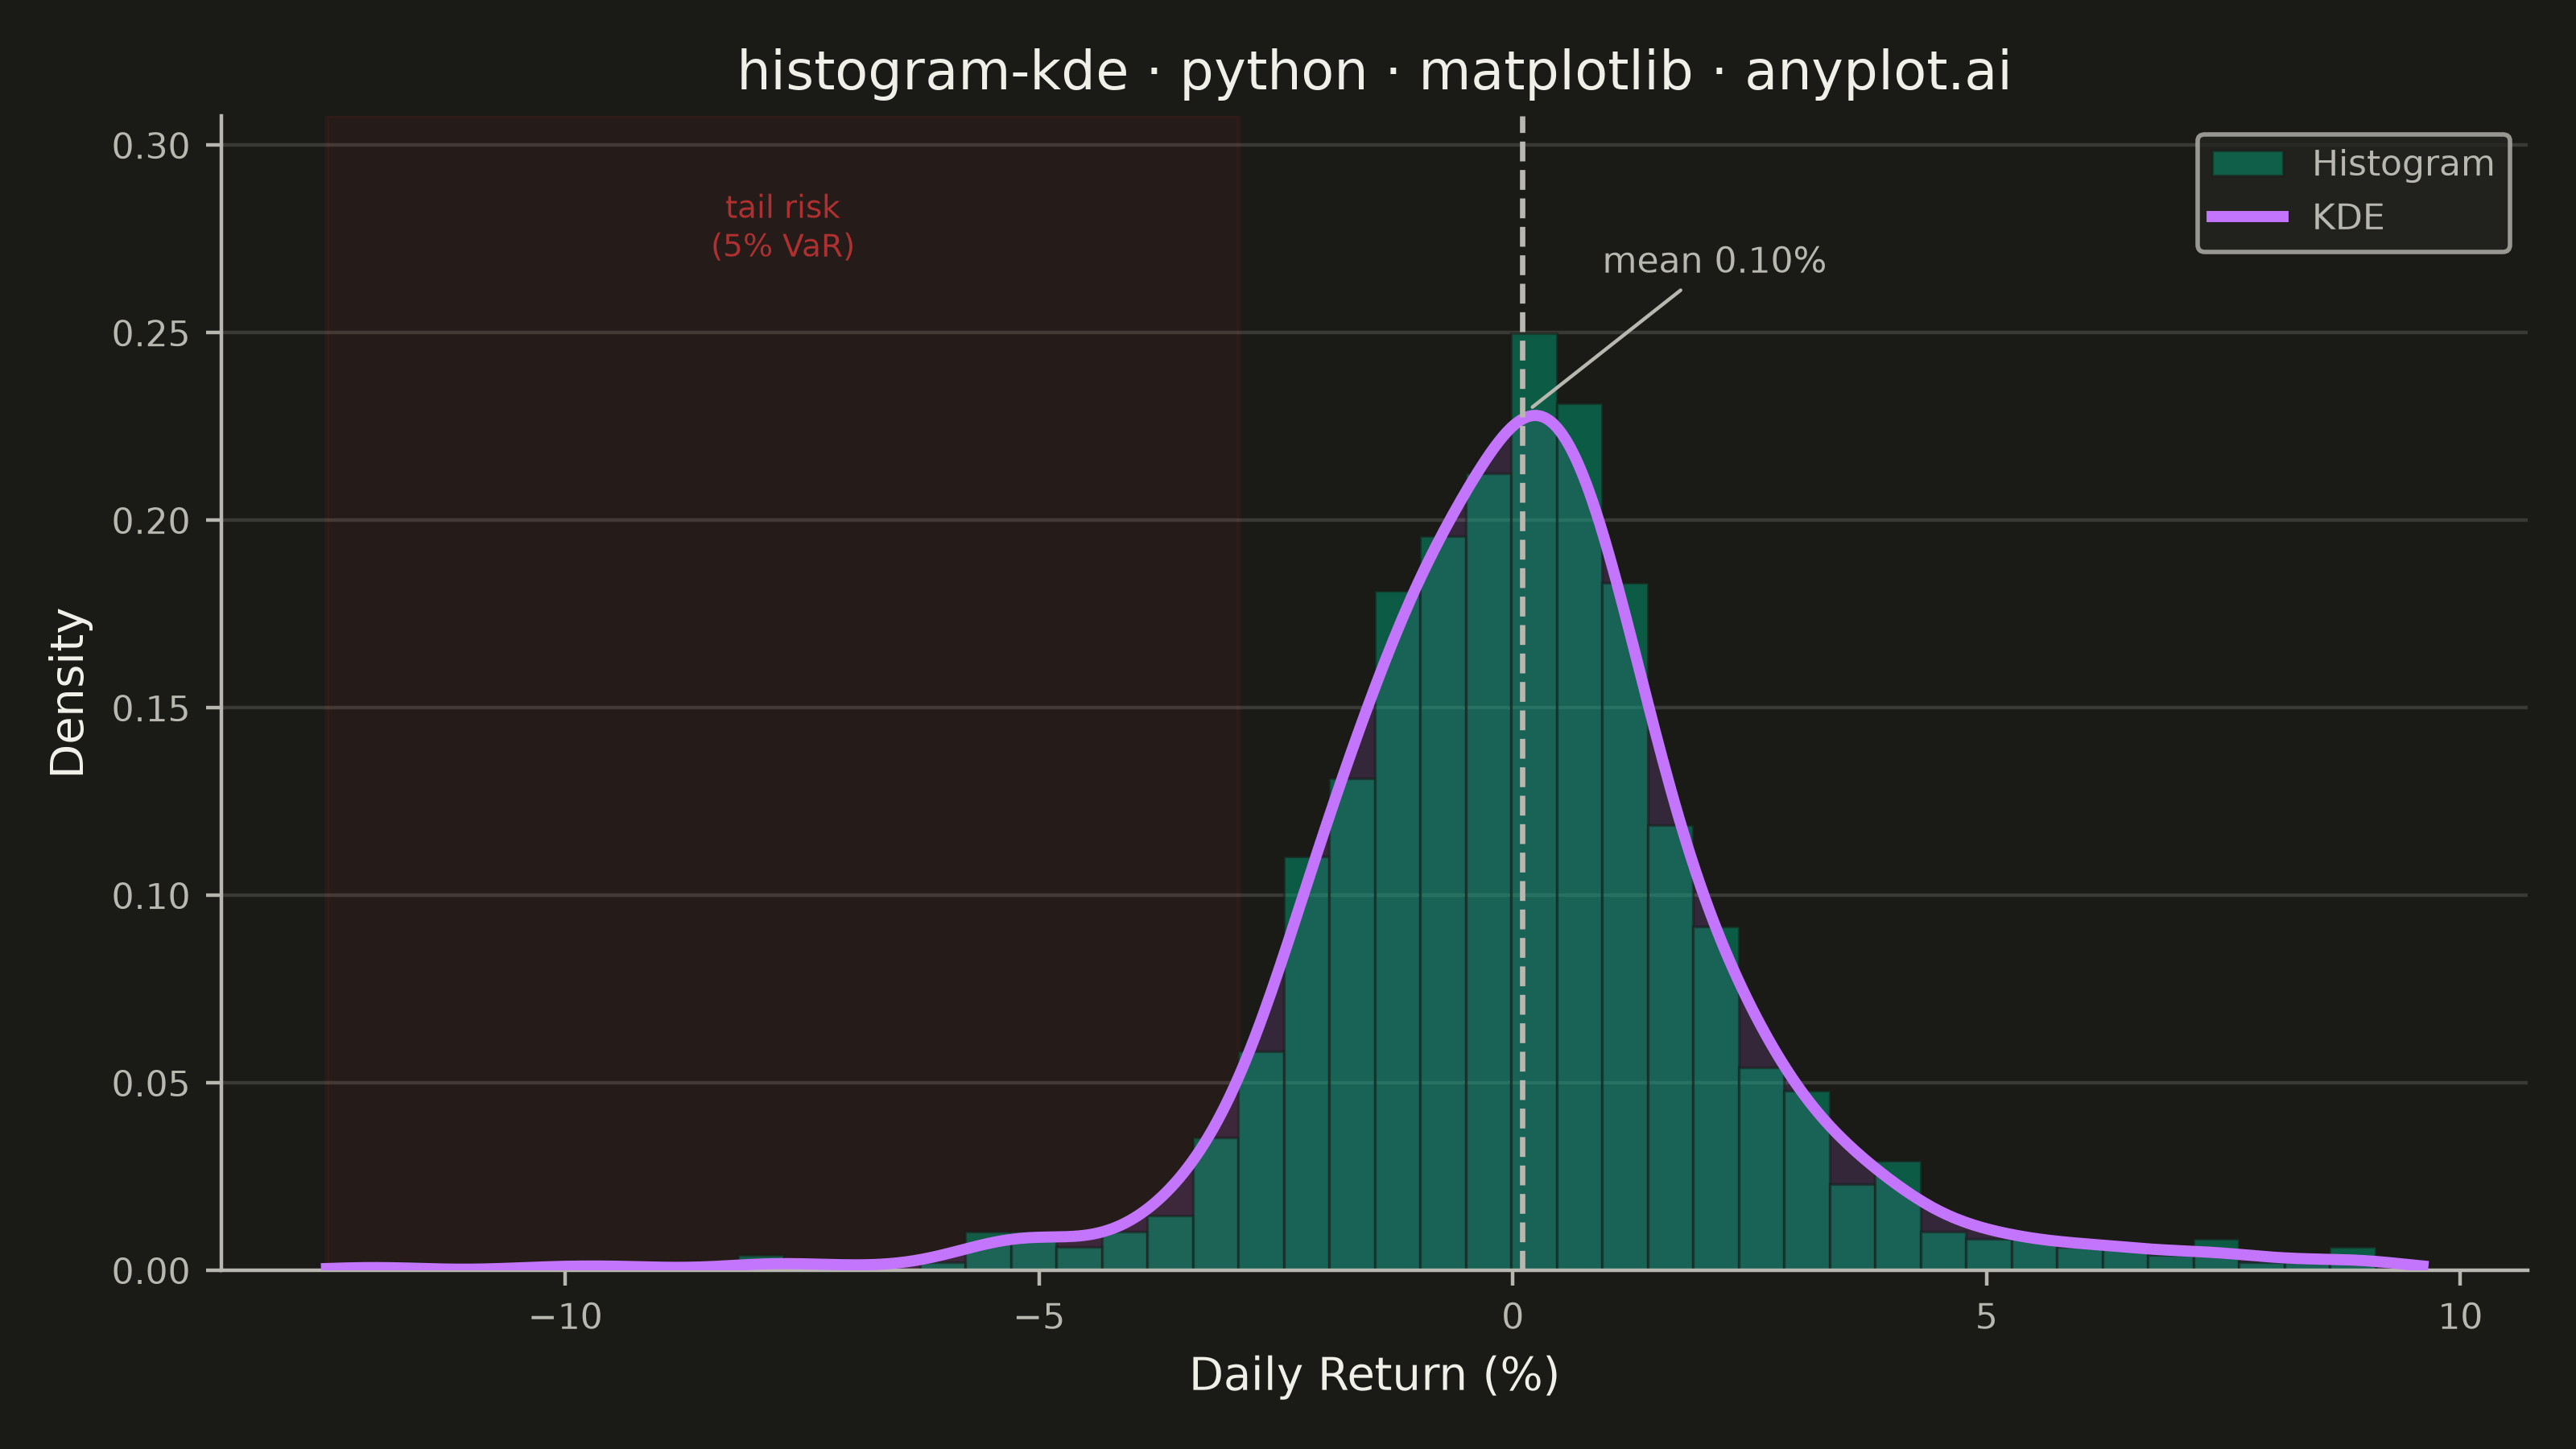
A histogram with kernel density estimate (KDE) overlay combines discrete binning with continuous density estimation to visualize the distribution of continuous data. The histogram bars show frequency counts in each bin while the smooth KDE curve reveals the underlying probability density, making it easier to perceive the true shape of the distribution without binning artifacts.
Preview render from the Matplotlib implementation.