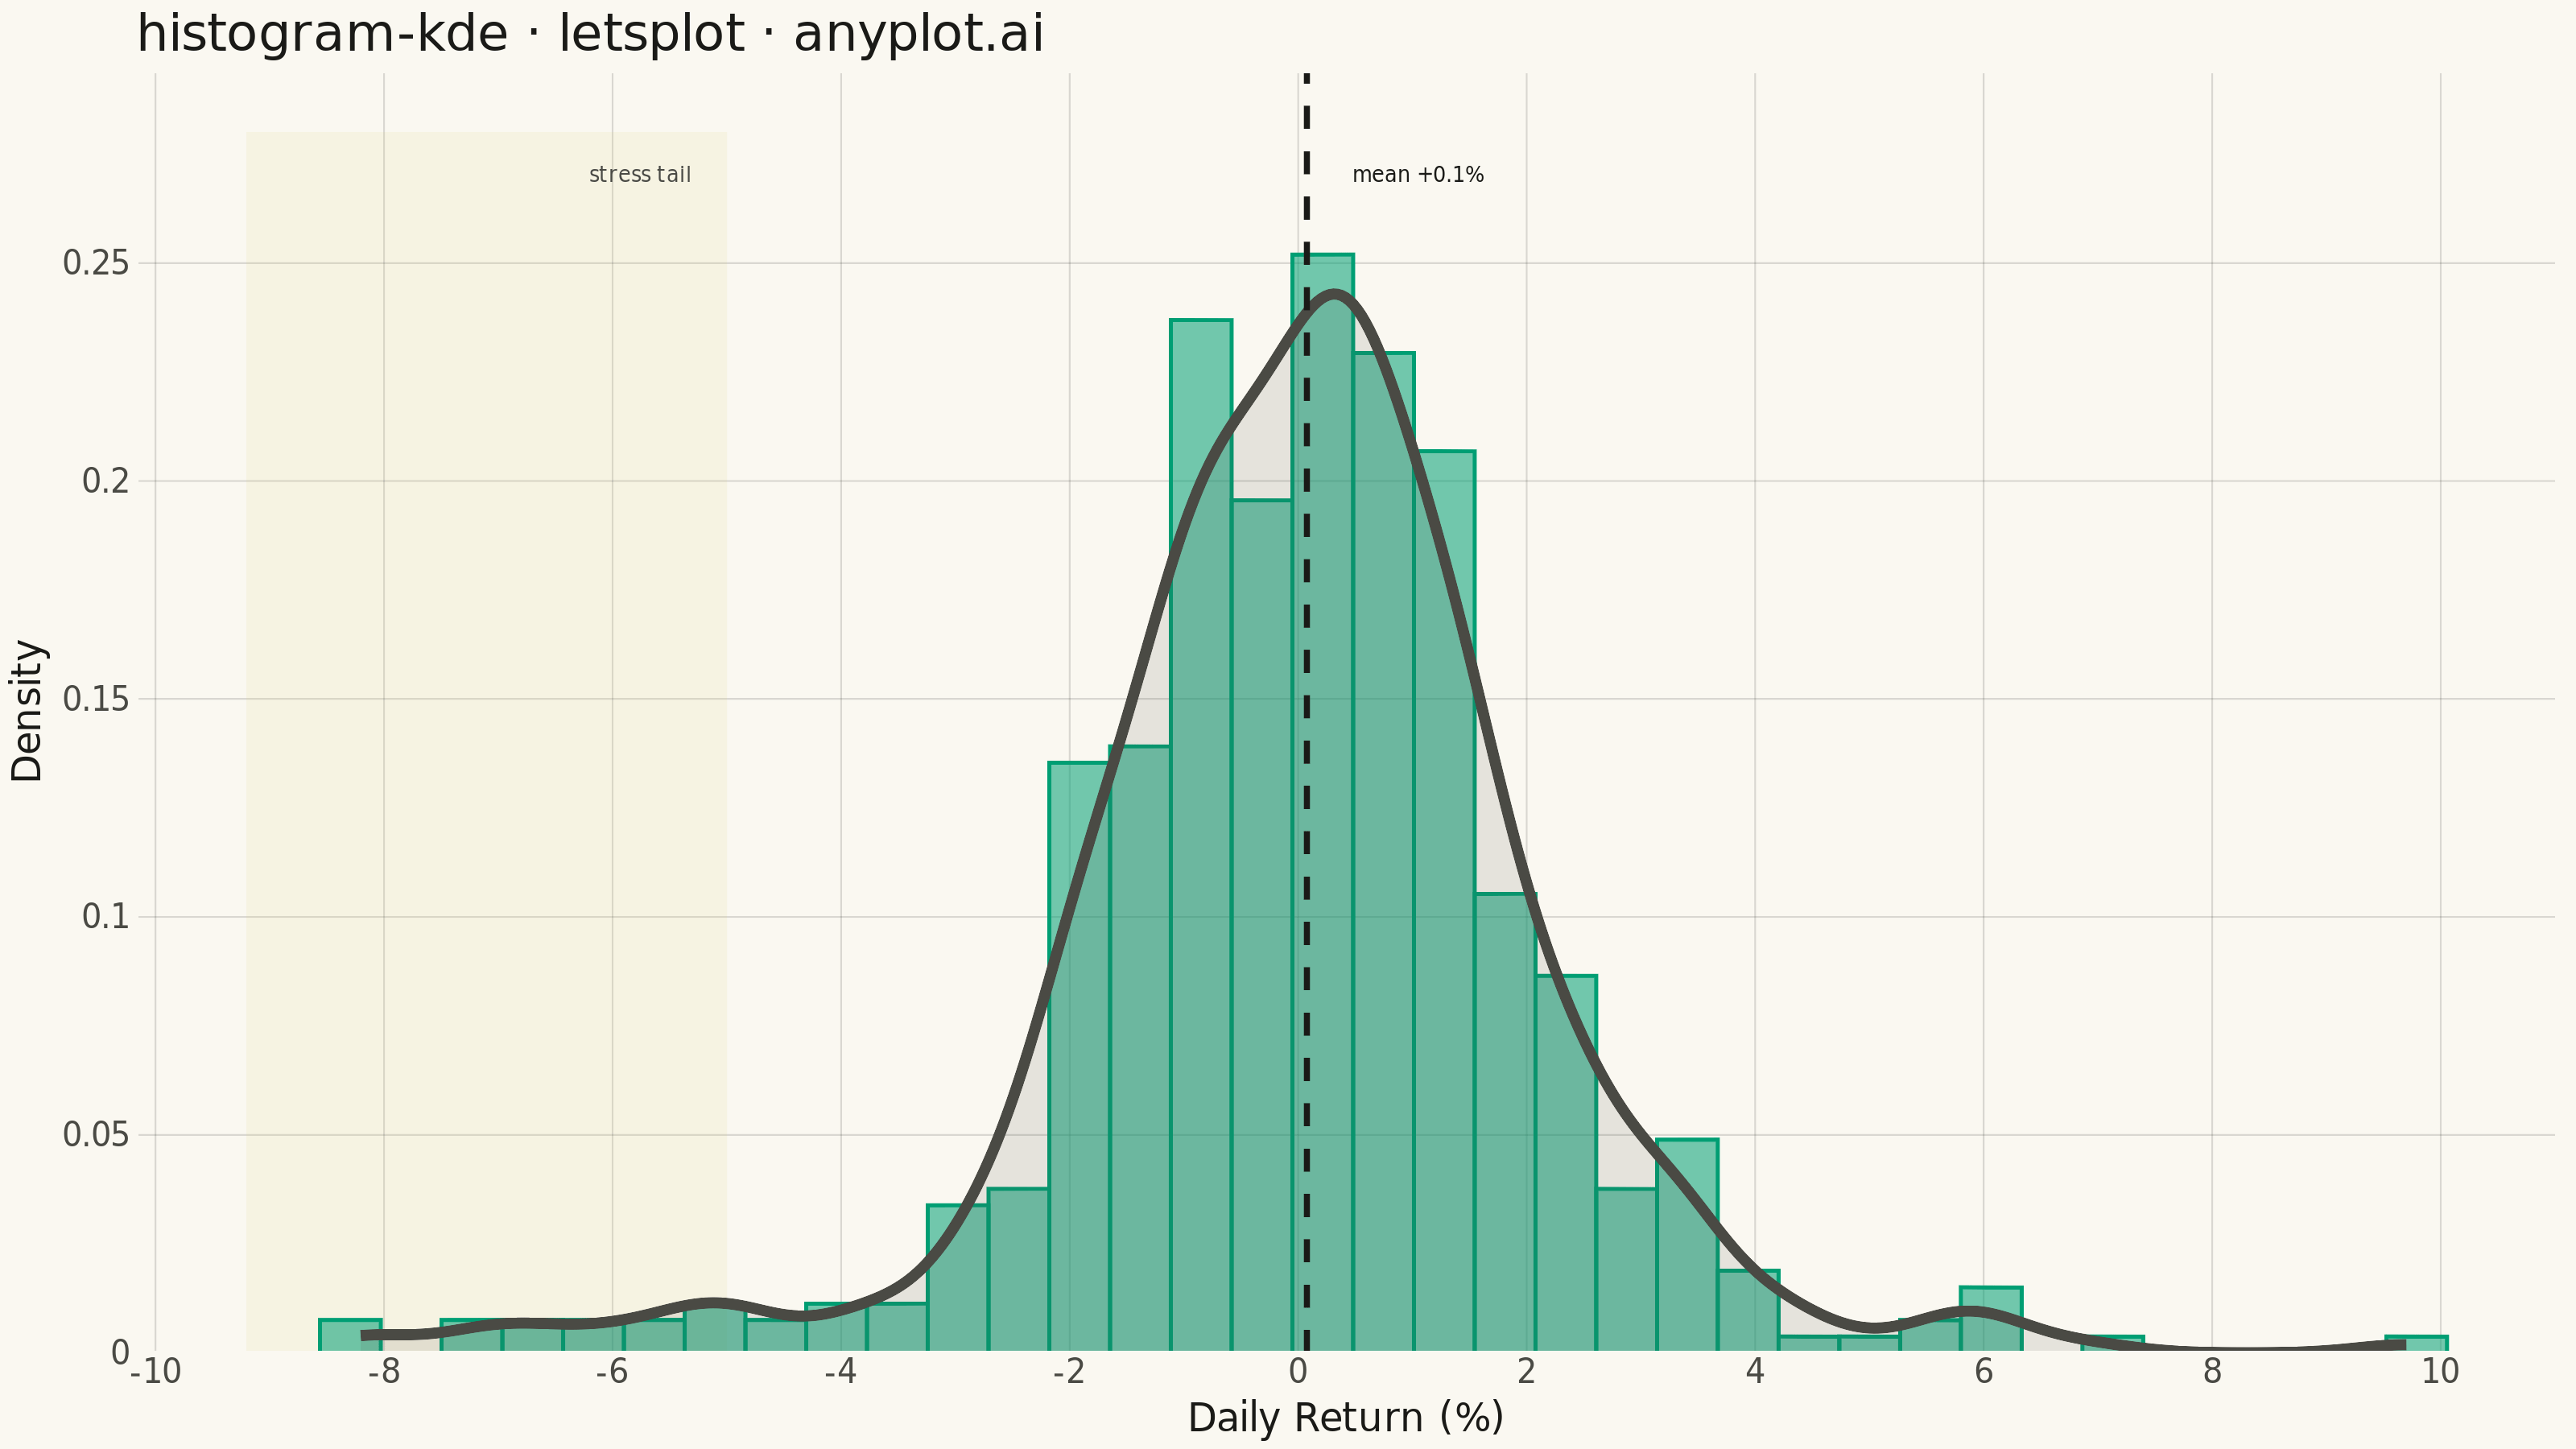
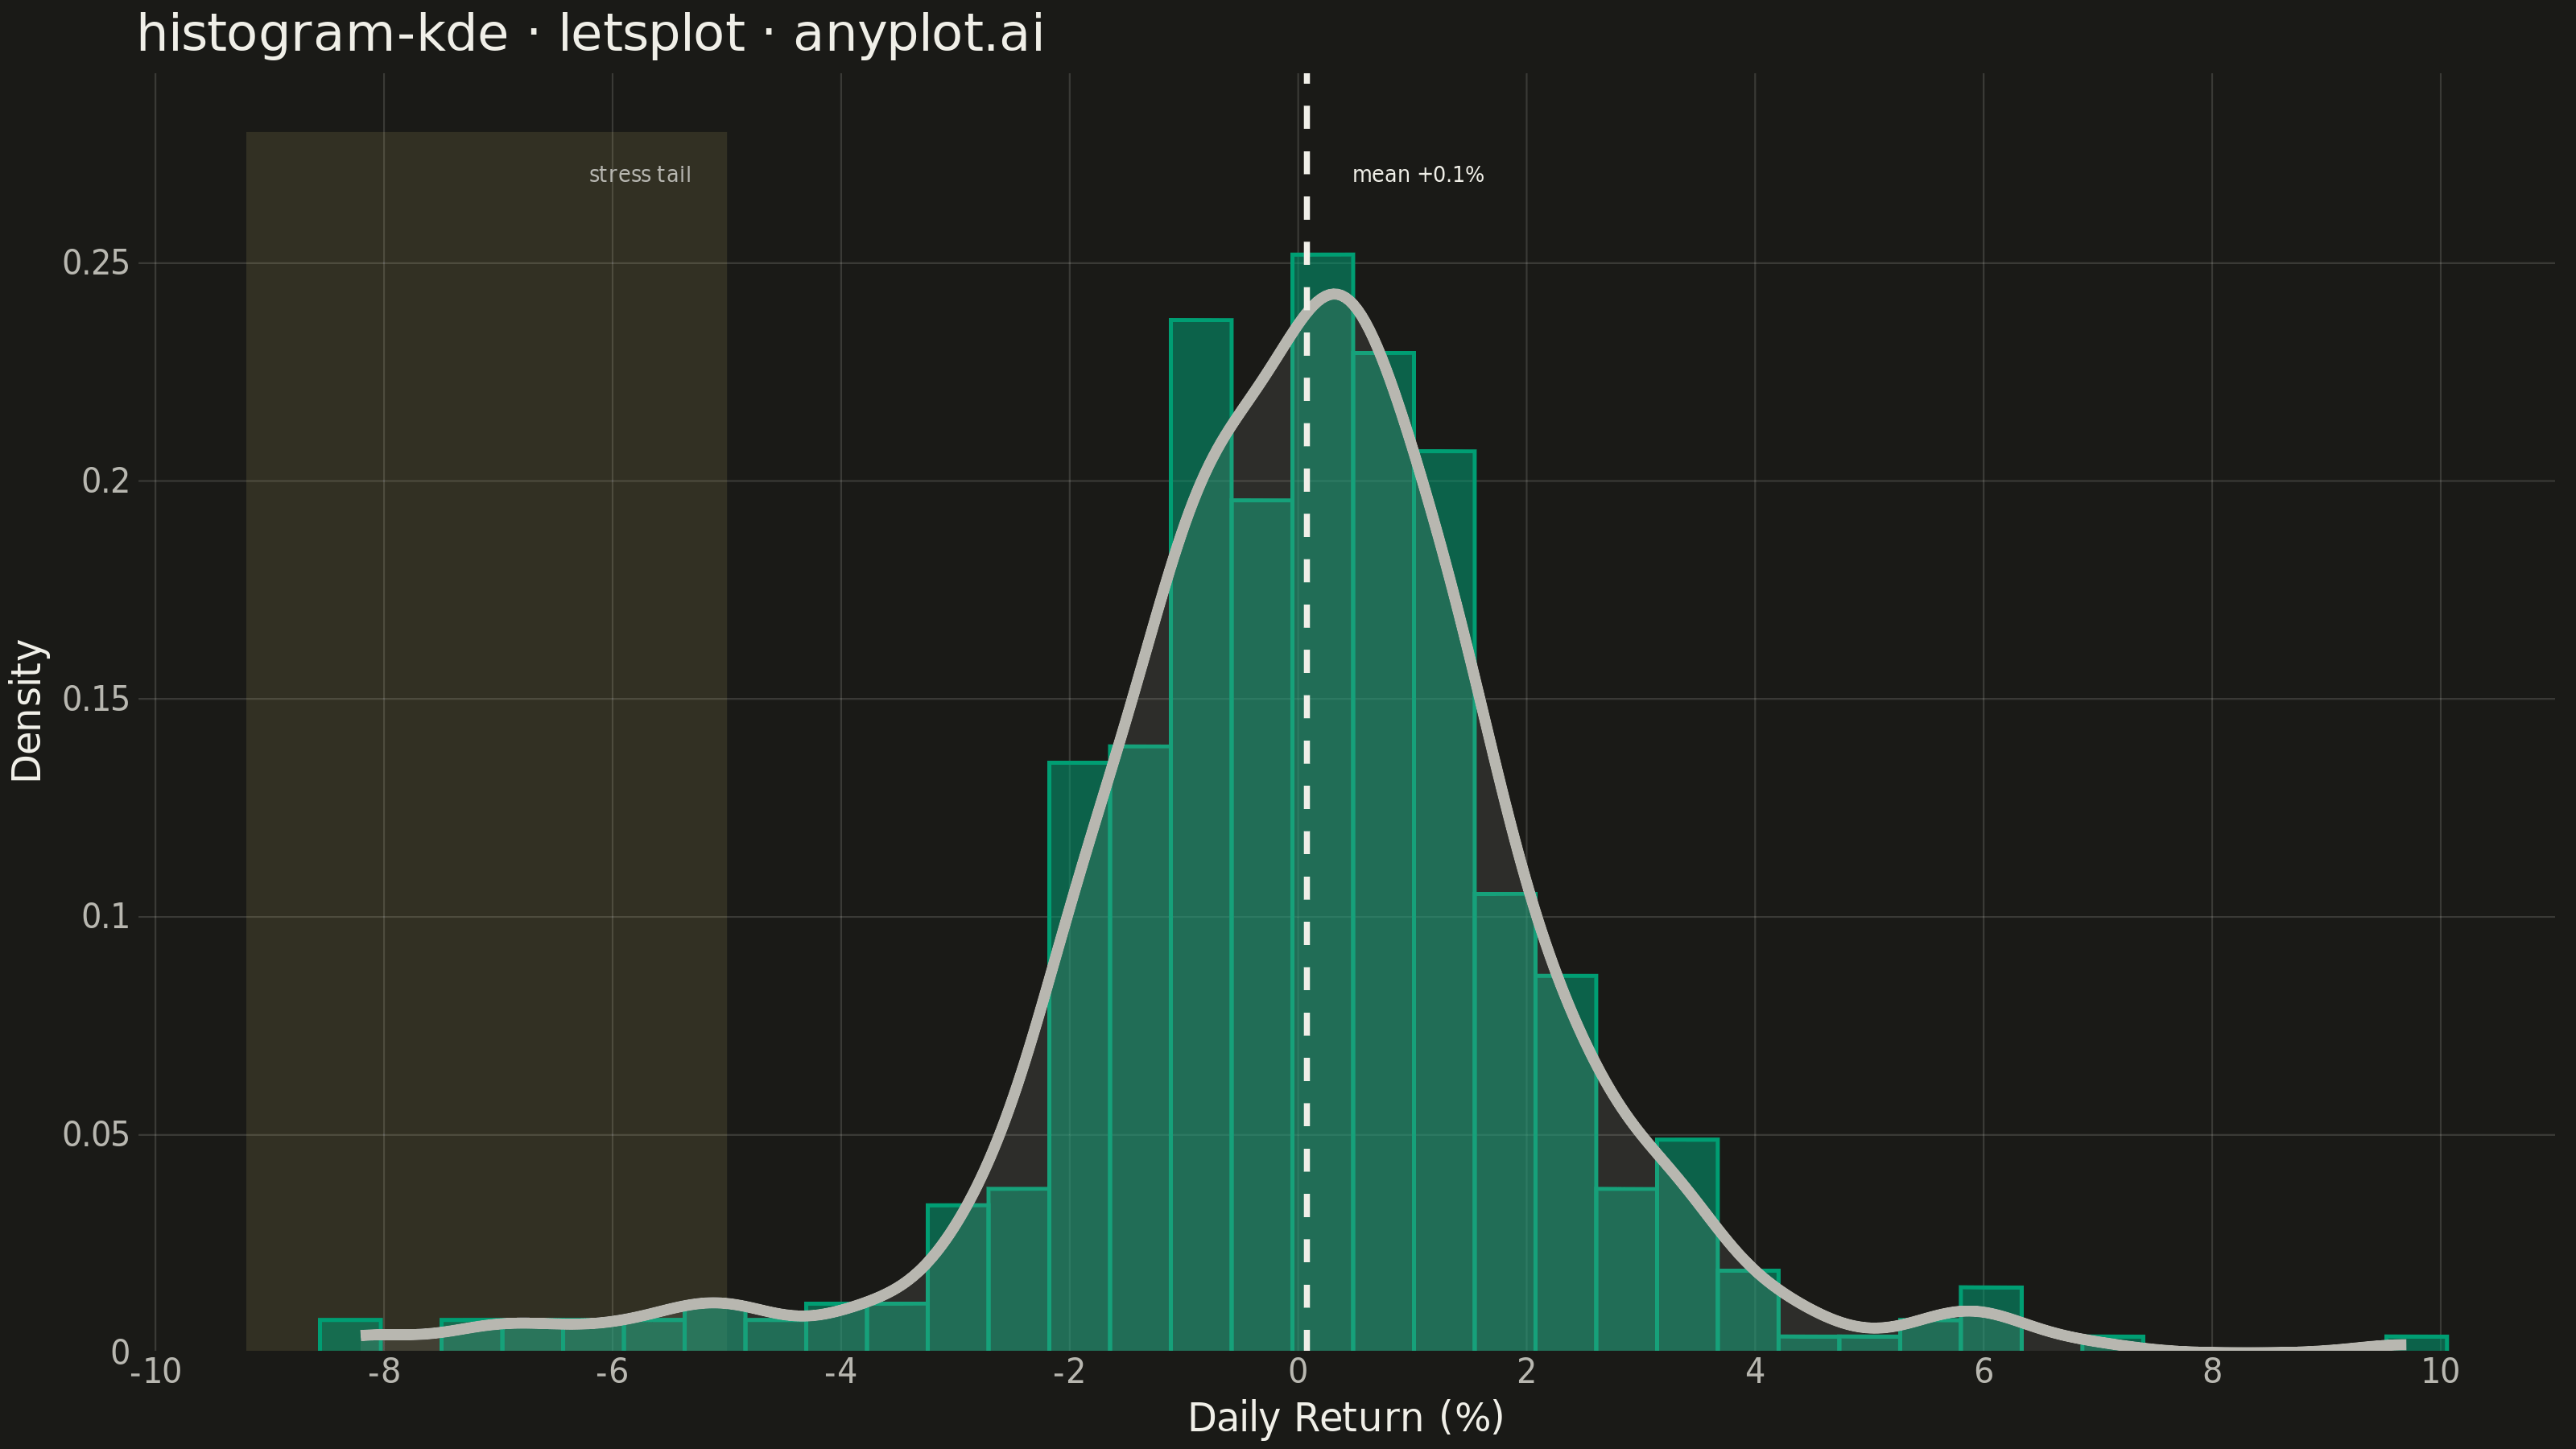
A histogram with kernel density estimate (KDE) overlay combines discrete binning with continuous density estimation to visualize the distribution of continuous data. The histogram bars show frequency counts in each bin while the smooth KDE curve reveals the underlying probability density, making it easier to perceive the true shape of the distribution without binning artifacts.
""" anyplot.ai
histogram-kde: Histogram with KDE Overlay
Library: letsplot 4.11.0 | Python 3.13.14
Quality: 92/100 | Updated: 2026-08-05
"""

import os
from pathlib import Path

import numpy as np
import pandas as pd
from lets_plot import *


LetsPlot.setup_html()

# Theme tokens (Imprint palette — see prompts/default-style-guide.md)
THEME = os.getenv("ANYPLOT_THEME", "light")
PAGE_BG = "#FAF8F1" if THEME == "light" else "#1A1A17"
INK = "#1A1A17" if THEME == "light" else "#F0EFE8"
INK_SOFT = "#4A4A44" if THEME == "light" else "#B8B7B0"
RULE = "rgba(26,26,23,0.15)" if THEME == "light" else "rgba(240,239,232,0.15)"
BRAND = "#009E73"  # Imprint palette position 1
AMBER = "#DDCC77"  # semantic warning anchor — tail-risk callout

# Data - simulated stock daily returns: a calm regime plus a stress regime
# (large drawdowns) and a short rally, producing visible left-skew and a
# heavy left tail that the KDE overlay reveals more clearly than raw bins.
np.random.seed(42)
returns = np.concatenate(
    [np.random.normal(0.001, 0.015, 400), np.random.normal(-0.02, 0.03, 50), np.random.normal(0.02, 0.025, 50)]
)
returns = returns * 100
mean_return = float(np.mean(returns))

df = pd.DataFrame({"Daily Return (%)": returns})

# Illustrative "stress day" cutoff: returns beyond this are the fat left tail
tail_cutoff = -5.0
tail_band = pd.DataFrame({"xmin": [returns.min() - 1], "xmax": [tail_cutoff]})

anyplot_theme = (
    theme_minimal()
    # custom overrides must be added after theme_minimal() — lets-plot resolves
    # theme layers in order, and an earlier fill gets clobbered by a later
    # base theme's own default otherwise
    + theme(
        plot_background=element_rect(fill=PAGE_BG, color=PAGE_BG),
        panel_background=element_rect(fill=PAGE_BG, color=PAGE_BG),
        panel_grid_major=element_line(color=RULE, size=0.5),
        panel_grid_minor=element_blank(),
        axis_title=element_text(size=12, color=INK),
        axis_text=element_text(size=10, color=INK_SOFT),
        axis_line=element_line(color=INK_SOFT, size=0.5),
        plot_title=element_text(size=16, color=INK),
        legend_position="none",  # single series — legend would be redundant
    )
)

plot = (
    ggplot(df, aes(x="Daily Return (%)"))
    # Tail-risk callout band drawn first so bars/KDE sit on top of it
    + geom_rect(
        aes(xmin="xmin", xmax="xmax"),
        data=tail_band,
        ymin=0,
        ymax=0.28,
        fill=AMBER,
        color="rgba(221,204,119,0)",
        alpha=0.12,
        inherit_aes=False,
    )
    + geom_histogram(
        aes(y="..density.."),
        bins=35,
        fill=BRAND,
        alpha=0.55,
        color=BRAND,
        size=0.5,
        tooltips=layer_tooltips()
        .format("^x", ".1f")
        .format("..density..", ".3f")
        .line("Return|^x%")
        .line("Density|@..density..")
        .line("Count|@..count.."),
    )
    + geom_area(
        stat="density", color=INK_SOFT, fill=INK_SOFT, alpha=0.12, size=1.5
    )
    + geom_vline(
        xintercept=mean_return, color=INK, linetype="dashed", size=0.8
    )
    + geom_text(
        x=mean_return + 0.4, y=0.27, label=f"mean {mean_return:+.1f}%", color=INK, size=3.2, hjust=0
    )
    + geom_text(
        x=tail_cutoff - 0.3, y=0.27, label="stress tail", color=INK_SOFT, size=3.2, hjust=1
    )
    + labs(
        x="Daily Return (%)", y="Density", title="histogram-kde · letsplot · anyplot.ai"
    )
    + ggsize(800, 450)
    + anyplot_theme
)

# Save
output_dir = Path(__file__).parent
ggsave(plot, str(output_dir / f"plot-{THEME}.png"), scale=4)
ggsave(plot, str(output_dir / f"plot-{THEME}.html"))
Runnable source as JSON, for any HTTP client: https://api.anyplot.ai/specs/histogram-kde/letsplot/code. Any spec id and library id listed in llms-full.txt fit the same URL shape; every URL below is complete and callable.
{
  "spec_id": "histogram-kde",
  "language": "python",
  "library": "letsplot",
  "page": "https://anyplot.ai/histogram-kde/python/letsplot",
  "hub": "https://anyplot.ai/histogram-kde",
  "code_json": "https://api.anyplot.ai/specs/histogram-kde/letsplot/code",
  "spec_json": "https://api.anyplot.ai/specs/histogram-kde",
  "render_light_png": "https://storage.googleapis.com/anyplot-images/plots/histogram-kde/python/letsplot/plot-light.png",
  "render_dark_png": "https://storage.googleapis.com/anyplot-images/plots/histogram-kde/python/letsplot/plot-dark.png",
  "interactive_light_html": "https://storage.googleapis.com/anyplot-images/plots/histogram-kde/python/letsplot/plot-light.html",
  "interactive_dark_html": "https://storage.googleapis.com/anyplot-images/plots/histogram-kde/python/letsplot/plot-dark.html",
  "quality_score": 92.0,
  "license": "MIT",
  "guide": "https://anyplot.ai/llms.txt"
}
Part of Histogram with KDE Overlay on anyplot.ai.