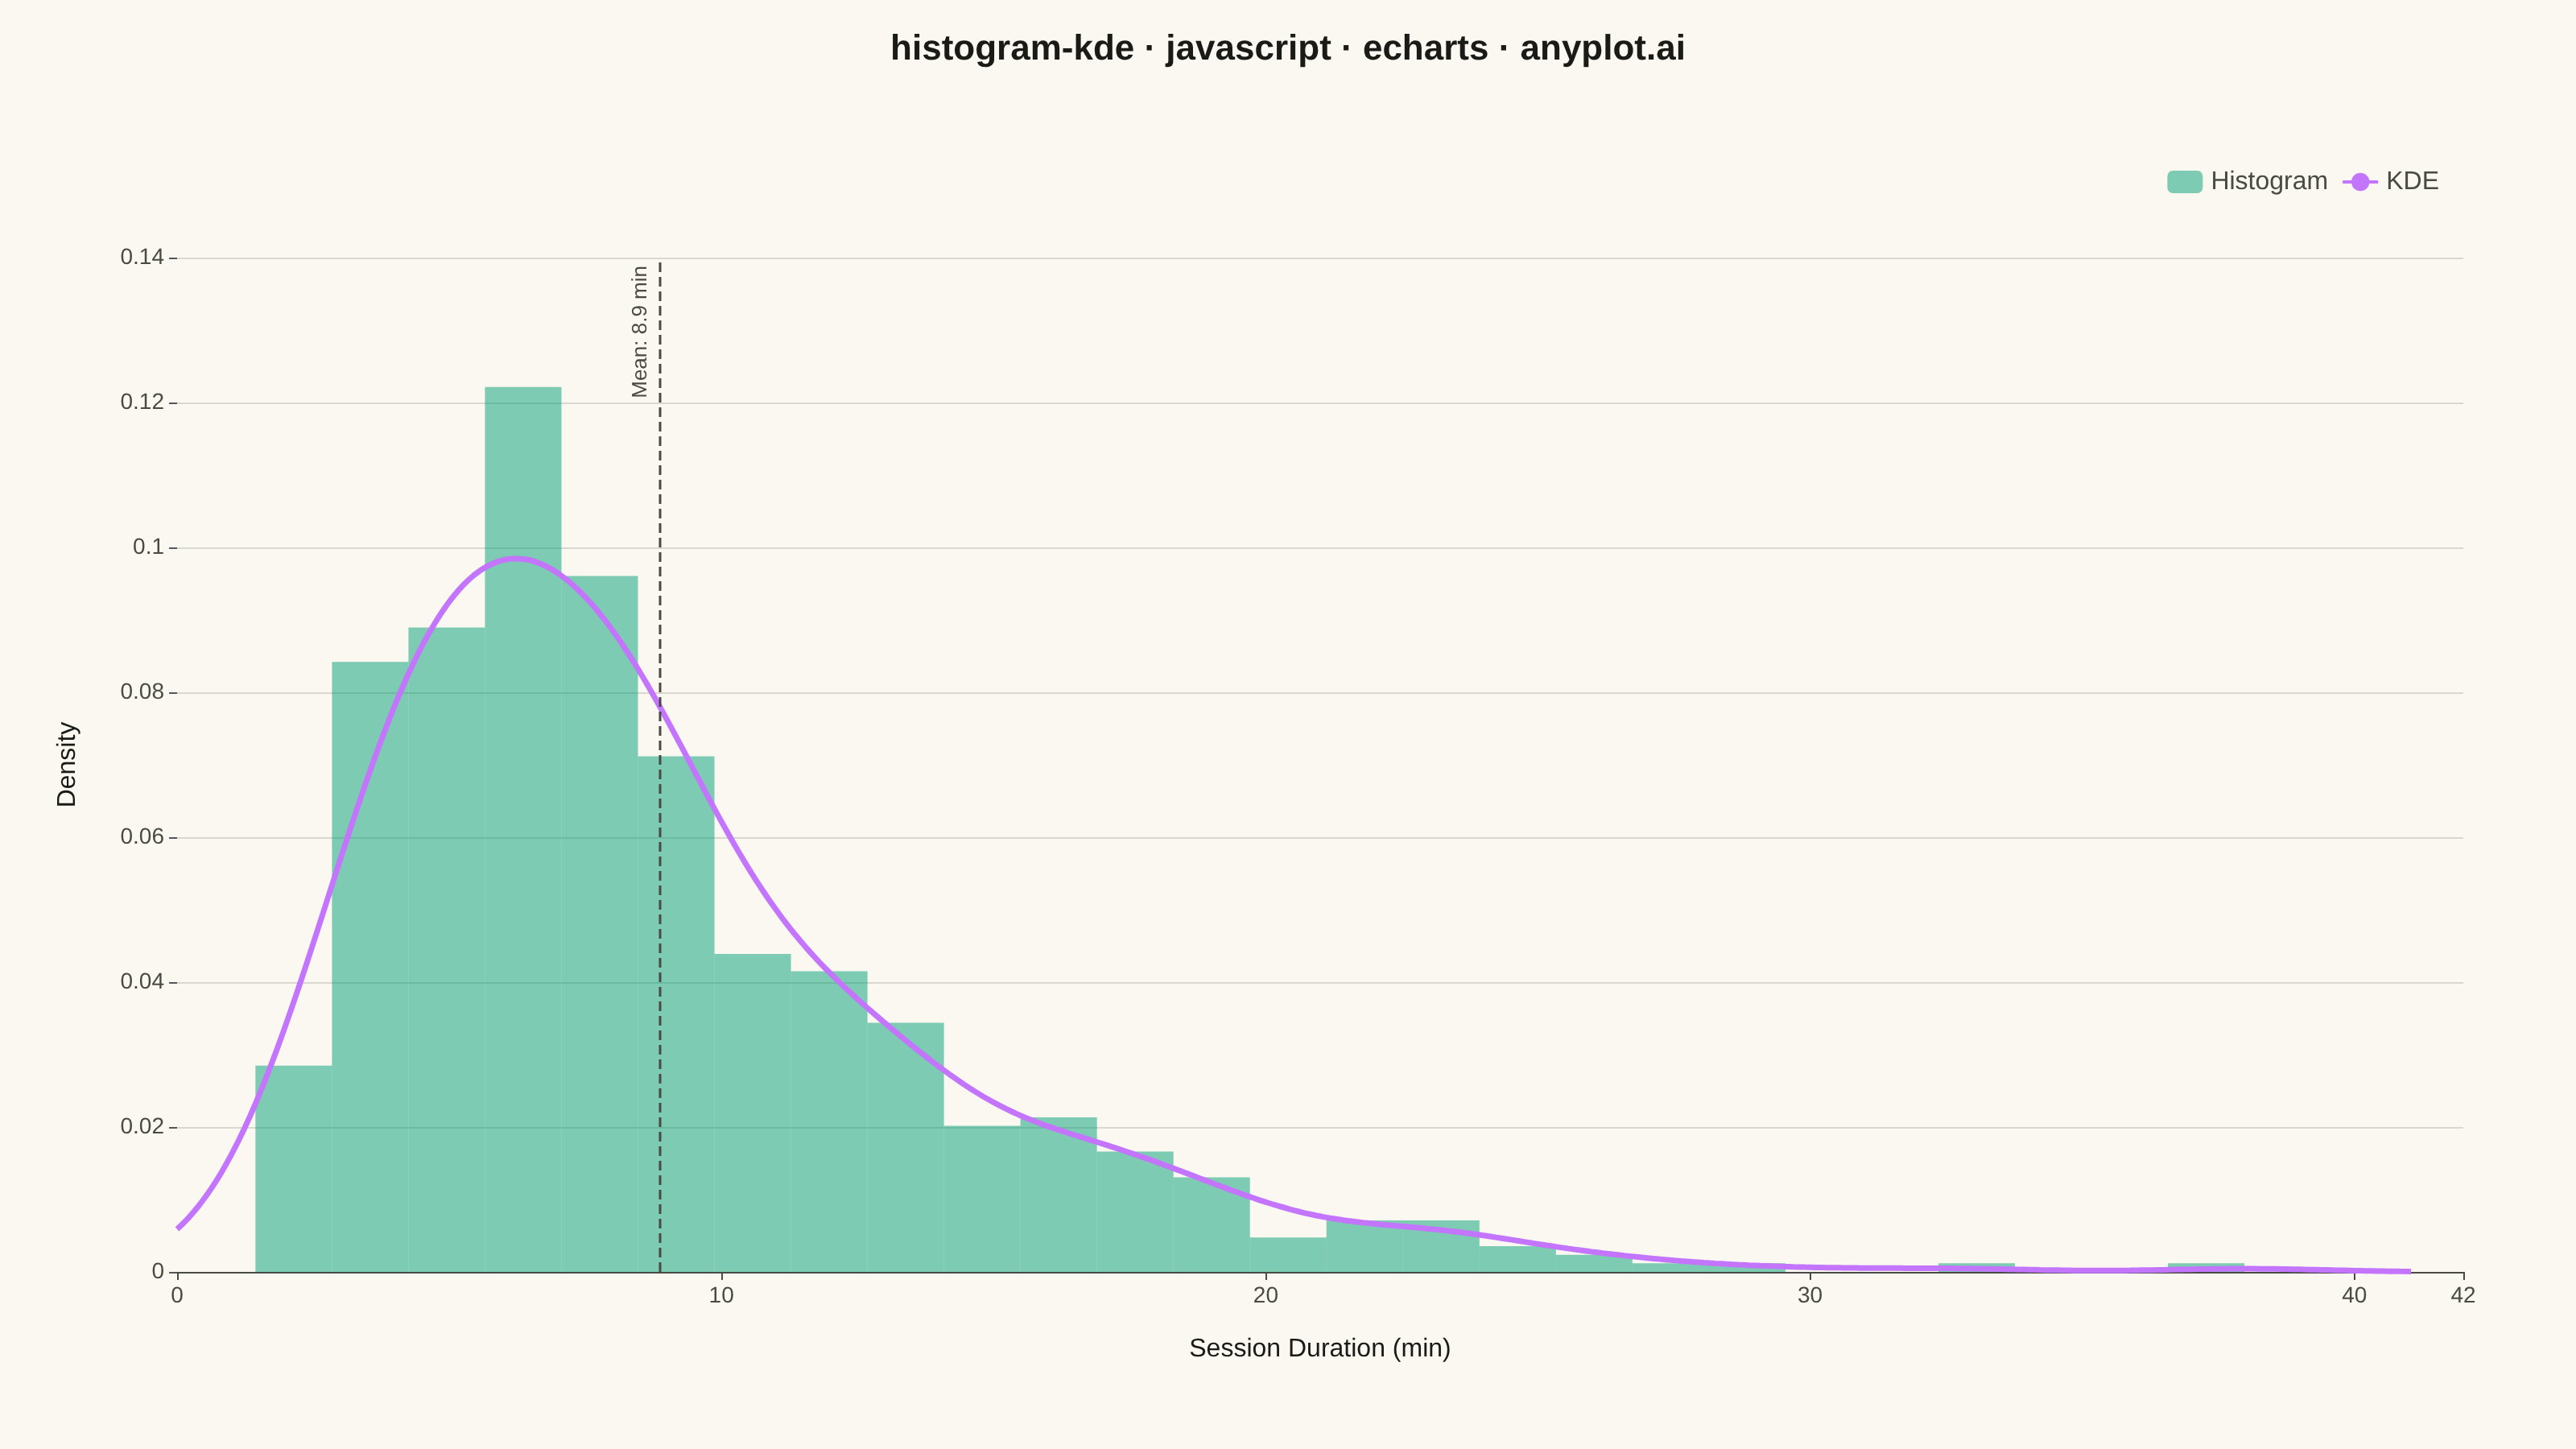
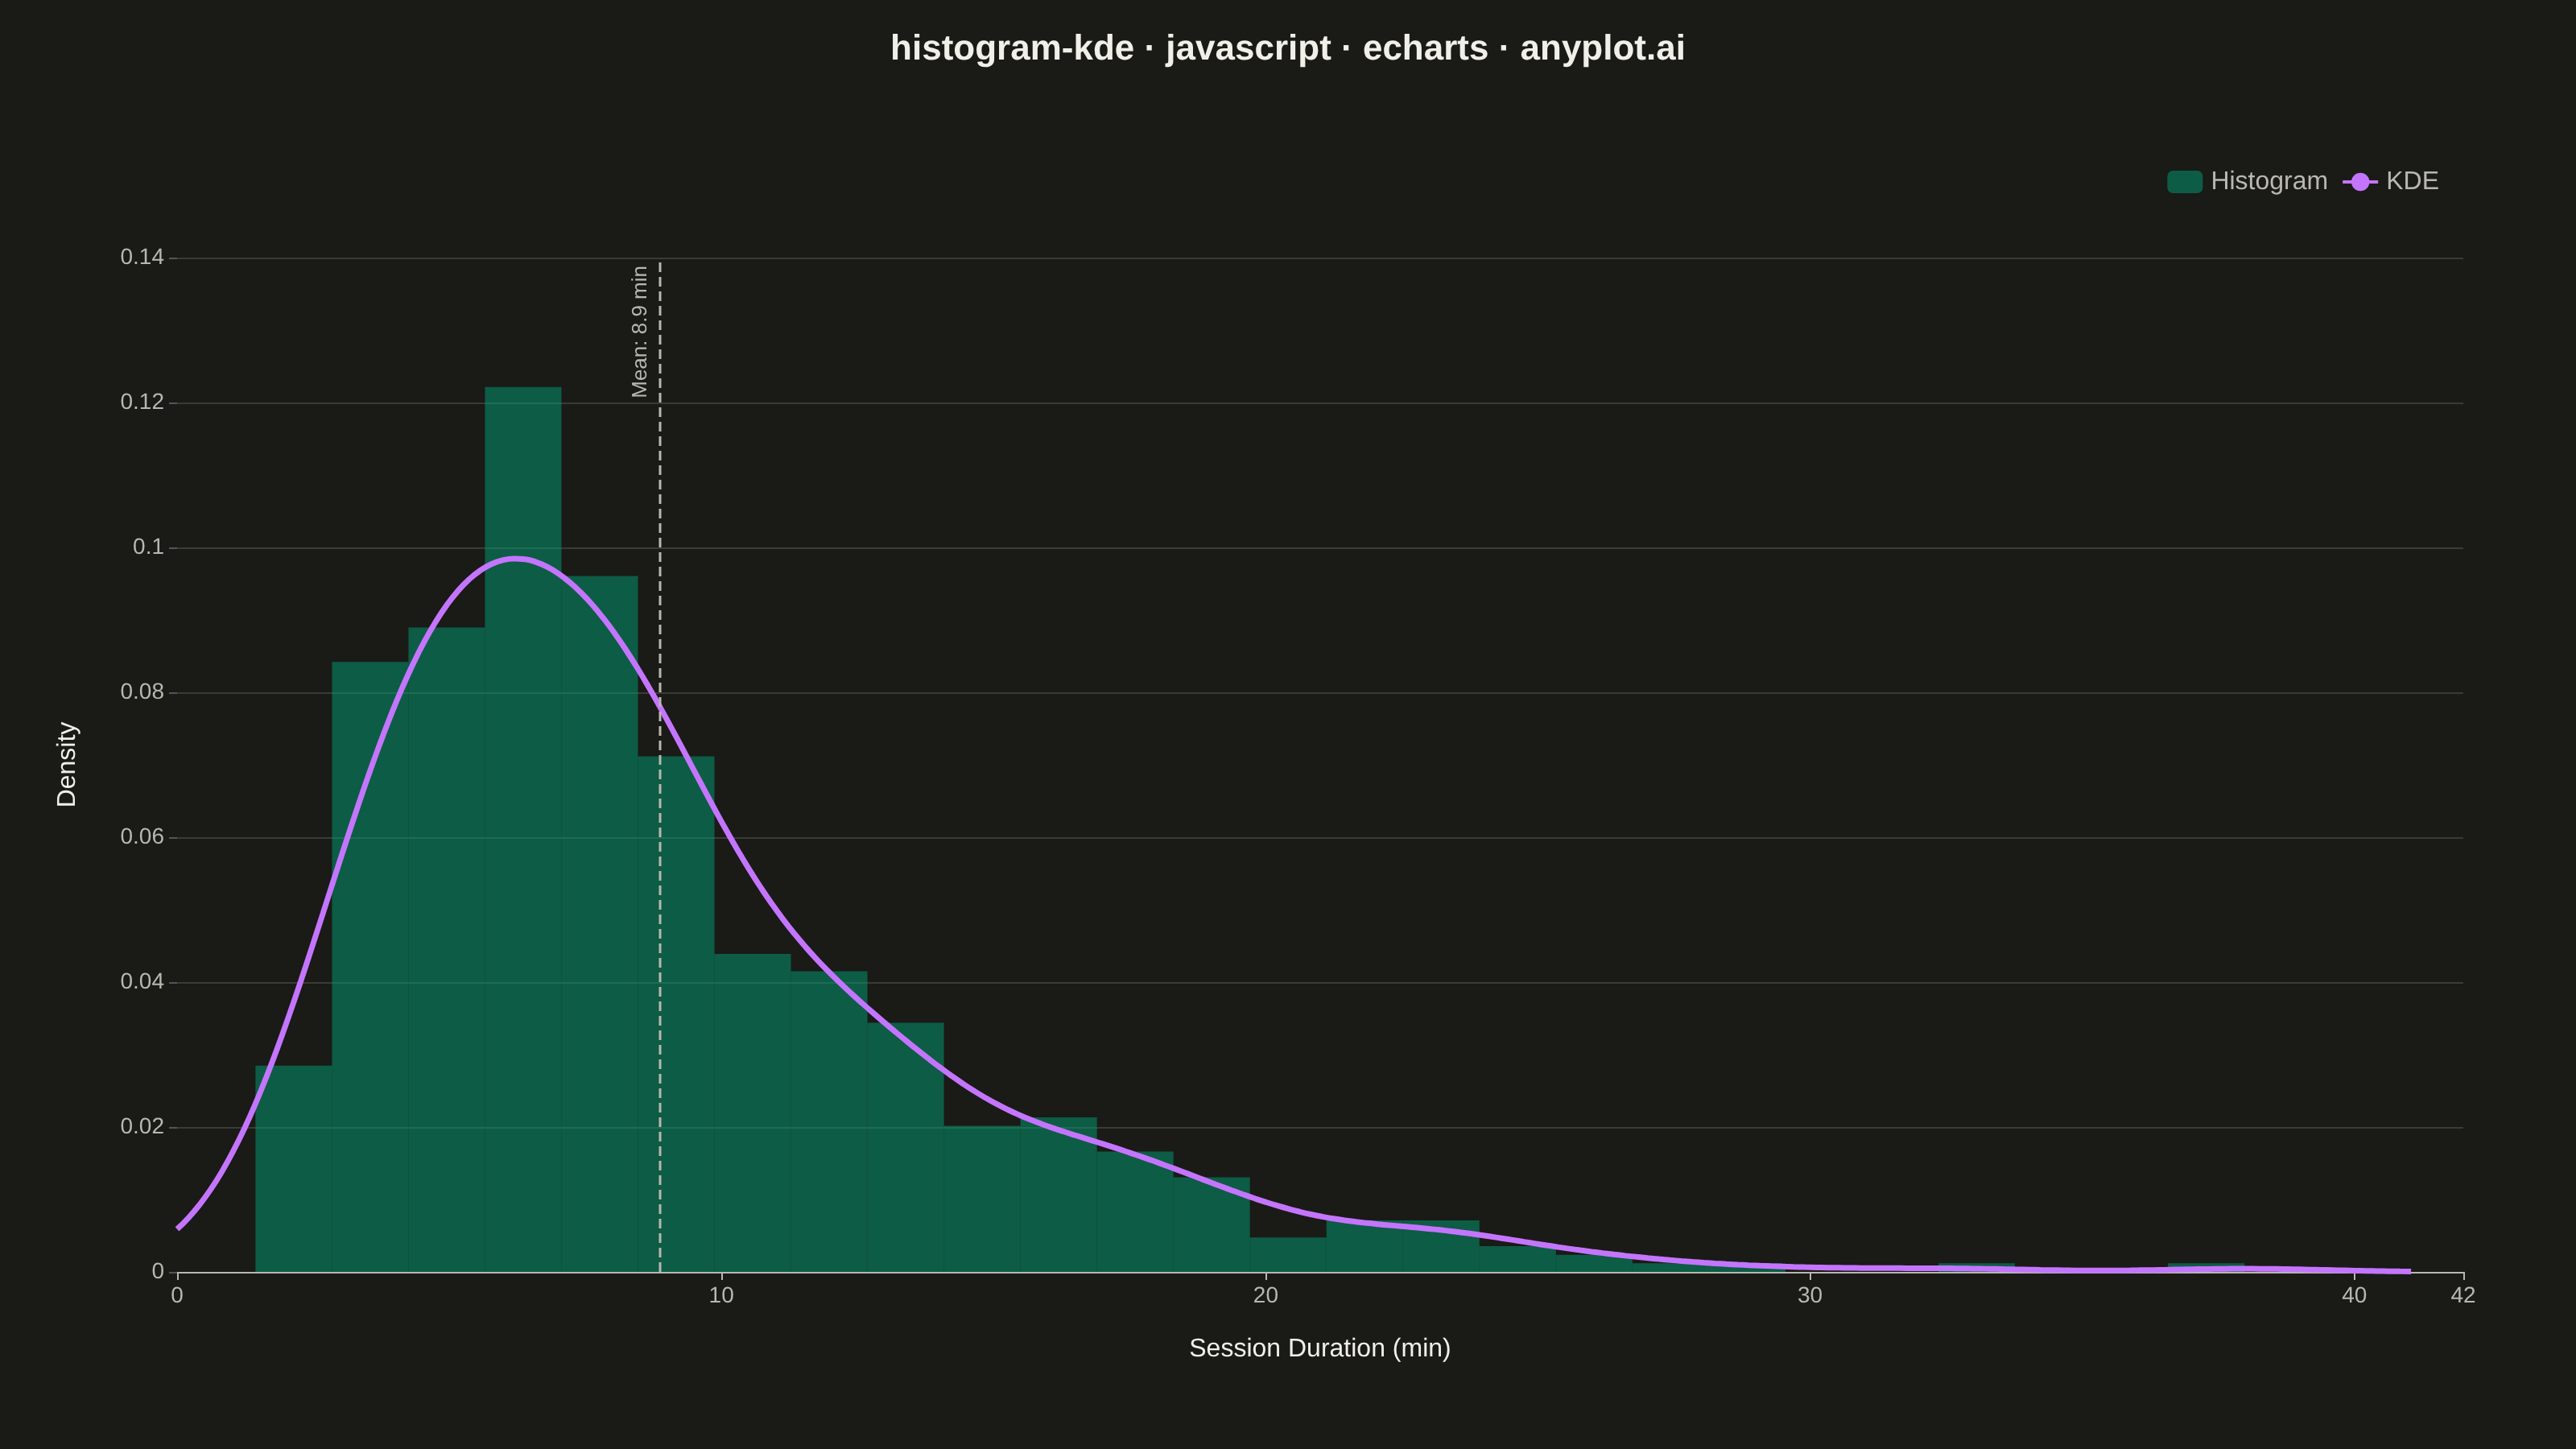
A histogram with kernel density estimate (KDE) overlay combines discrete binning with continuous density estimation to visualize the distribution of continuous data. The histogram bars show frequency counts in each bin while the smooth KDE curve reveals the underlying probability density, making it easier to perceive the true shape of the distribution without binning artifacts.
// anyplot.ai
// histogram-kde: Histogram with KDE Overlay
// Library: echarts 6.1.0 | JavaScript 22.23.1
// Quality: 93/100 | Created: 2026-08-05

const t = window.ANYPLOT_TOKENS;

// --- Data (in-memory, deterministic LCG + Box-Muller) -----------------------
function makeLcg(seed) {
  let state = seed >>> 0;
  return function () {
    state = (1103515245 * state + 12345) >>> 0;
    return state / 4294967296;
  };
}
const rand = makeLcg(42);
function randNormal() {
  const u1 = Math.max(rand(), 1e-12);
  const u2 = rand();
  return Math.sqrt(-2 * Math.log(u1)) * Math.cos(2 * Math.PI * u2);
}

// Customer session durations (minutes) — right-skewed, lognormal-shaped.
const n = 600;
const mu = Math.log(8);
const sigma = 0.55;
const durations = [];
for (let i = 0; i < n; i++) {
  durations.push(Math.exp(mu + sigma * randNormal()));
}

// --- Histogram (density-scaled) ---------------------------------------------
const binCount = 26;
const dataMin = Math.min(...durations);
const dataMax = Math.max(...durations);
const binWidth = (dataMax - dataMin) / binCount;
const counts = new Array(binCount).fill(0);
durations.forEach((v) => {
  const idx = Math.min(binCount - 1, Math.floor((v - dataMin) / binWidth));
  counts[idx]++;
});
const histData = counts.map((count, i) => [
  dataMin + (i + 0.5) * binWidth,
  count / (n * binWidth),
]);

// --- KDE (Gaussian kernel, Silverman-style bandwidth) -----------------------
const mean = durations.reduce((a, b) => a + b, 0) / n;
const variance = durations.reduce((a, b) => a + (b - mean) ** 2, 0) / (n - 1);
const std = Math.sqrt(variance);
const bandwidth = 1.06 * std * Math.pow(n, -0.2);

const kdePoints = 200;
const xMin = Math.max(0, dataMin - 2 * bandwidth);
const xMax = dataMax + 2 * bandwidth;
const kdeData = [];
for (let i = 0; i < kdePoints; i++) {
  const x = xMin + ((xMax - xMin) * i) / (kdePoints - 1);
  let density = 0;
  for (let j = 0; j < n; j++) {
    const u = (x - durations[j]) / bandwidth;
    density += Math.exp(-0.5 * u * u);
  }
  density /= n * bandwidth * Math.sqrt(2 * Math.PI);
  kdeData.push([x, density]);
}

// --- Custom renderItem: pixel-perfect histogram bars -------------------------
function renderHistogramBar(params, api) {
  const yValue = api.value(1);
  const start = api.coord([api.value(0) - binWidth / 2, yValue]);
  const end = api.coord([api.value(0) + binWidth / 2, 0]);
  const rectShape = echarts.graphic.clipRectByRect(
    {
      x: start[0],
      y: start[1],
      width: end[0] - start[0],
      height: end[1] - start[1],
    },
    {
      x: params.coordSys.x,
      y: params.coordSys.y,
      width: params.coordSys.width,
      height: params.coordSys.height,
    },
  );
  return (
    rectShape && {
      type: "rect",
      shape: rectShape,
      style: api.style(),
    }
  );
}

// --- Init ---------------------------------------------------------------------
const chart = echarts.init(document.getElementById("container"));

// --- Option ---------------------------------------------------------------------
chart.setOption({
  animation: false,
  color: [t.palette[0], t.palette[1]],
  backgroundColor: "transparent",
  title: {
    text: "histogram-kde · javascript · echarts · anyplot.ai",
    left: "center",
    textStyle: { color: t.ink, fontSize: 22 },
  },
  legend: {
    data: ["Histogram", "KDE"],
    top: 100,
    right: 80,
    textStyle: { color: t.inkSoft, fontSize: 16 },
    itemWidth: 22,
    itemHeight: 14,
  },
  grid: { left: 110, right: 70, top: 160, bottom: 110 },
  xAxis: {
    type: "value",
    name: "Session Duration (min)",
    nameLocation: "middle",
    nameGap: 40,
    nameTextStyle: { color: t.ink, fontSize: 16 },
    min: 0,
    max: Math.ceil(xMax),
    axisLabel: { color: t.inkSoft, fontSize: 14 },
    axisLine: { lineStyle: { color: t.inkSoft } },
    splitLine: { show: false },
  },
  yAxis: {
    type: "value",
    name: "Density",
    nameLocation: "middle",
    nameGap: 60,
    nameTextStyle: { color: t.ink, fontSize: 16 },
    min: 0,
    axisLabel: { color: t.inkSoft, fontSize: 14 },
    axisLine: { show: false },
    splitLine: { lineStyle: { color: t.grid } },
  },
  series: [
    {
      type: "custom",
      name: "Histogram",
      coordinateSystem: "cartesian2d",
      renderItem: renderHistogramBar,
      data: histData,
      itemStyle: { color: t.palette[0], opacity: 0.5 },
      z: 1,
    },
    {
      type: "line",
      name: "KDE",
      data: kdeData,
      smooth: true,
      symbol: "none",
      lineStyle: { width: 3.5, color: t.palette[1] },
      itemStyle: { color: t.palette[1] },
      z: 2,
      markLine: {
        symbol: "none",
        silent: true,
        animation: false,
        label: {
          formatter: (p) => `Mean: ${p.value.toFixed(1)} min`,
          position: "insideEndTop",
          color: t.inkSoft,
          fontSize: 13,
        },
        lineStyle: { color: t.inkSoft, type: "dashed", width: 1.5 },
        data: [{ xAxis: mean }],
      },
    },
  ],
});
Runnable source as JSON, for any HTTP client: https://api.anyplot.ai/specs/histogram-kde/echarts/code. Any spec id and library id listed in llms-full.txt fit the same URL shape; every URL below is complete and callable.
{
  "spec_id": "histogram-kde",
  "language": "javascript",
  "library": "echarts",
  "page": "https://anyplot.ai/histogram-kde/javascript/echarts",
  "hub": "https://anyplot.ai/histogram-kde",
  "code_json": "https://api.anyplot.ai/specs/histogram-kde/echarts/code",
  "spec_json": "https://api.anyplot.ai/specs/histogram-kde",
  "render_light_png": "https://storage.googleapis.com/anyplot-images/plots/histogram-kde/javascript/echarts/plot-light.png",
  "render_dark_png": "https://storage.googleapis.com/anyplot-images/plots/histogram-kde/javascript/echarts/plot-dark.png",
  "interactive_light_html": "https://storage.googleapis.com/anyplot-images/plots/histogram-kde/javascript/echarts/plot-light.html",
  "interactive_dark_html": "https://storage.googleapis.com/anyplot-images/plots/histogram-kde/javascript/echarts/plot-dark.html",
  "quality_score": 93.0,
  "license": "MIT",
  "guide": "https://anyplot.ai/llms.txt"
}
Part of Histogram with KDE Overlay on anyplot.ai.