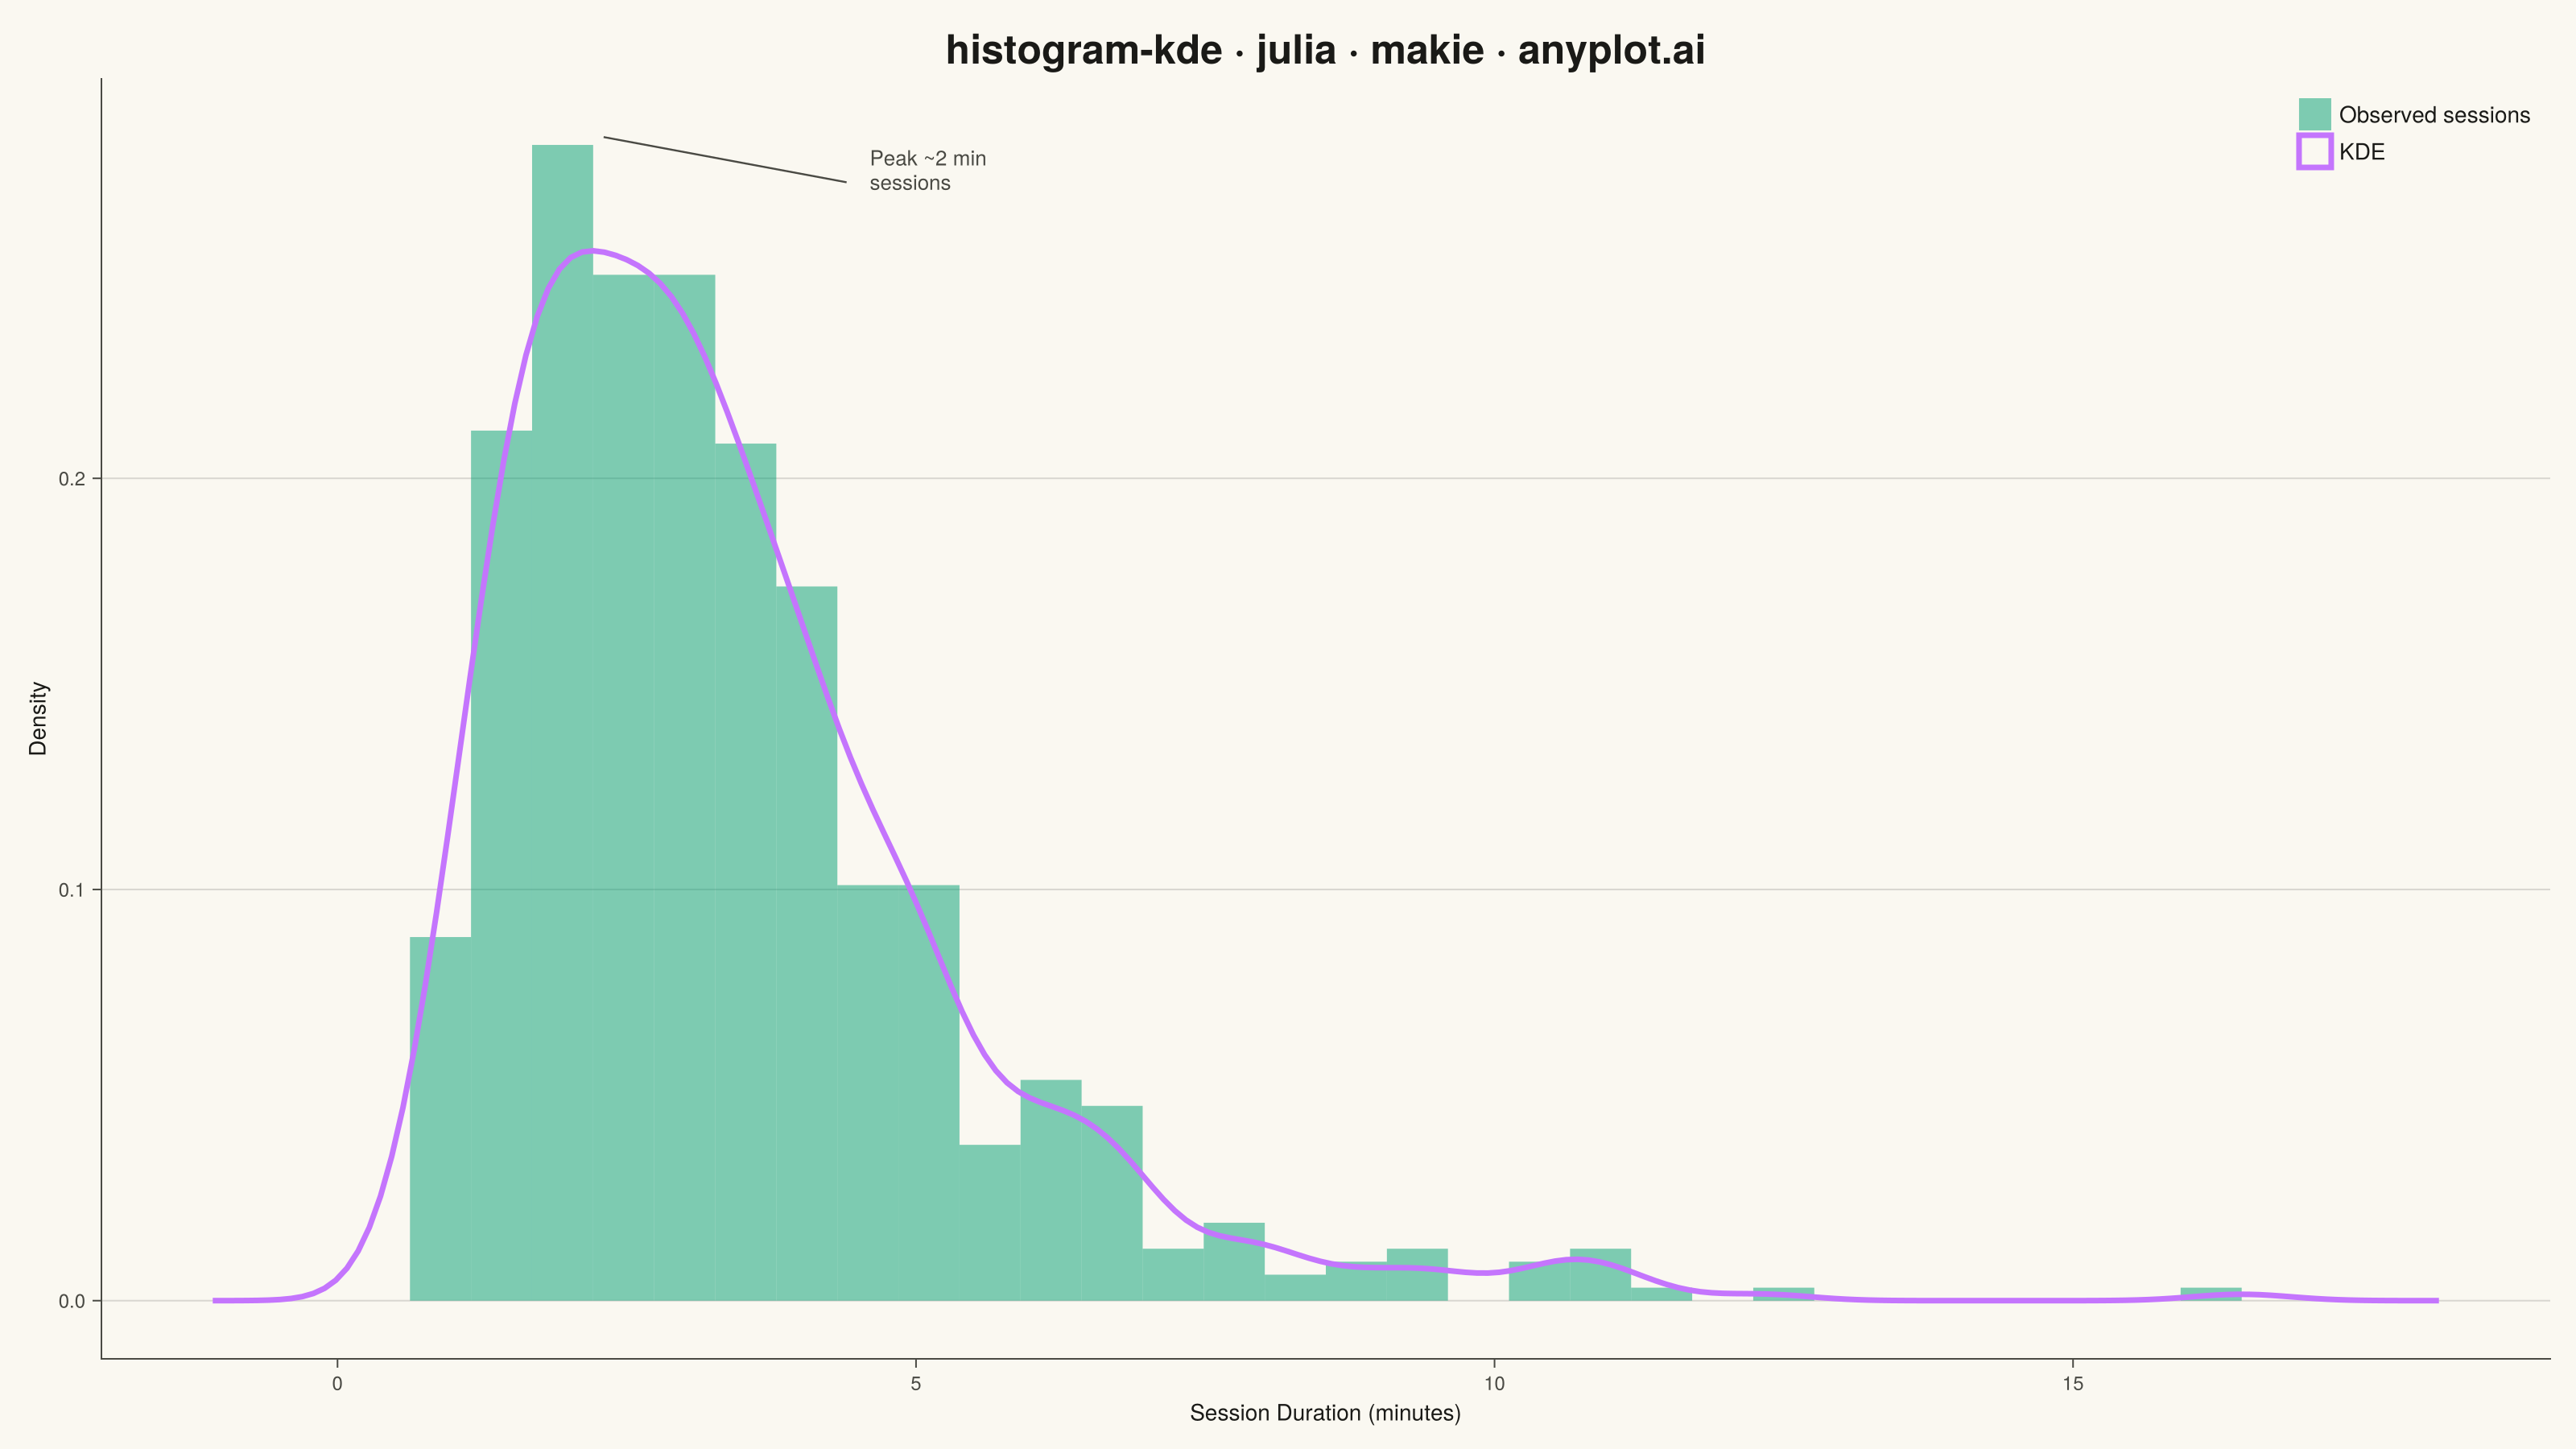
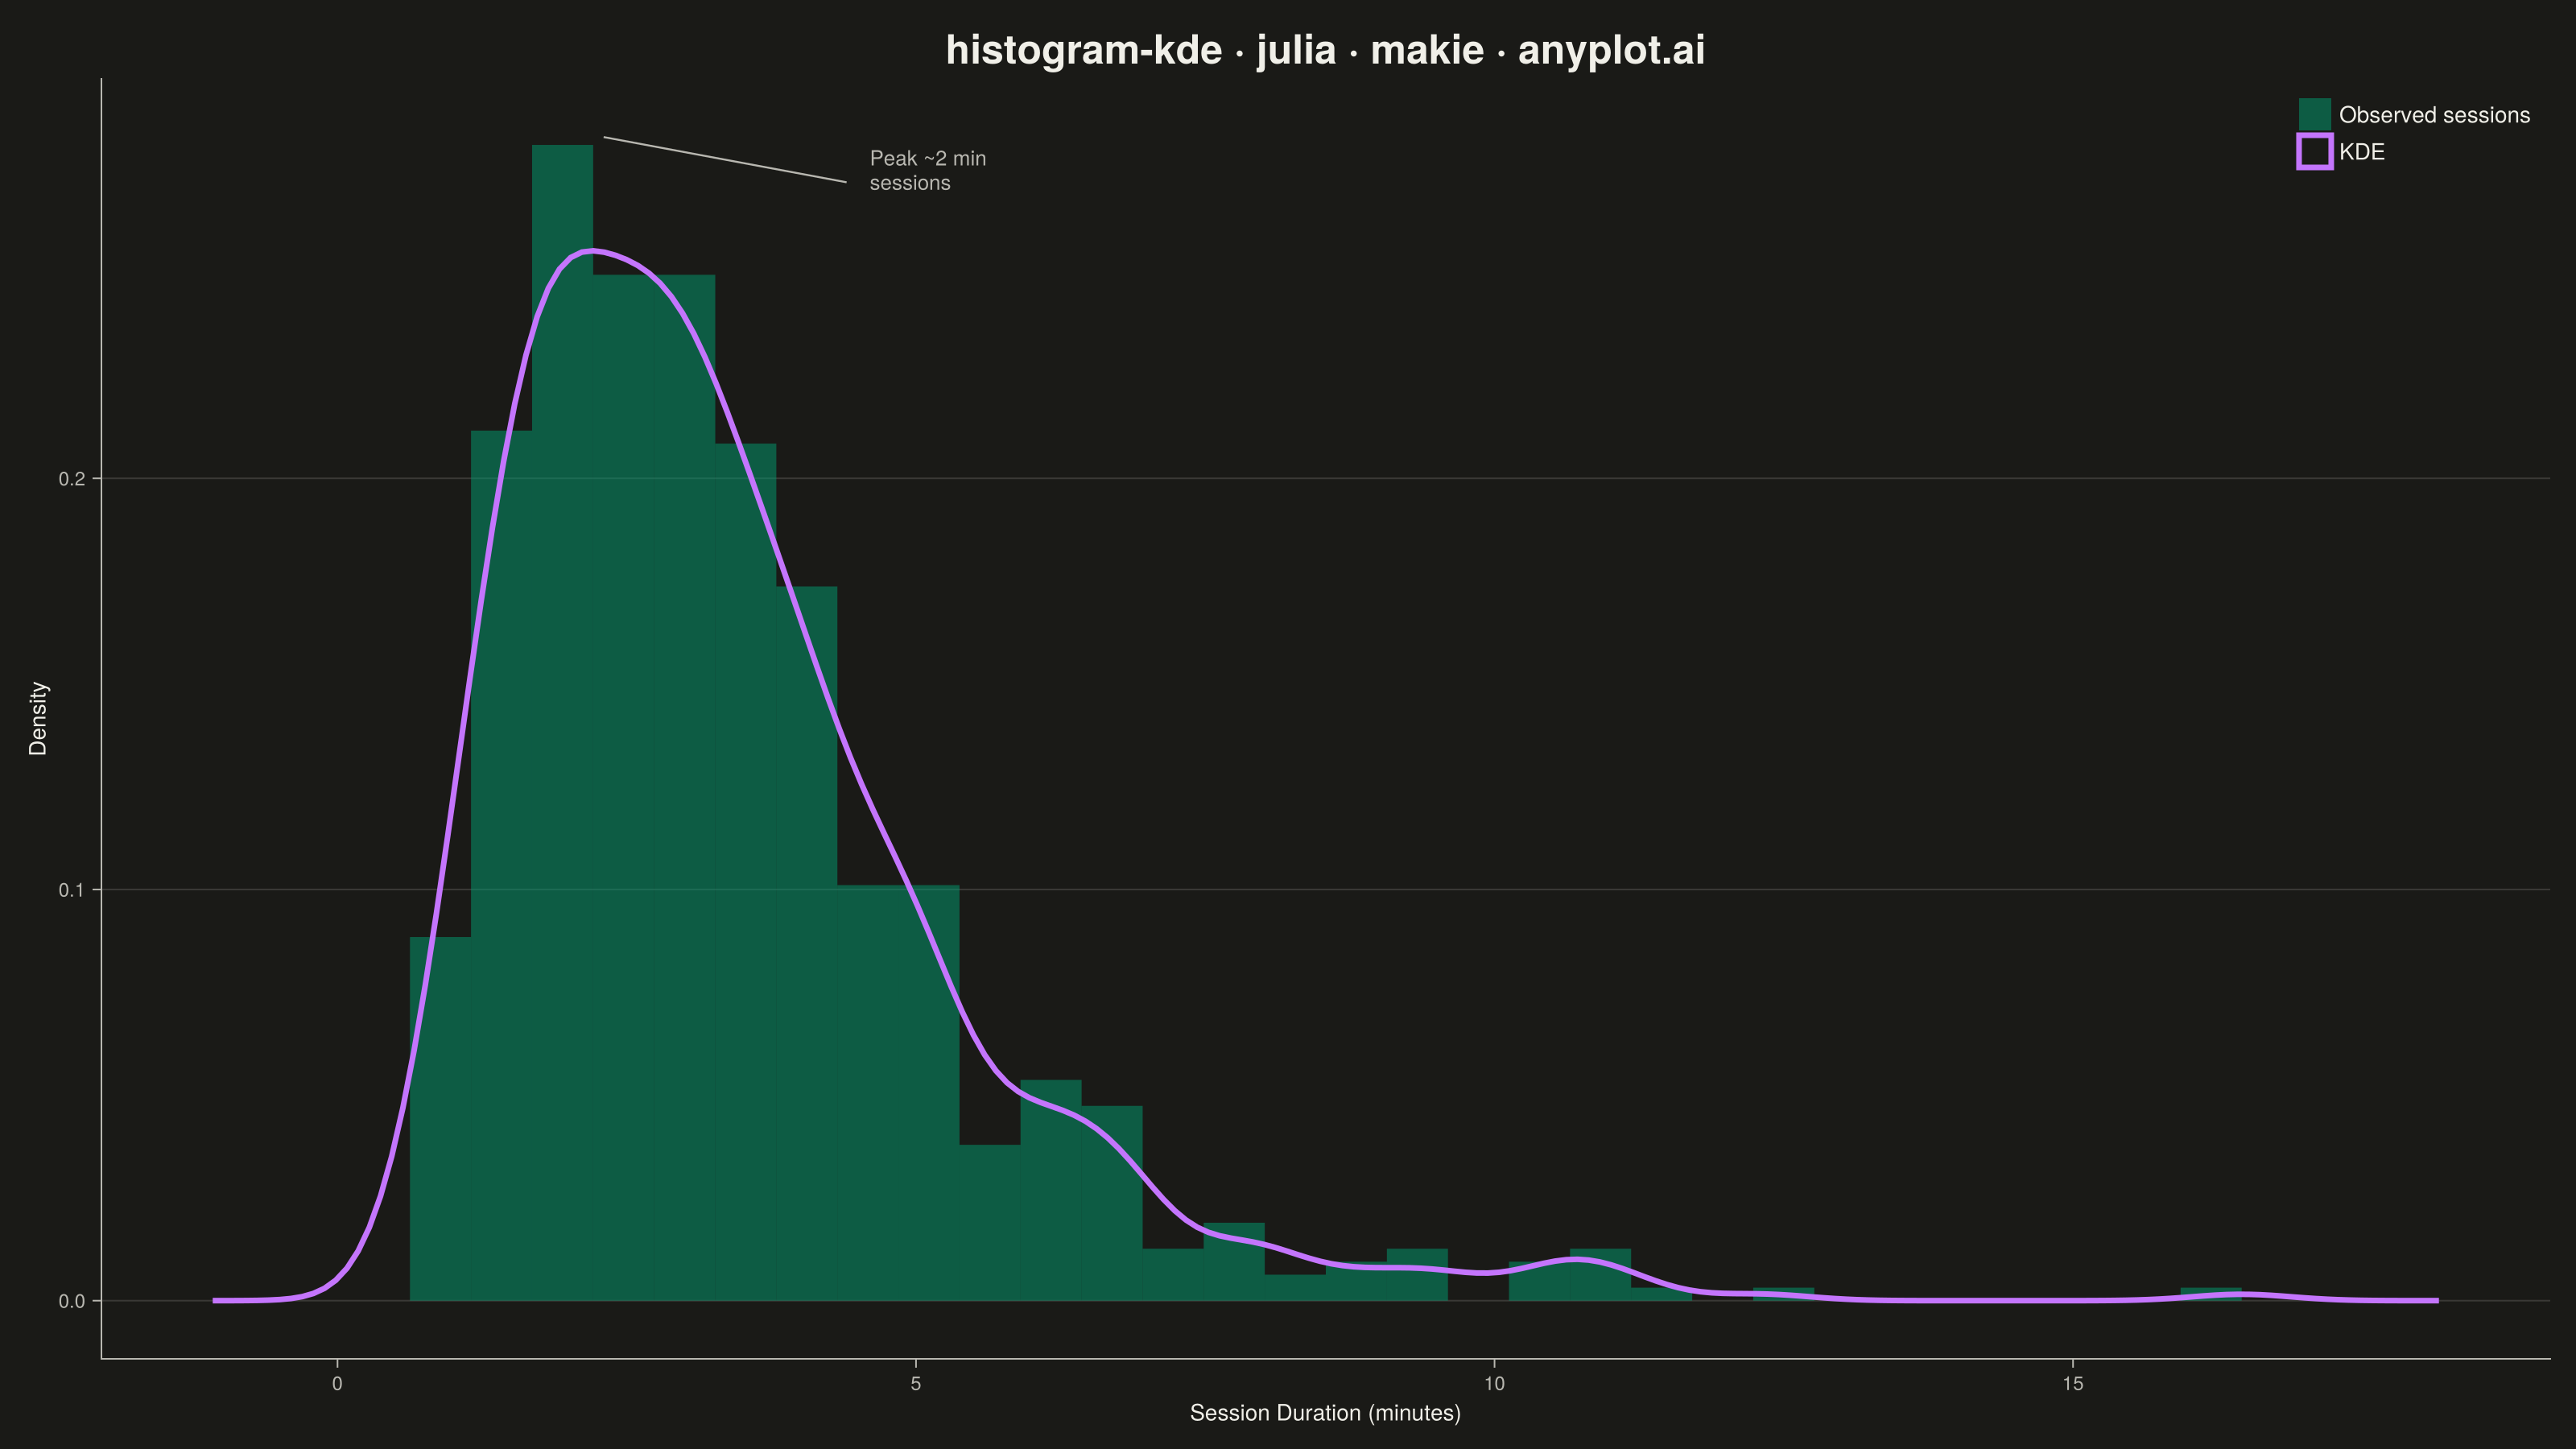
A histogram with kernel density estimate (KDE) overlay combines discrete binning with continuous density estimation to visualize the distribution of continuous data. The histogram bars show frequency counts in each bin while the smooth KDE curve reveals the underlying probability density, making it easier to perceive the true shape of the distribution without binning artifacts.
# anyplot.ai
# histogram-kde: Histogram with KDE Overlay
# Library: makie 0.21.9 | Julia 1.11.9
# Quality: 89/100 | Created: 2026-08-05

using CairoMakie
using Colors
using Random

Random.seed!(42)

# --- Theme tokens -----------------------------------------------------------
const THEME    = get(ENV, "ANYPLOT_THEME", "light")
const PAGE_BG  = THEME == "light" ? colorant"#FAF8F1" : colorant"#1A1A17"
const INK      = THEME == "light" ? colorant"#1A1A17" : colorant"#F0EFE8"
const INK_SOFT = THEME == "light" ? colorant"#4A4A44" : colorant"#B8B7B0"
const ELEVATED_BG = THEME == "light" ? colorant"#FFFDF6" : colorant"#242420"

# Imprint categorical palette — 8 hues, theme-independent, hybrid-v3 sort
const IMPRINT_PALETTE = [
    colorant"#009E73", colorant"#C475FD", colorant"#4467A3", colorant"#BD8233",
    colorant"#AE3030", colorant"#2ABCCD", colorant"#954477", colorant"#99B314",
]

# --- Data ---------------------------------------------------------------
# Customer session duration on a marketing site — right-skewed: most visits
# are brief, a long tail of engaged sessions stretches the distribution.
n = 600
session_minutes = exp.(1.1 .+ 0.55 .* randn(n))

# --- Plot -----------------------------------------------------------------
fig = Figure(
    resolution      = (1600, 900),
    fontsize        = 14,
    backgroundcolor = PAGE_BG,
)

ax = Axis(
    fig[1, 1];
    title              = "histogram-kde · julia · makie · anyplot.ai",
    titlesize          = 25,
    titlecolor         = INK,
    xlabel             = "Session Duration (minutes)",
    ylabel             = "Density",
    xlabelsize         = 14,
    ylabelsize         = 14,
    xlabelcolor        = INK,
    ylabelcolor        = INK,
    xticklabelsize     = 12,
    yticklabelsize     = 12,
    xticklabelcolor    = INK_SOFT,
    yticklabelcolor    = INK_SOFT,
    xtickcolor         = INK_SOFT,
    ytickcolor         = INK_SOFT,
    backgroundcolor    = PAGE_BG,
    topspinevisible    = false,
    rightspinevisible  = false,
    leftspinecolor     = INK_SOFT,
    bottomspinecolor   = INK_SOFT,
    ygridcolor         = RGBAf(INK.r, INK.g, INK.b, 0.15),
    xgridvisible       = false,
)

hist!(
    ax, session_minutes;
    bins = 30,
    normalization = :pdf,
    color = (IMPRINT_PALETTE[1], 0.5),
    strokewidth = 0,
    label = "Observed sessions",
)

density!(
    ax, session_minutes;
    color = :transparent,
    strokecolor = IMPRINT_PALETTE[2],
    strokewidth = 3.5,
    label = "KDE",
)

axislegend(
    ax;
    position = :rt,
    labelcolor = INK,
    backgroundcolor = ELEVATED_BG,
    framevisible = false,
)

# --- Annotation: call out the peak session length ---------------------------
text!(
    ax, 4.6, 0.275;
    text = "Peak ~2 min\nsessions",
    color = INK_SOFT,
    fontsize = 13,
    align = (:left, :center),
)
lines!(
    ax, [4.4, 2.3], [0.272, 0.283];
    color = INK_SOFT,
    linewidth = 1.2,
)

# --- Save -------------------------------------------------------------------
save("plot-$(THEME).png", fig; px_per_unit = 2)
Runnable source as JSON, for any HTTP client: https://api.anyplot.ai/specs/histogram-kde/makie/code. Any spec id and library id listed in llms-full.txt fit the same URL shape; every URL below is complete and callable.
{
  "spec_id": "histogram-kde",
  "language": "julia",
  "library": "makie",
  "page": "https://anyplot.ai/histogram-kde/julia/makie",
  "hub": "https://anyplot.ai/histogram-kde",
  "code_json": "https://api.anyplot.ai/specs/histogram-kde/makie/code",
  "spec_json": "https://api.anyplot.ai/specs/histogram-kde",
  "render_light_png": "https://storage.googleapis.com/anyplot-images/plots/histogram-kde/julia/makie/plot-light.png",
  "render_dark_png": "https://storage.googleapis.com/anyplot-images/plots/histogram-kde/julia/makie/plot-dark.png",
  "quality_score": 89.0,
  "license": "MIT",
  "guide": "https://anyplot.ai/llms.txt"
}
Part of Histogram with KDE Overlay on anyplot.ai.