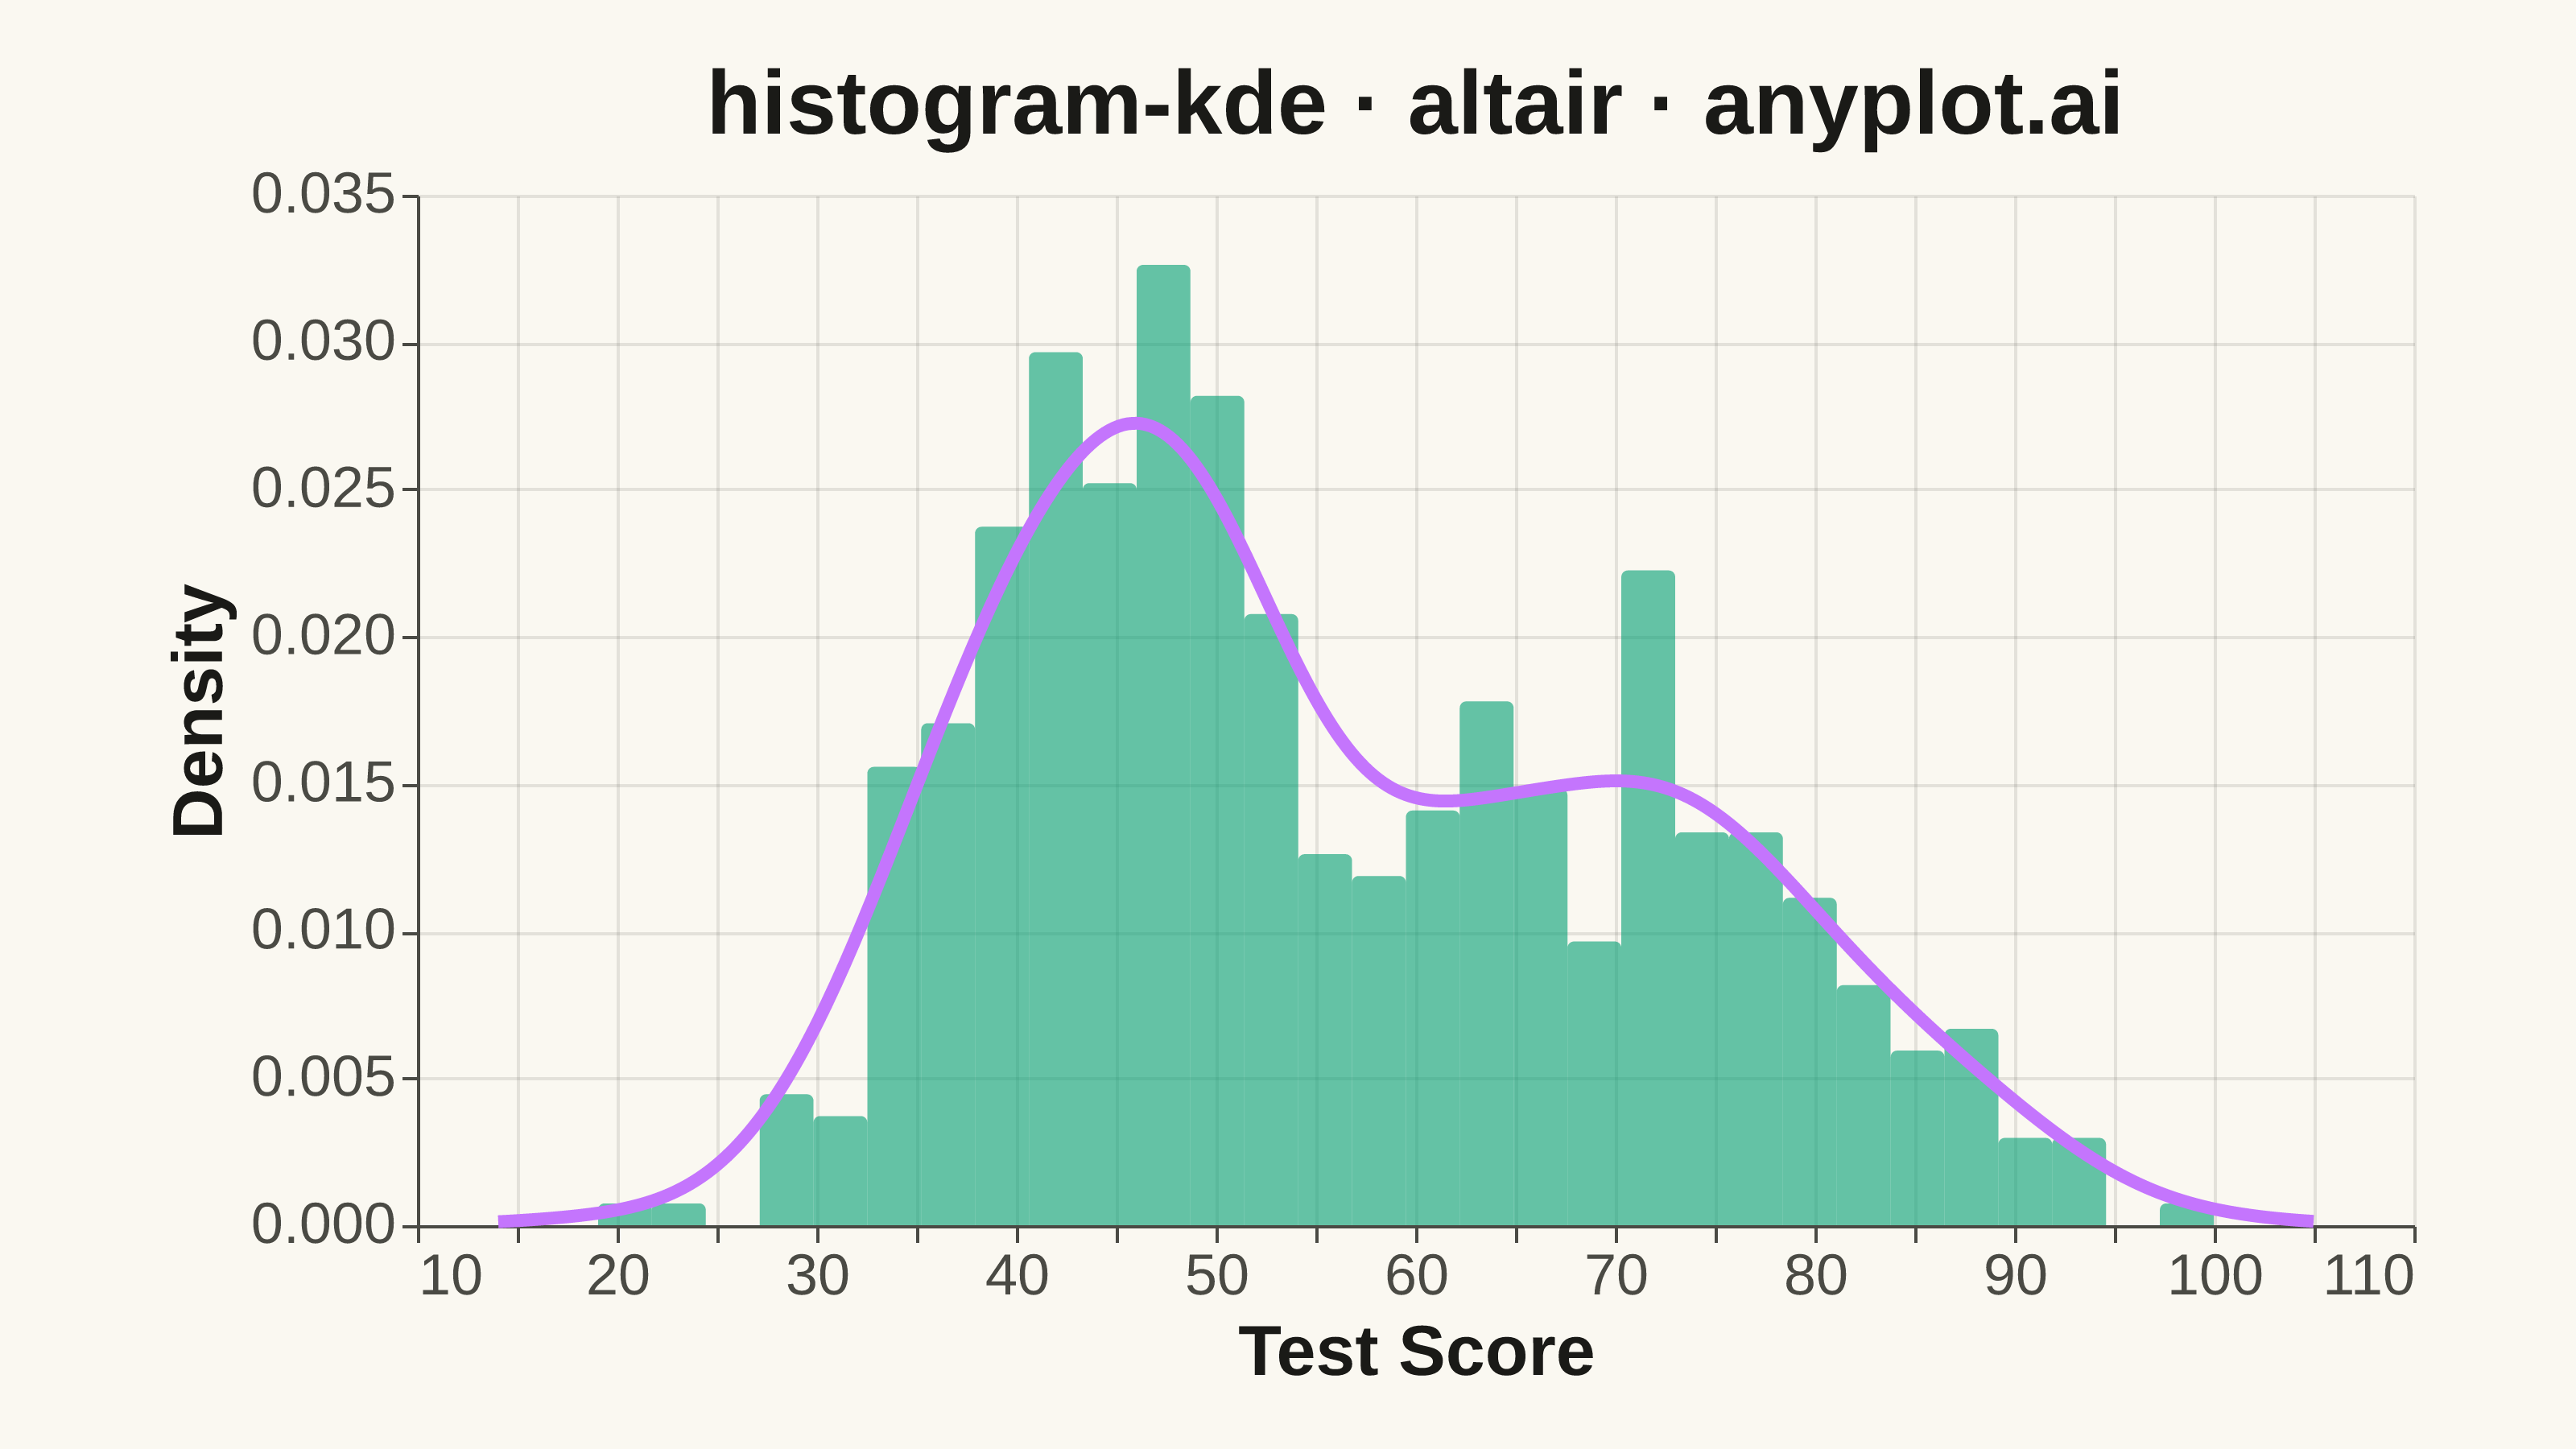
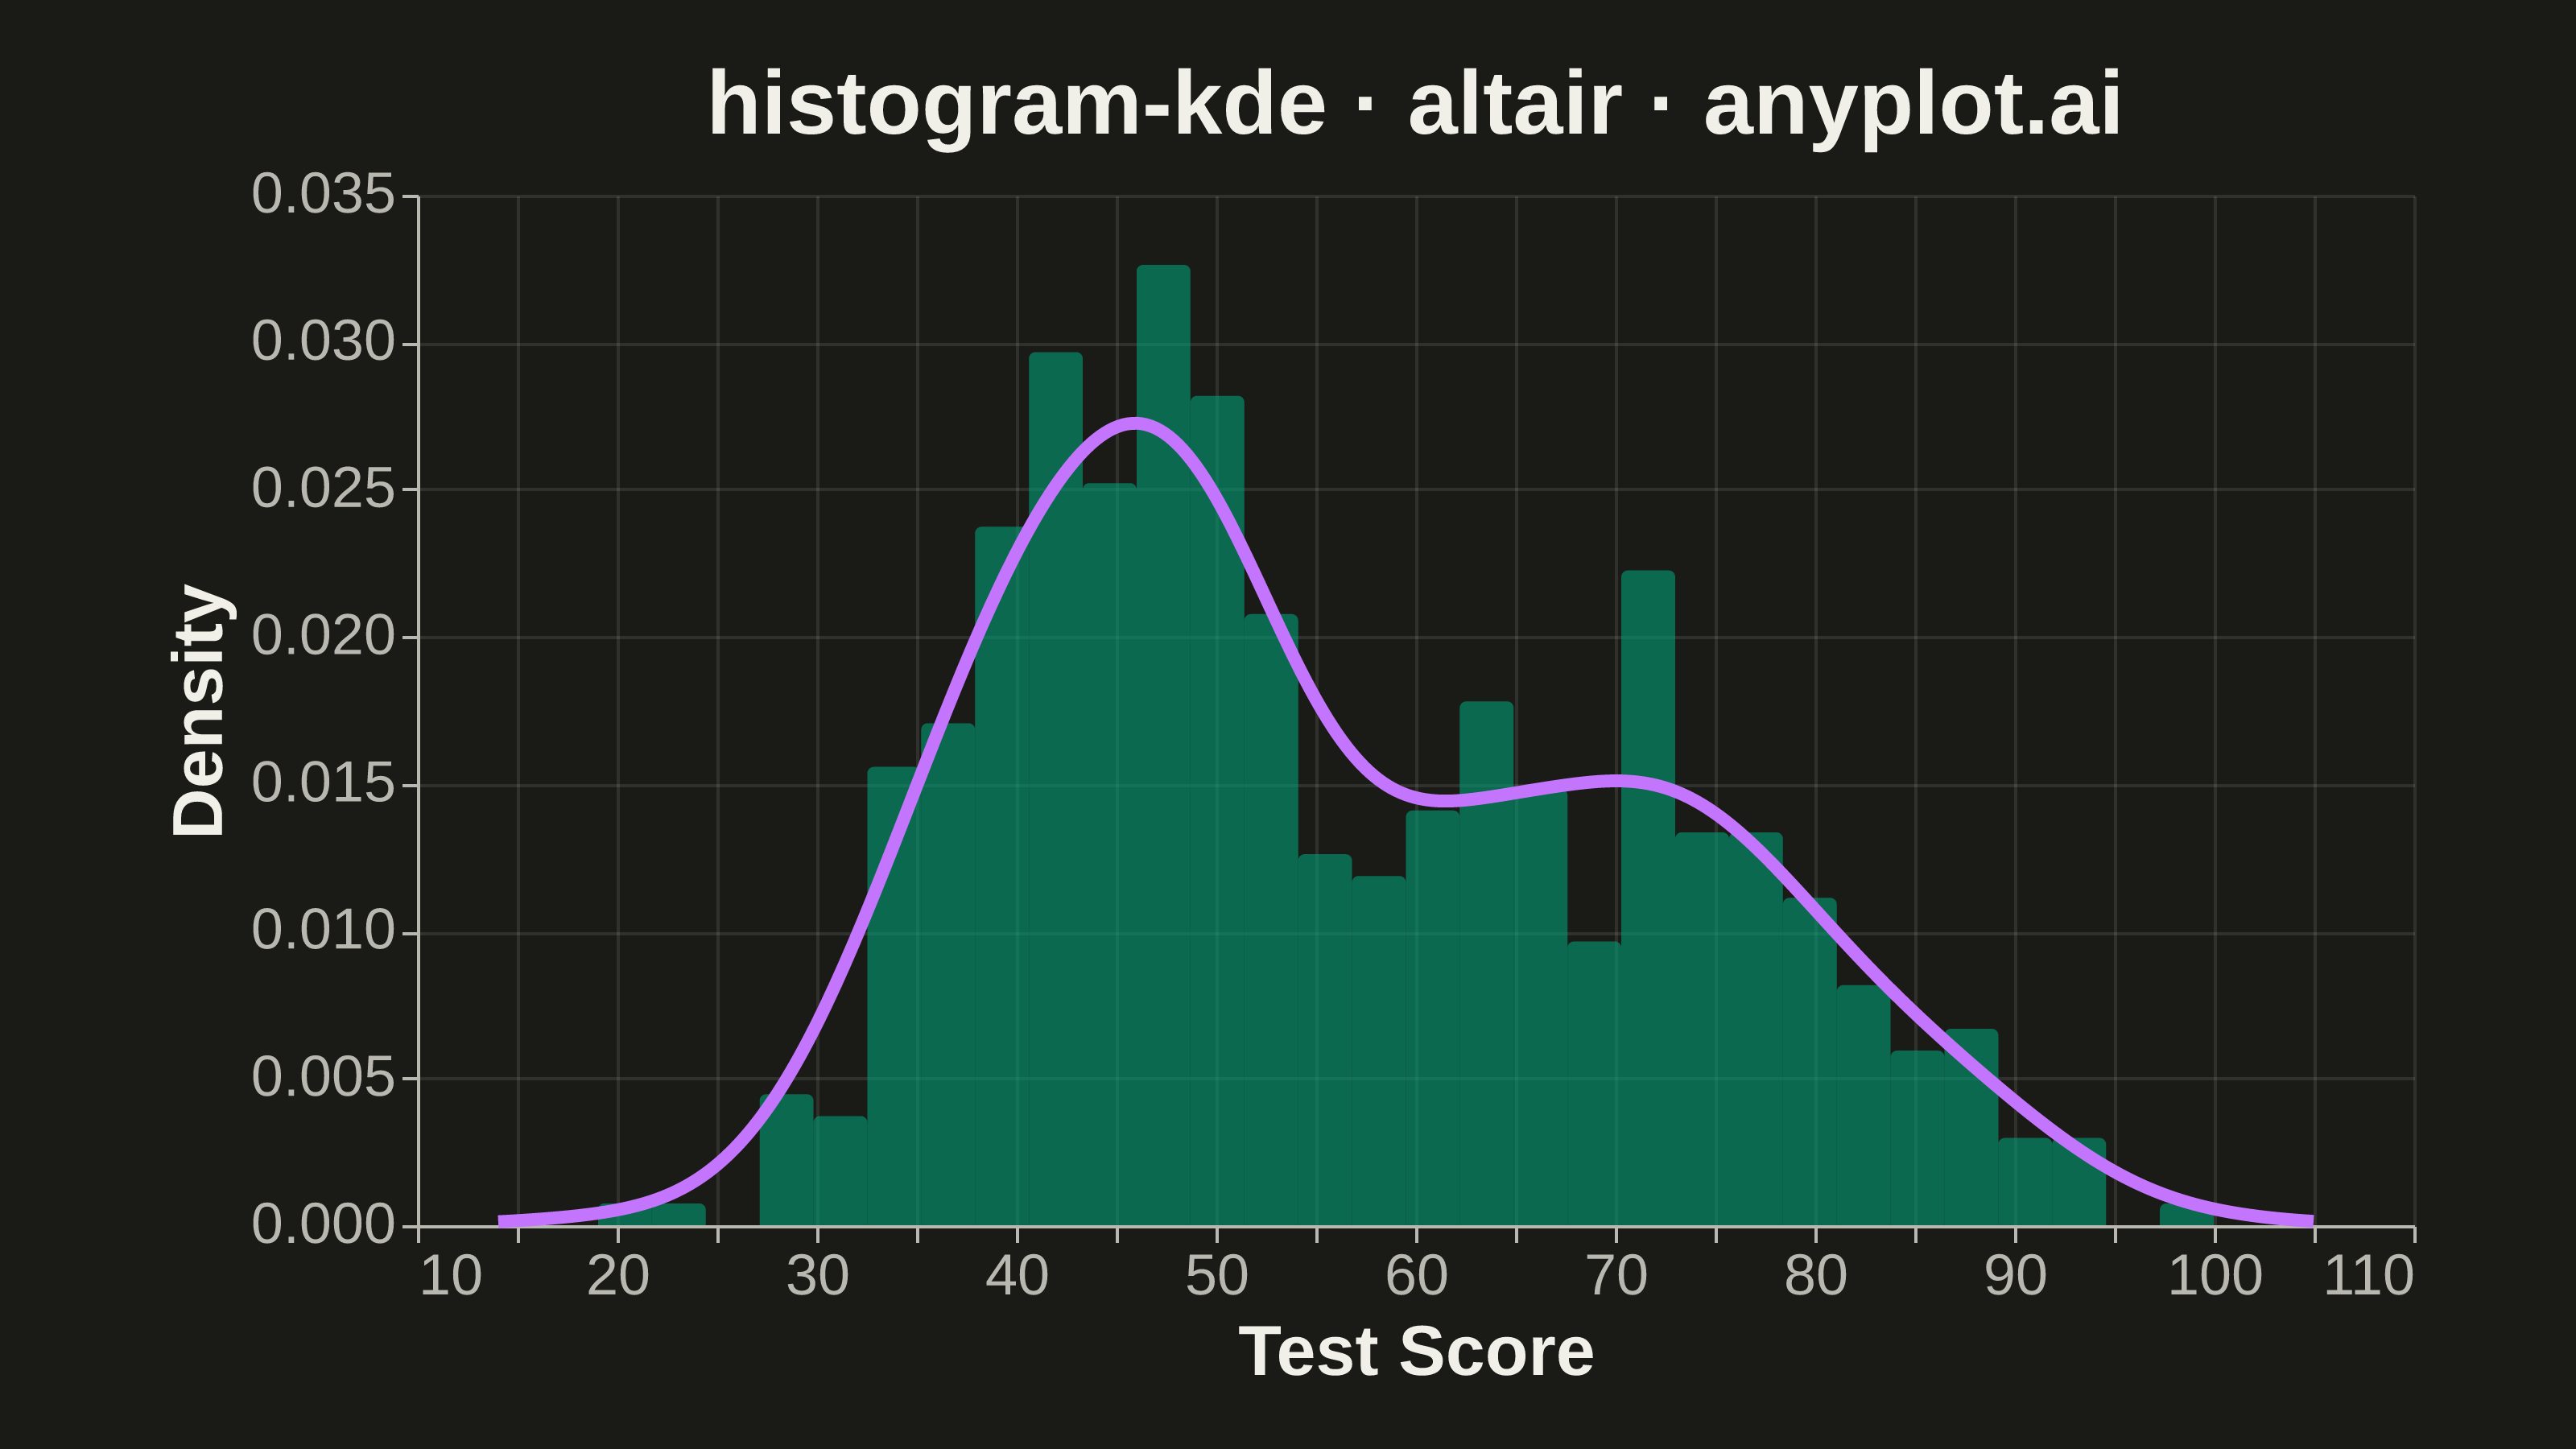
A histogram with kernel density estimate (KDE) overlay combines discrete binning with continuous density estimation to visualize the distribution of continuous data. The histogram bars show frequency counts in each bin while the smooth KDE curve reveals the underlying probability density, making it easier to perceive the true shape of the distribution without binning artifacts.
""" anyplot.ai
histogram-kde: Histogram with KDE Overlay
Library: altair 6.2.2 | Python 3.13.14
Quality: 88/100 | Updated: 2026-08-05
"""

import os

import altair as alt
import numpy as np
import pandas as pd
from PIL import Image
from scipy.stats import gaussian_kde


# Theme-adaptive tokens
THEME = os.getenv("ANYPLOT_THEME", "light")
PAGE_BG = "#FAF8F1" if THEME == "light" else "#1A1A17"
ELEVATED_BG = "#FFFDF6" if THEME == "light" else "#242420"
INK = "#1A1A17" if THEME == "light" else "#F0EFE8"
INK_SOFT = "#4A4A44" if THEME == "light" else "#B8B7B0"

# Imprint palette
BRAND = "#009E73"  # Position 1 - first series
ACCENT = "#C475FD"  # Position 2 - for KDE line

# Data - bimodal distribution for interesting KDE demonstration, clipped to the
# conventional 0-100 test-score range
np.random.seed(42)
values = np.concatenate([np.random.normal(loc=45, scale=8, size=300), np.random.normal(loc=72, scale=10, size=200)])
values = np.clip(values, 0, 100)

# Calculate histogram bins for density
hist, bin_edges = np.histogram(values, bins=30, density=True)
hist_df = pd.DataFrame(
    {
        "bin_start": bin_edges[:-1],
        "bin_end": bin_edges[1:],
        "density": hist,
        "base": 0.0,
        "bin_label": [f"{s:.1f}–{e:.1f}" for s, e in zip(bin_edges[:-1], bin_edges[1:], strict=True)],
    }
)

# Calculate KDE
kde = gaussian_kde(values, bw_method="scott")
x_kde = np.linspace(values.min() - 5, values.max() + 5, 200)
y_kde = kde(x_kde)
kde_df = pd.DataFrame({"x": x_kde, "density": y_kde})

# Histogram bars using Imprint brand color, softly rounded for a less blocky feel
histogram = (
    alt.Chart(hist_df)
    .mark_bar(opacity=0.6, color=BRAND, cornerRadiusTopLeft=2, cornerRadiusTopRight=2)
    .encode(
        x=alt.X("bin_start:Q", title="Test Score", scale=alt.Scale(zero=False)),
        x2="bin_end:Q",
        y=alt.Y("density:Q", title="Density"),
        y2="base:Q",
        tooltip=[
            alt.Tooltip("bin_label:N", title="Score range"),
            alt.Tooltip("density:Q", title="Density", format=".4f"),
        ],
    )
)

# KDE line using Imprint position 2, monotone interpolation for a smoother contrast to the discrete bars
kde_line = (
    alt.Chart(kde_df)
    .mark_line(color=ACCENT, strokeWidth=4, interpolate="monotone")
    .encode(
        x=alt.X("x:Q"),
        y=alt.Y("density:Q"),
        tooltip=[
            alt.Tooltip("x:Q", title="Test Score", format=".1f"),
            alt.Tooltip("density:Q", title="KDE density", format=".4f"),
        ],
    )
)

# Combine and configure with theme-adaptive styling
# Inner view sized small (Canvas table) so vl-convert's title/axis padding still
# lands the saved PNG within the 3200x1800 landscape target.
chart = (
    (histogram + kde_line)
    .properties(
        width=620, height=320, background=PAGE_BG, title=alt.Title("histogram-kde · altair · anyplot.ai", fontSize=28)
    )
    .configure_axis(
        domainColor=INK_SOFT,
        tickColor=INK_SOFT,
        gridColor=INK,
        gridOpacity=0.10,
        labelFontSize=18,
        labelColor=INK_SOFT,
        titleFontSize=22,
        titleColor=INK,
    )
    .configure_view(strokeWidth=0, fill=PAGE_BG)
    .configure_title(color=INK)
)

# Save PNG and HTML with theme suffix
chart.save(f"plot-{THEME}.png", scale_factor=4.0)
chart.save(f"plot-{THEME}.html")

# Pad the saved PNG up to the exact canonical target (3200x1800). Never crop —
# cropping would clip title/axis-label content at the edges.
TW, TH = 3200, 1800
_img = Image.open(f"plot-{THEME}.png").convert("RGB")
_w, _h = _img.size
if _w > TW or _h > TH:
    raise SystemExit(
        f"altair vl-convert produced {_w}x{_h}, exceeds target {TW}x{TH}. "
        f"Shrink chart .properties(width=, height=) values and re-render."
    )
if _w < TW or _h < TH:
    _canvas = Image.new("RGB", (TW, TH), PAGE_BG)
    _canvas.paste(_img, ((TW - _w) // 2, (TH - _h) // 2))
    _canvas.save(f"plot-{THEME}.png")
Runnable source as JSON, for any HTTP client: https://api.anyplot.ai/specs/histogram-kde/altair/code. Any spec id and library id listed in llms-full.txt fit the same URL shape; every URL below is complete and callable.
{
  "spec_id": "histogram-kde",
  "language": "python",
  "library": "altair",
  "page": "https://anyplot.ai/histogram-kde/python/altair",
  "hub": "https://anyplot.ai/histogram-kde",
  "code_json": "https://api.anyplot.ai/specs/histogram-kde/altair/code",
  "spec_json": "https://api.anyplot.ai/specs/histogram-kde",
  "render_light_png": "https://storage.googleapis.com/anyplot-images/plots/histogram-kde/python/altair/plot-light.png",
  "render_dark_png": "https://storage.googleapis.com/anyplot-images/plots/histogram-kde/python/altair/plot-dark.png",
  "interactive_light_html": "https://storage.googleapis.com/anyplot-images/plots/histogram-kde/python/altair/plot-light.html",
  "interactive_dark_html": "https://storage.googleapis.com/anyplot-images/plots/histogram-kde/python/altair/plot-dark.html",
  "quality_score": 88.0,
  "license": "MIT",
  "guide": "https://anyplot.ai/llms.txt"
}
Part of Histogram with KDE Overlay on anyplot.ai.