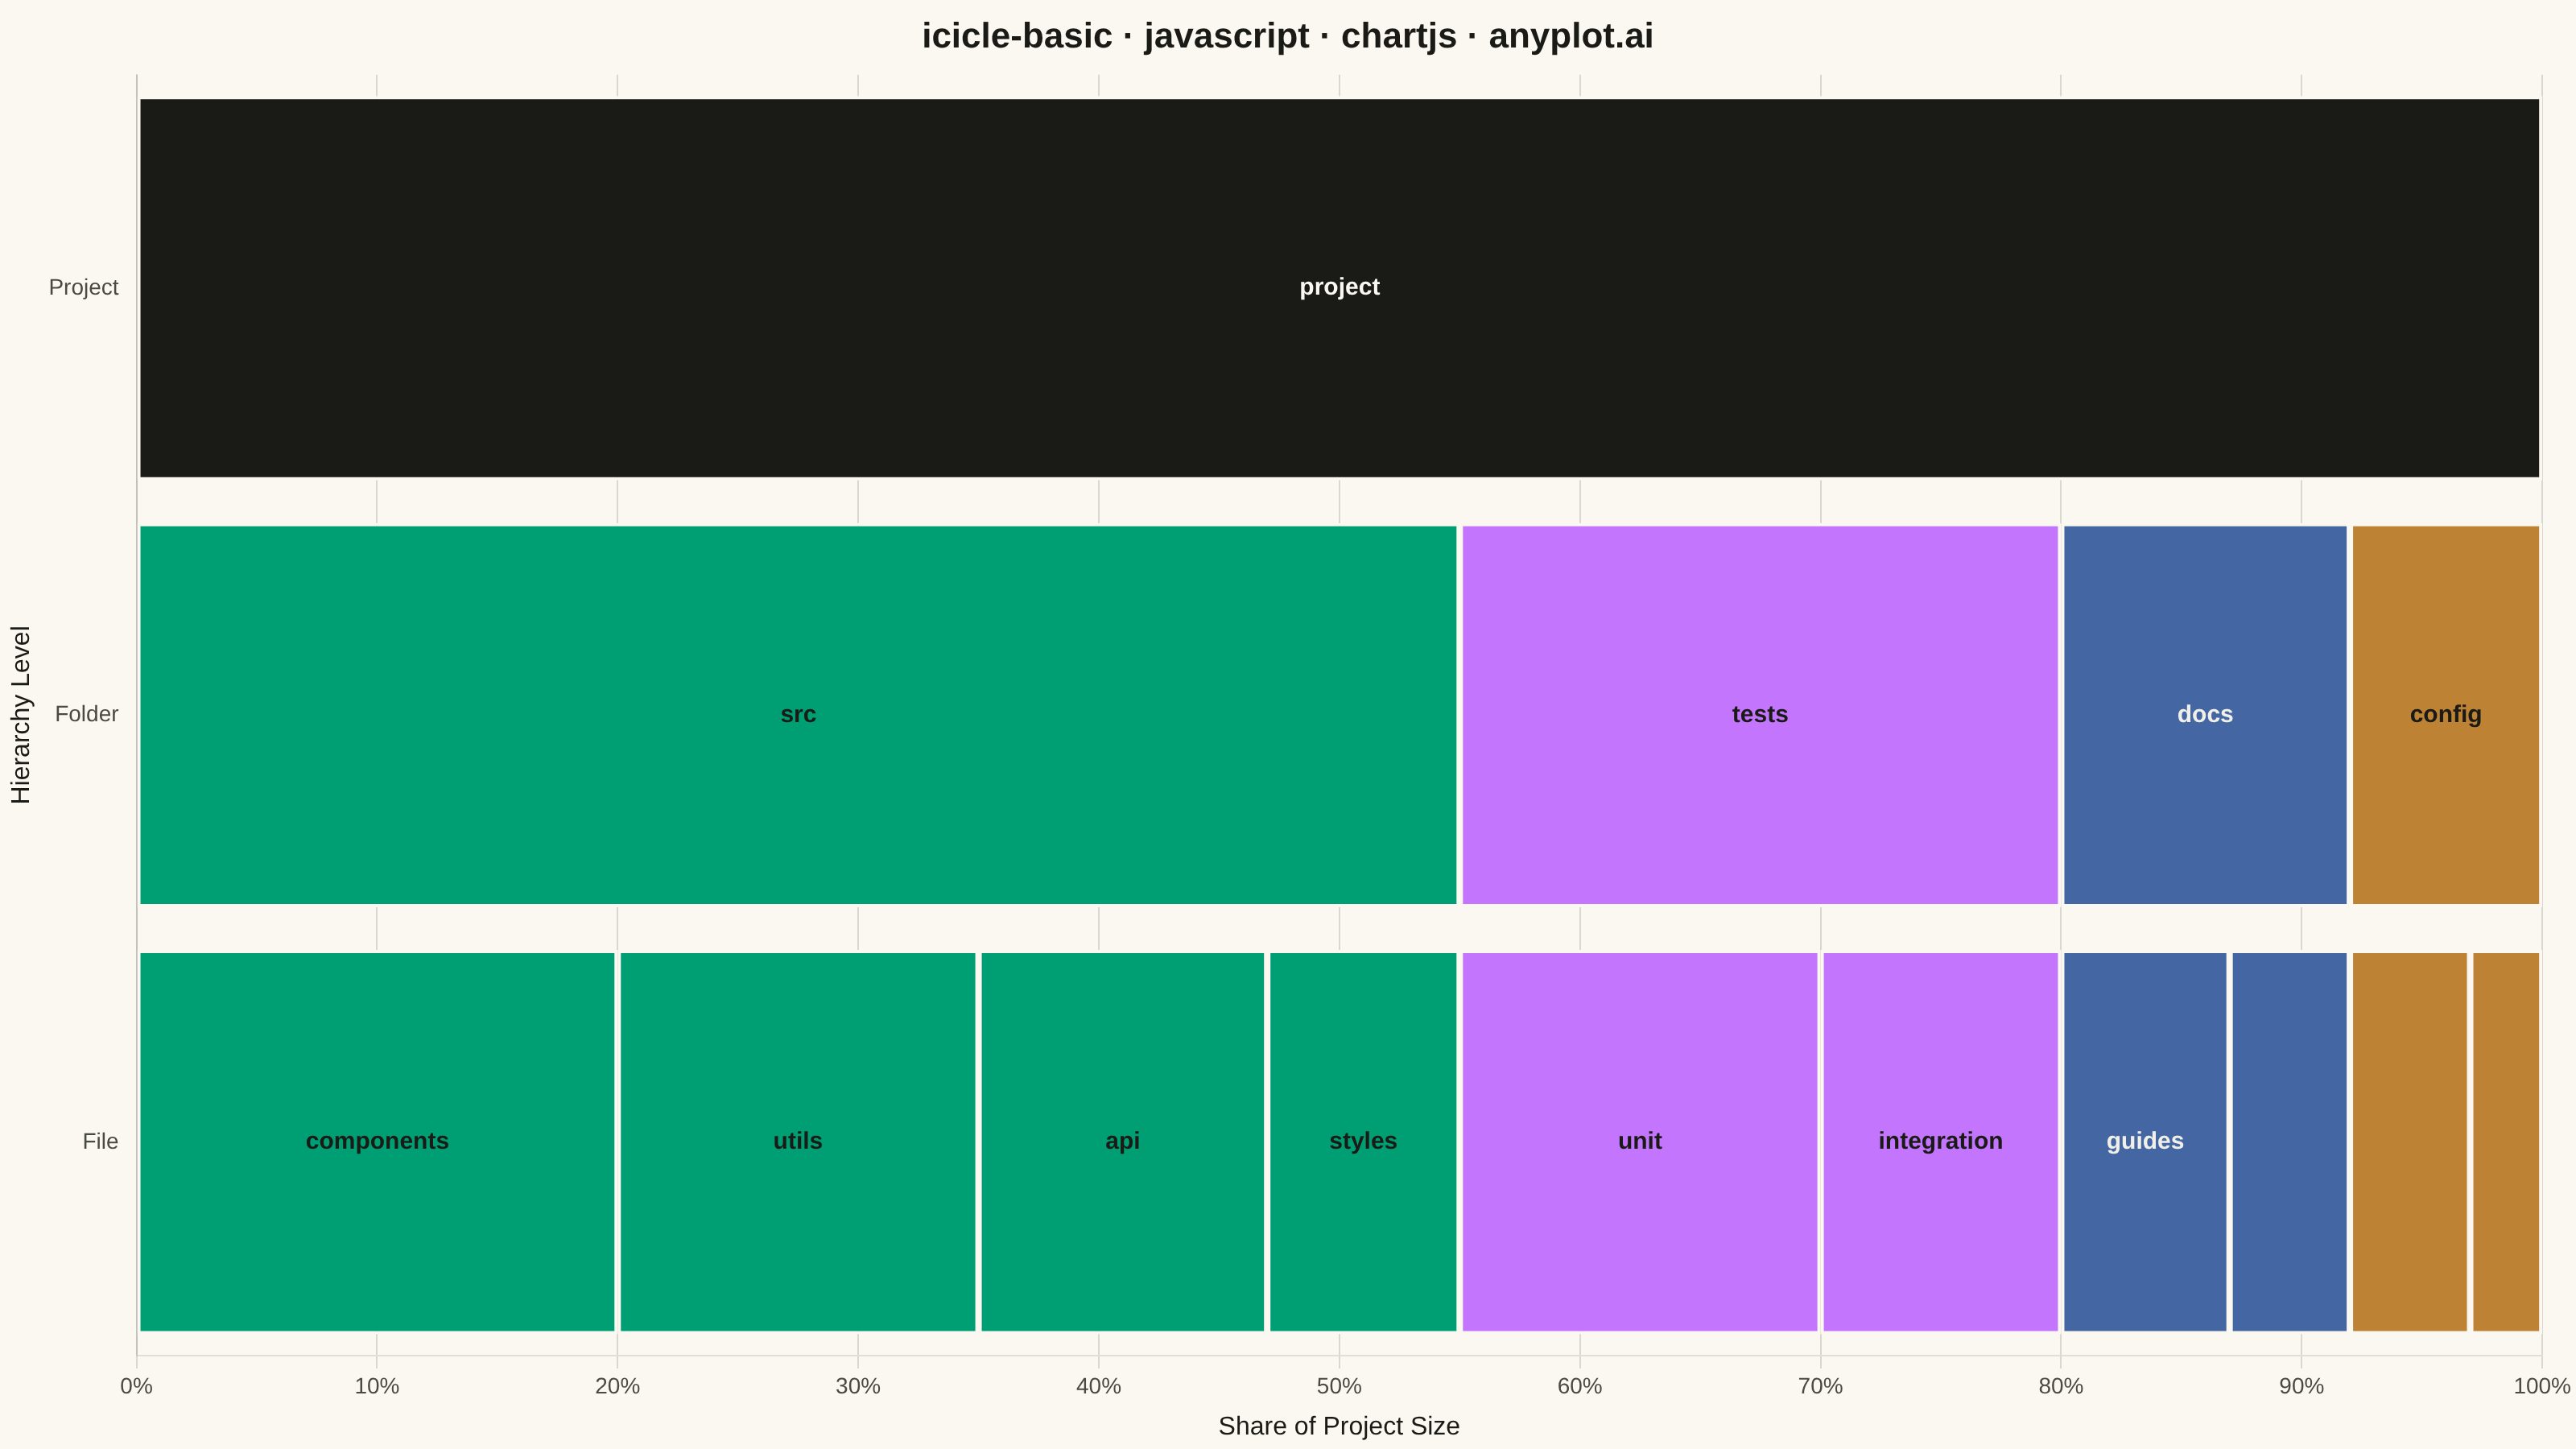
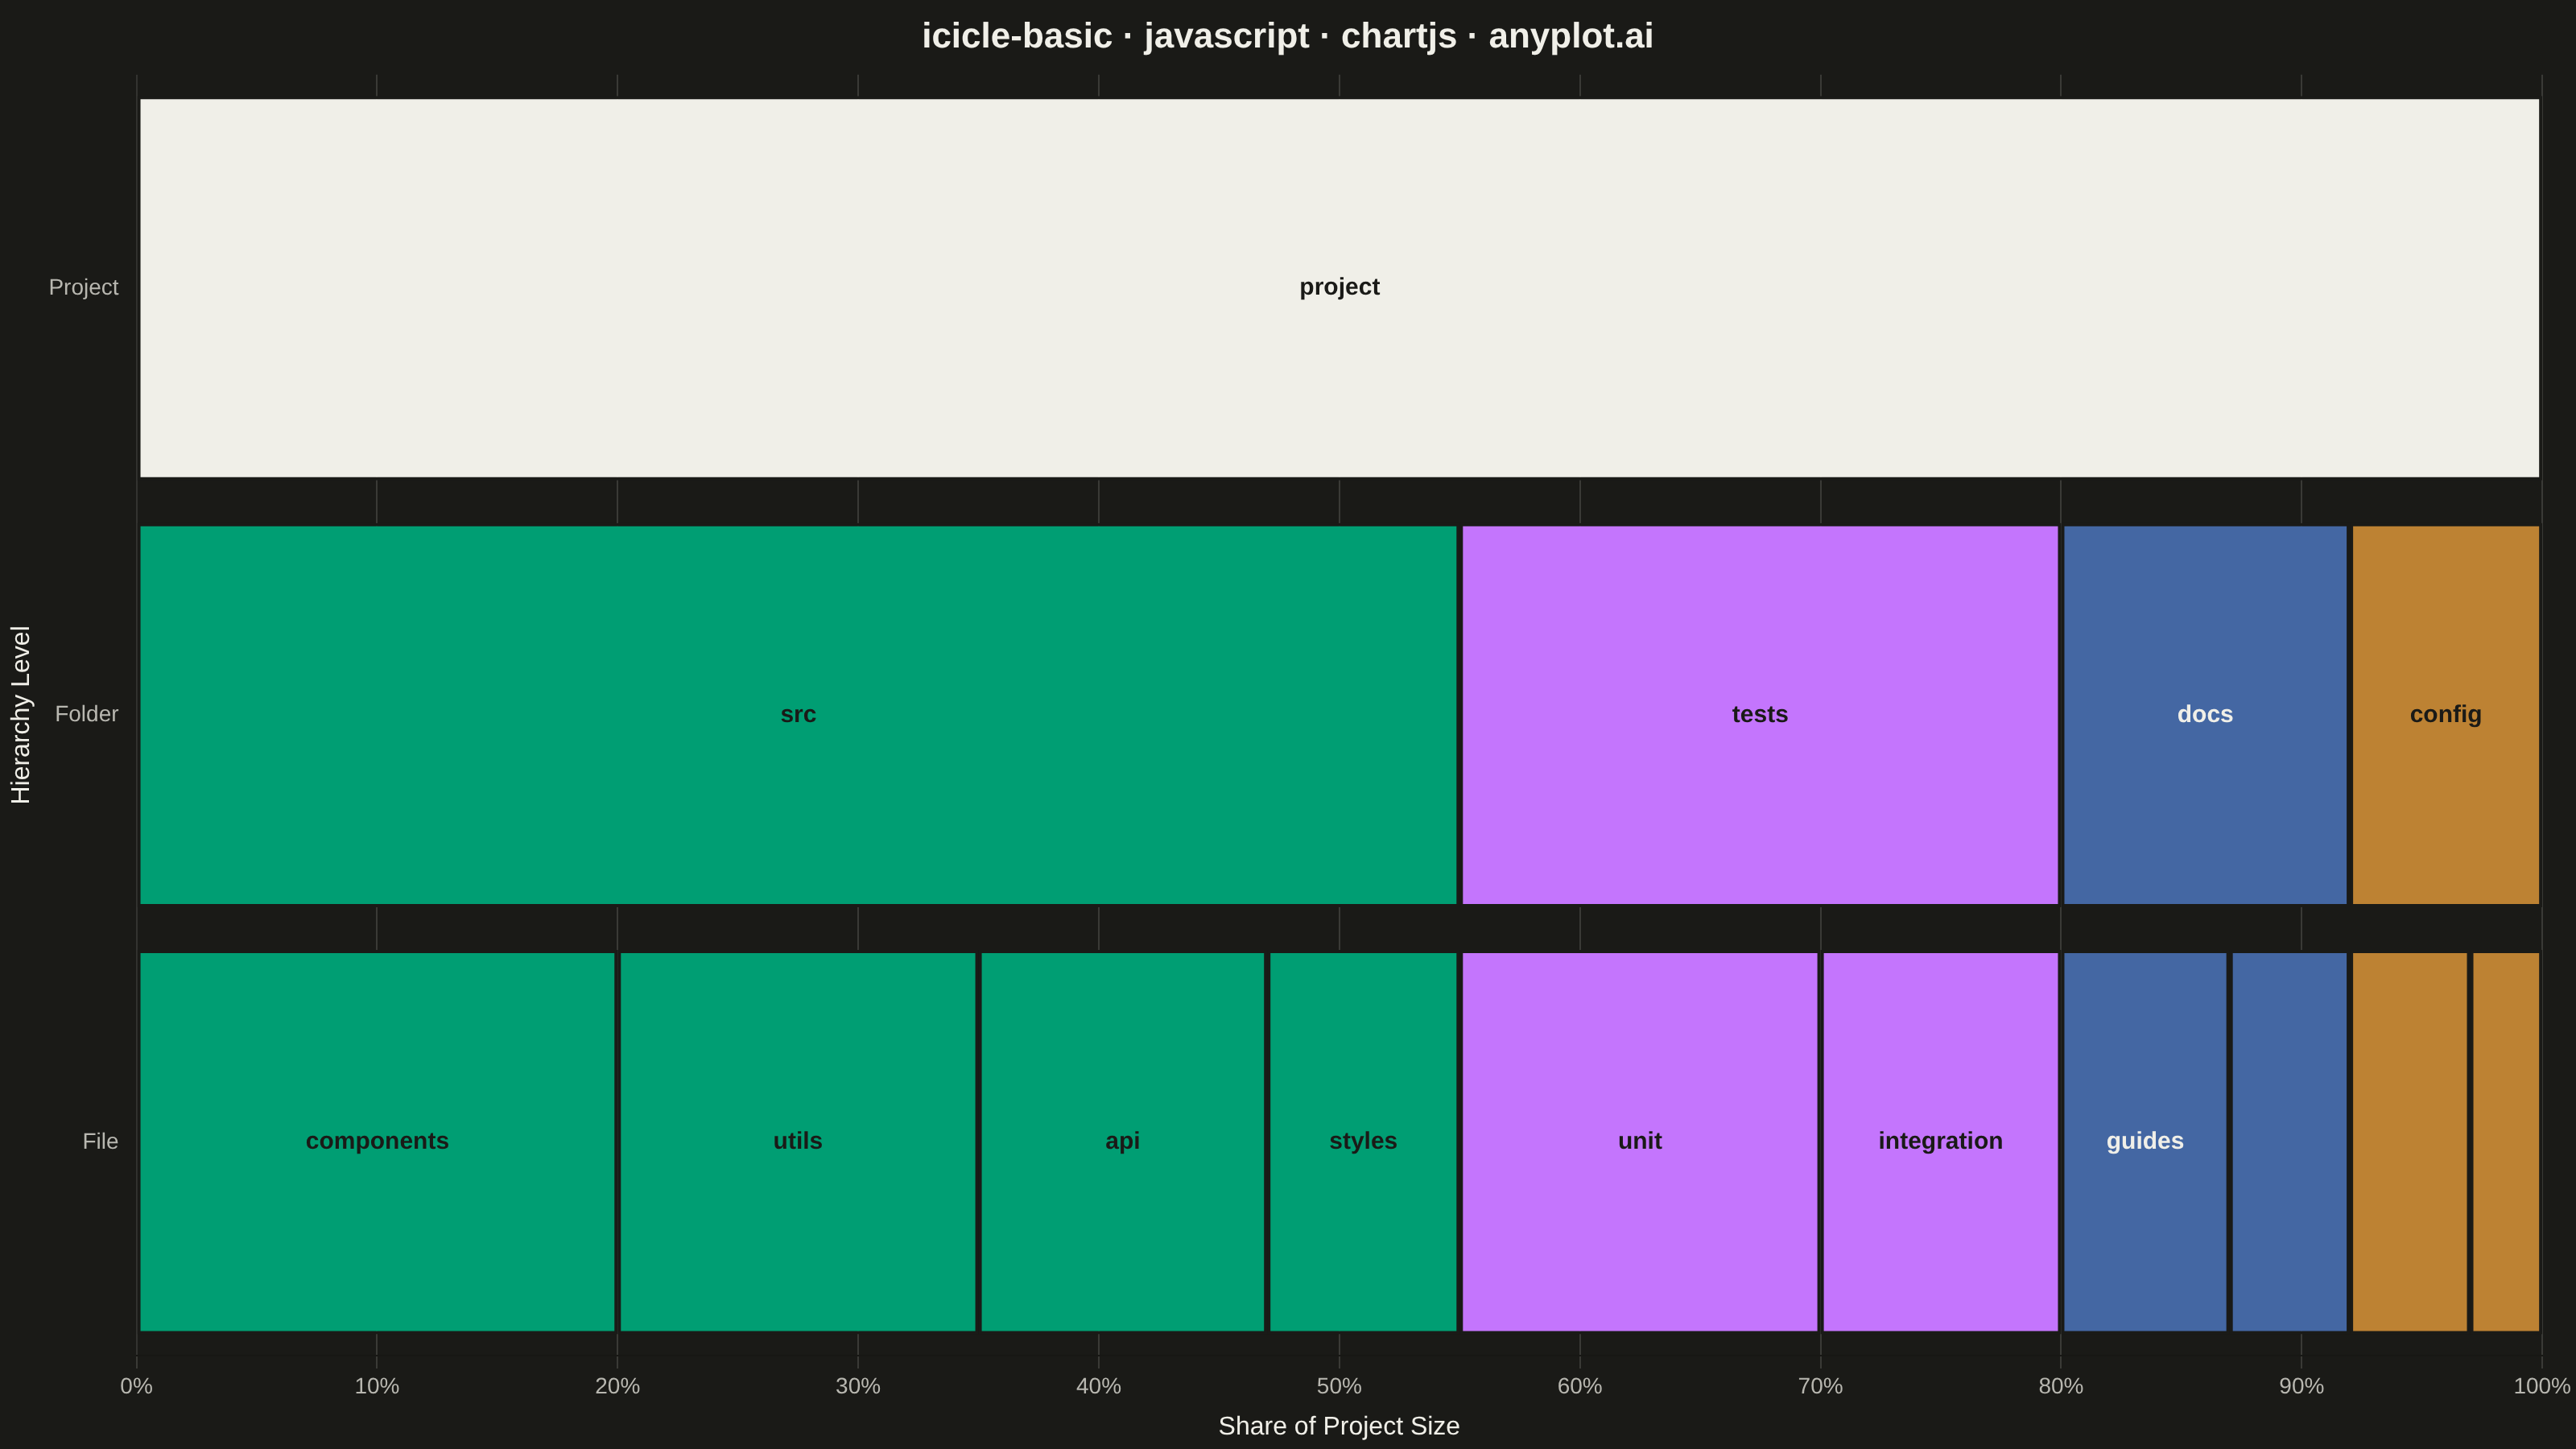
An icicle chart displaying hierarchical data as adjacent rectangles in a layered structure, where each rectangle's size represents its value in the hierarchy. Unlike treemaps that nest rectangles, icicle charts stack them in rows (horizontal) or columns (vertical), making parent-child relationships explicitly visible through spatial adjacency. This layout excels at showing both the hierarchy levels and the proportional values simultaneously.
Preview render from the Chart.js implementation.