The same plot in 14 other libraries — JavaScript: Chart.js, D3.js, Apache ECharts, MUI X Charts; Python: Altair, Bokeh, lets-plot, Matplotlib, Plotly, plotnine, Pygal, Seaborn; R: ggplot2; Julia: Makie.jl. Compare all 15 side by side: Basic Icicle Chart in Python, R, Julia and JavaScript.
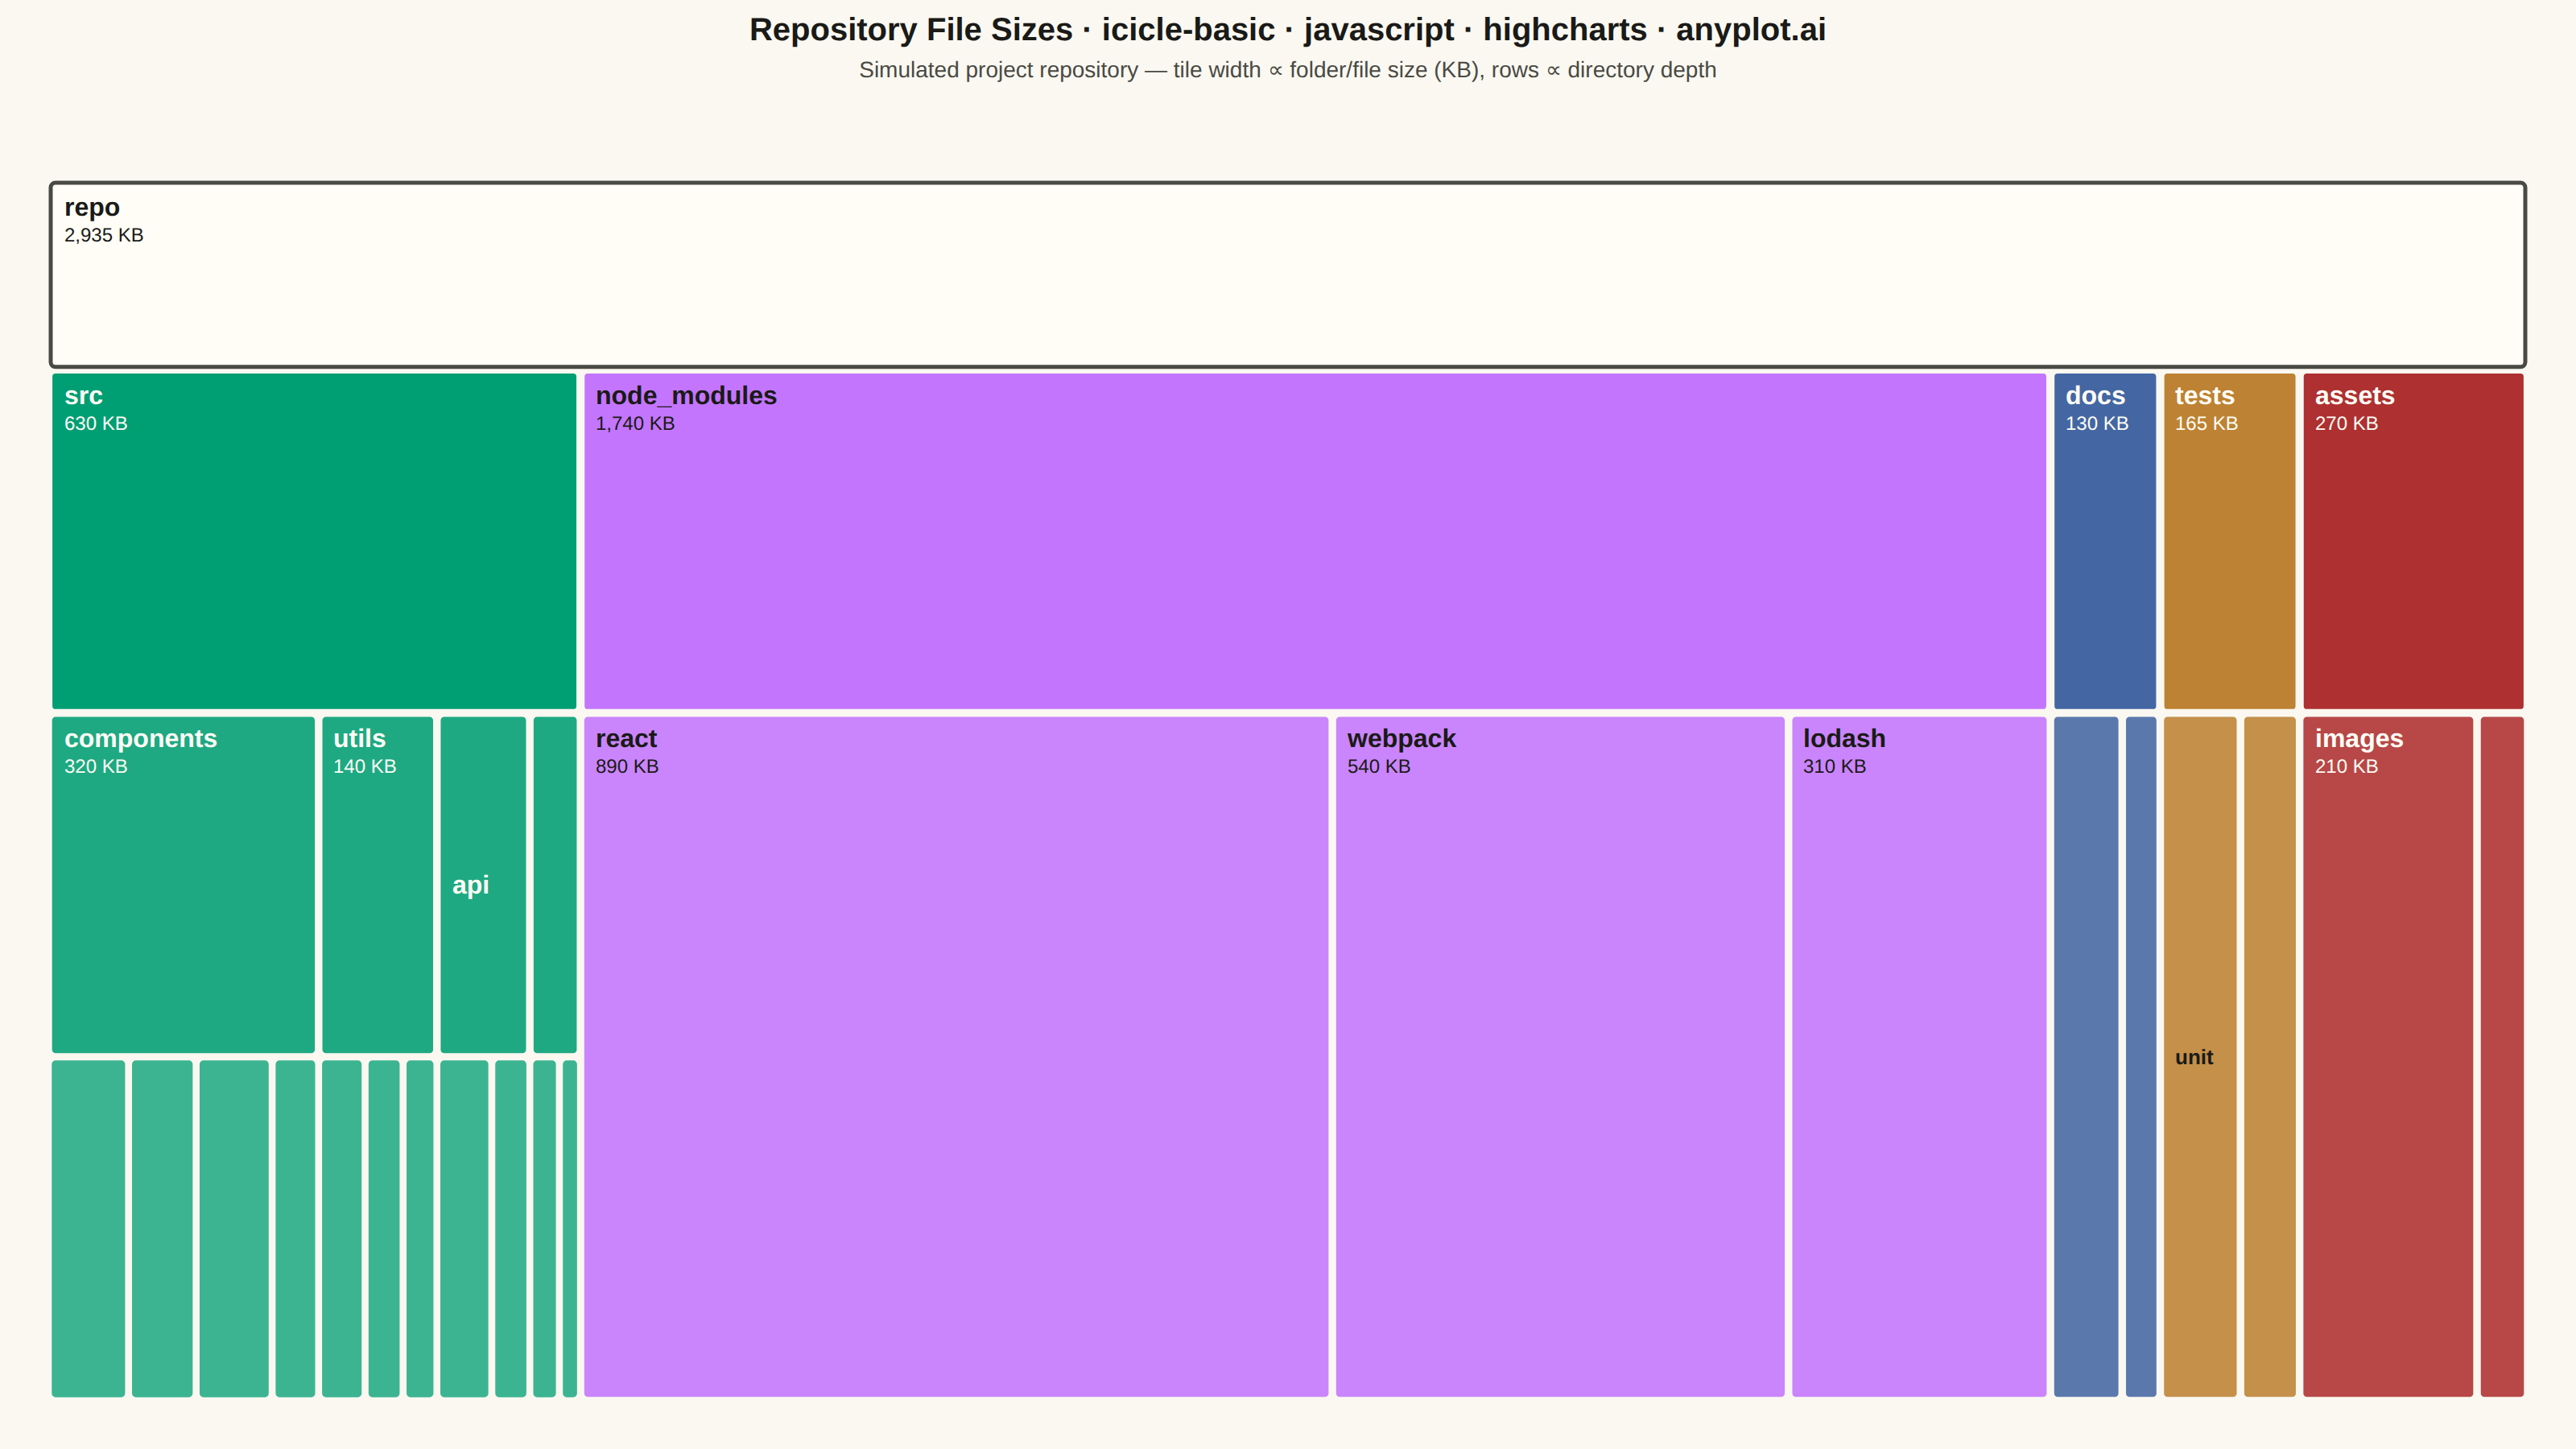
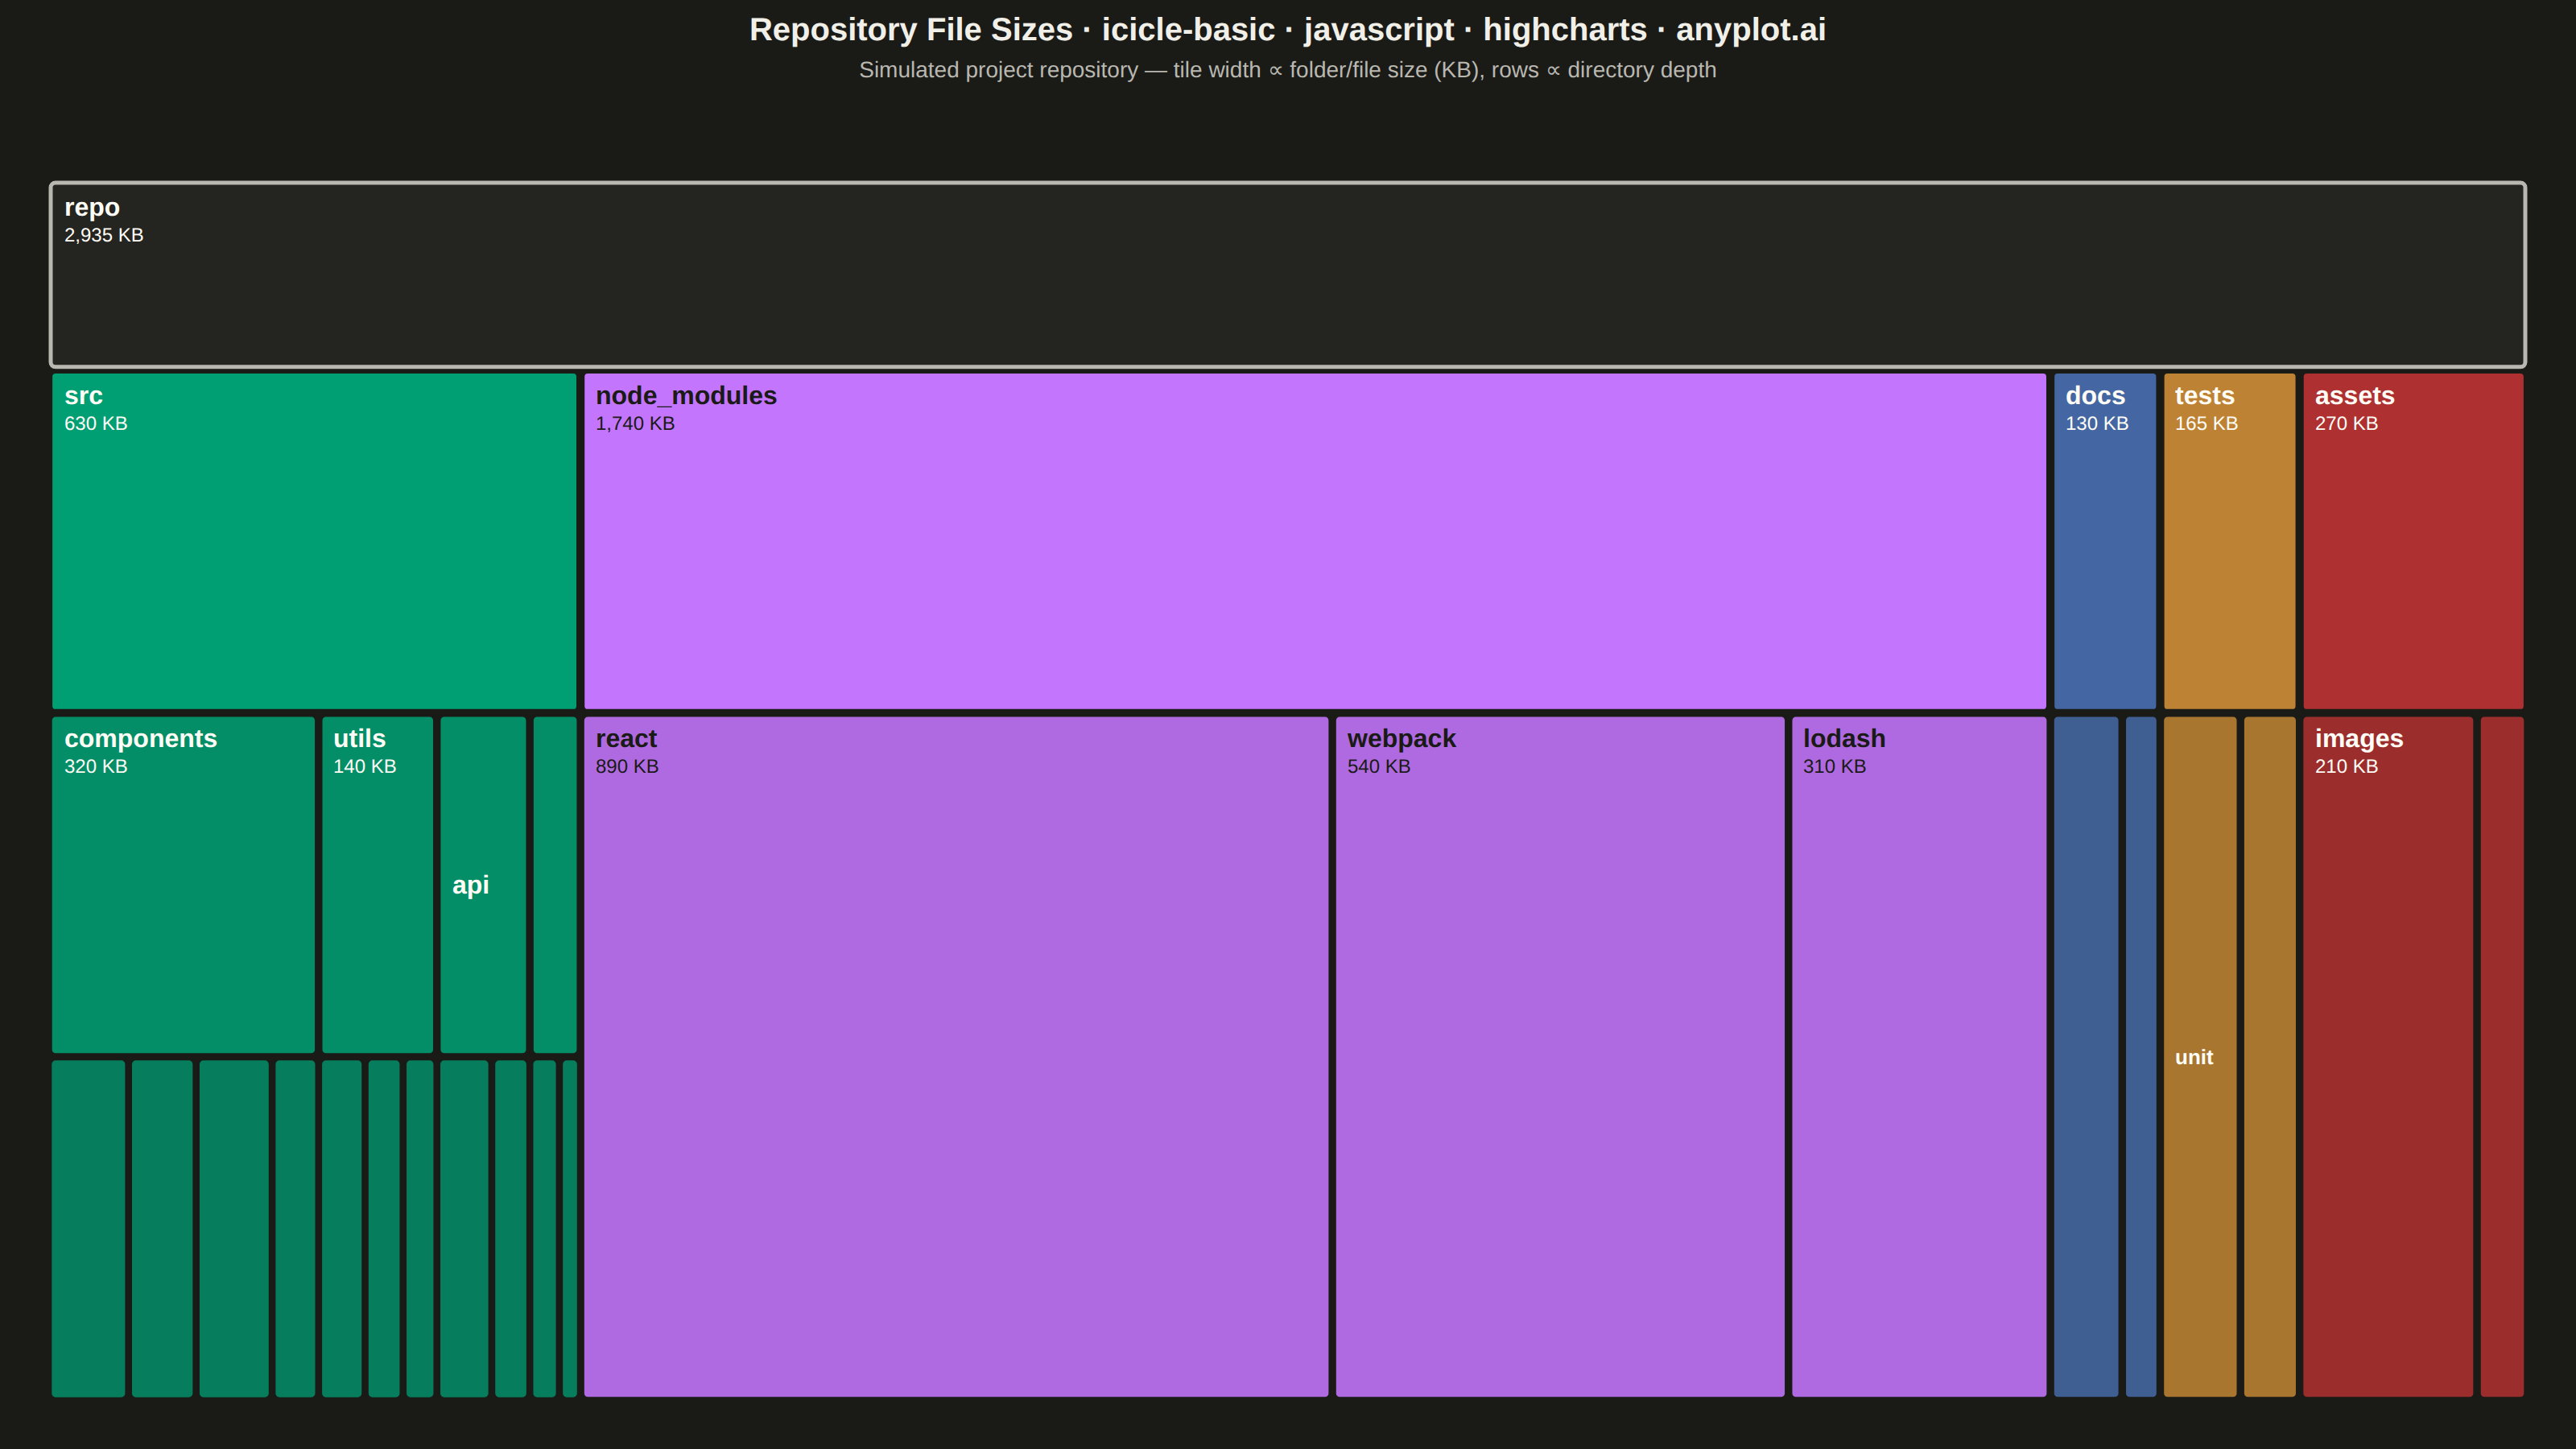
An icicle chart displaying hierarchical data as adjacent rectangles in a layered structure, where each rectangle's size represents its value in the hierarchy. Unlike treemaps that nest rectangles, icicle charts stack them in rows (horizontal) or columns (vertical), making parent-child relationships explicitly visible through spatial adjacency. This layout excels at showing both the hierarchy levels and the proportional values simultaneously.
// anyplot.ai
// icicle-basic: Basic Icicle Chart
// Library: highcharts 12.6.0 | JavaScript 22.23.2
// Quality: 87/100 | Created: 2026-09-05

//# anyplot-orientation: landscape

// Only the core Highcharts bundle is loaded (no `treemap`/`icicle` module — the
// icicle series is itself built on top of the treemap module, neither of which
// ships here), so the layered rectangles are computed with a partition layout
// (root spans the full width; each child's width is its value's share of the
// parent's width; a childless node stretches down to the last row so no gaps
// appear) and drawn by hand with `chart.renderer.rect()` — the same hand-drawn
// technique treemap-basic / sunburst-basic / sankey-basic use for series types
// the core bundle doesn't ship. Hover uses a native SVG `<title>` per
// rectangle, covering the whole tile.

const t = window.ANYPLOT_TOKENS;

// --- Data: repository file-system breakdown (KB) — name/parent/value --------
const RECORDS = [
  { name: "repo", parent: null },
  { name: "src", parent: "repo" },
  { name: "node_modules", parent: "repo" },
  { name: "docs", parent: "repo" },
  { name: "tests", parent: "repo" },
  { name: "assets", parent: "repo" },
  { name: "components", parent: "src" },
  { name: "utils", parent: "src" },
  { name: "api", parent: "src" },
  { name: "styles", parent: "src" },
  { name: "react", parent: "node_modules", value: 890 },
  { name: "webpack", parent: "node_modules", value: 540 },
  { name: "lodash", parent: "node_modules", value: 310 },
  { name: "guides", parent: "docs", value: 85 },
  { name: "api-reference", parent: "docs", value: 45 },
  { name: "unit", parent: "tests", value: 95 },
  { name: "integration", parent: "tests", value: 70 },
  { name: "images", parent: "assets", value: 210 },
  { name: "fonts", parent: "assets", value: 60 },
  { name: "Button.jsx", parent: "components", value: 95 },
  { name: "Modal.jsx", parent: "components", value: 80 },
  { name: "Chart.jsx", parent: "components", value: 90 },
  { name: "Table.jsx", parent: "components", value: 55 },
  { name: "format.js", parent: "utils", value: 55 },
  { name: "validate.js", parent: "utils", value: 45 },
  { name: "api-client.js", parent: "utils", value: 40 },
  { name: "routes.js", parent: "api", value: 65 },
  { name: "middleware.js", parent: "api", value: 45 },
  { name: "theme.css", parent: "styles", value: 35 },
  { name: "globals.css", parent: "styles", value: 25 },
];

// --- Build tree + bottom-up value rollup ------------------------------------
const nodesByName = new Map(RECORDS.map((r) => [r.name, { ...r, children: [] }]));
nodesByName.forEach((node) => {
  if (node.parent && nodesByName.has(node.parent)) {
    nodesByName.get(node.parent).children.push(node);
  }
});
function rollUp(node) {
  if (node.children.length) {
    node.value = node.children.reduce((s, c) => s + rollUp(c), 0);
  }
  return node.value;
}
const ROOT = nodesByName.get("repo");
rollUp(ROOT);

// --- Color + text helpers ----------------------------------------------------
function hexToRgb(hex) {
  const c = parseInt(hex.slice(1), 16);
  return [(c >> 16) & 255, (c >> 8) & 255, c & 255];
}
function mix(hexA, hexB, f) {
  const [r1, g1, b1] = hexToRgb(hexA);
  const [r2, g2, b2] = hexToRgb(hexB);
  const r = Math.round(r1 + (r2 - r1) * f);
  const g = Math.round(g1 + (g2 - g1) * f);
  const b = Math.round(b1 + (b2 - b1) * f);
  return `#${[r, g, b].map((v) => v.toString(16).padStart(2, "0")).join("")}`;
}
function luma(hex) {
  const [r, g, b] = hexToRgb(hex);
  return (0.299 * r + 0.587 * g + 0.114 * b) / 255;
}
const labelColorFor = (bgHex) => (luma(bgHex) > 0.55 ? "#1A1A17" : "#FFFDF6");
const kb = (v) => `${v.toLocaleString("en-US")} KB`;

// Shrink-to-fit: largest fontSize in [min, nominal] whose estimated text width
// fits maxWidth, or null if even `min` overflows — callers omit the label then.
function fitFontSize(text, maxWidth, nominal, min) {
  for (let size = nominal; size >= min; size--) {
    if (text.length * size * 0.56 + 6 <= maxWidth) return size;
  }
  return null;
}

function ancestorsOf(node) {
  const chain = [node];
  let cur = node;
  while (cur.parent && nodesByName.has(cur.parent)) {
    cur = nodesByName.get(cur.parent);
    chain.push(cur);
  }
  return chain;
}

// --- Title (fontsize scaled off the 67-char baseline) -----------------------
const TITLE_TEXT = "Repository File Sizes · icicle-basic · javascript · highcharts · anyplot.ai";
const TITLE_FS = Math.max(Math.round(22 * Math.min(1, 67 / TITLE_TEXT.length)), 14);

// --- Chart shell (no series/axes — the icicle is drawn by hand) ------------
const chart = Highcharts.chart("container", {
  chart: {
    backgroundColor: "transparent",
    animation: false,
    style: { fontFamily: "inherit" },
    marginTop: 112,
    marginBottom: 30,
    marginLeft: 30,
    marginRight: 30,
  },
  credits: { enabled: false },
  title: {
    text: TITLE_TEXT,
    style: { color: t.ink, fontSize: TITLE_FS + "px", fontWeight: "600" },
  },
  subtitle: {
    text: "Simulated project repository — tile width ∝ folder/file size (KB), rows ∝ directory depth",
    style: { color: t.inkSoft, fontSize: "14px" },
  },
  xAxis: { visible: false },
  yAxis: { visible: false },
  legend: { enabled: false },
  plotOptions: { series: { animation: false } },
  series: [],
});

const PLOT_W = chart.plotWidth;
const PLOT_H = chart.plotHeight;
const GAP = 3;

// --- Partition layout (values -> layered rectangles) ------------------------
// Root spans the full row; each child's width is its value's share of the
// parent's width. A node without children stretches down to the last row
// (classic icicle behaviour) instead of leaving blank space beneath it.
const DEPTH_COUNT = (() => {
  let max = 0;
  (function walk(node, depth) {
    max = Math.max(max, depth);
    node.children.forEach((c) => walk(c, depth + 1));
  })(ROOT, 0);
  return max + 1;
})();
// The root row only ever shows a single label, so giving it a full 1/DEPTH_COUNT
// share leaves a near-empty band at the top. Shrink it to ~55% of a normal row
// and redistribute the freed height across the deeper, information-dense rows.
const ROW_WEIGHTS = Array.from({ length: DEPTH_COUNT }, (_, d) => (d === 0 ? 0.55 : 1));
const ROW_UNIT = PLOT_H / ROW_WEIGHTS.reduce((a, b) => a + b, 0);
const ROW_Y = [0];
ROW_WEIGHTS.forEach((w) => ROW_Y.push(ROW_Y[ROW_Y.length - 1] + w * ROW_UNIT));

const TILES = [];
(function partition(node, x0, x1, depth, branchColor) {
  const y0 = ROW_Y[depth];
  const y1 = node.children.length ? ROW_Y[depth + 1] : PLOT_H;
  TILES.push({ node, x0, x1, y0, y1, depth, color: branchColor });
  if (node.children.length) {
    let cx = x0;
    node.children.forEach((child, i) => {
      const w = (x1 - x0) * (child.value / node.value);
      // Depth 1 (top-level folders) pick the next Imprint hue — abstract
      // categories, canonical order. Deeper descendants inherit their
      // branch's hue and get progressively tinted toward the page background.
      const childColor = depth === 0 ? t.palette[i % t.palette.length] : branchColor;
      partition(child, cx, cx + w, depth + 1, childColor);
      cx += w;
    });
  }
})(ROOT, 0, PLOT_W, 0, null);

// --- Draw ---------------------------------------------------------------
const g = chart.renderer.g("icicle").add();
// name -> { rect, fill, stroke, strokeWidth } — lets hover highlight the
// hovered tile and brighten its full ancestry chain back to the root.
const nodeElements = new Map();

function addTooltip(el, text) {
  const titleEl = document.createElementNS("http://www.w3.org/2000/svg", "title");
  titleEl.textContent = text;
  el.element.appendChild(titleEl);
}

TILES.forEach(({ node, x0, x1, y0, y1, depth, color }) => {
  const bx = chart.plotLeft + x0 + GAP / 2;
  const by = chart.plotTop + y0 + GAP / 2;
  const bw = Math.max(x1 - x0 - GAP, 0);
  const bh = Math.max(y1 - y0 - GAP, 0);
  if (bw <= 0 || bh <= 0) return;

  const isRoot = depth === 0;
  const fill = isRoot ? t.elevatedBg : mix(color, t.pageBg, Math.min(0.12 * (depth - 1), 0.45));
  const stroke = isRoot ? t.inkSoft : t.pageBg;
  // Depth-graded stroke weight (root heaviest, leaves lightest) instead of a
  // uniform 2px everywhere, plus a subtle corner radius for polish.
  const strokeWidth = Math.max(2.5 - depth * 0.4, 1.2);
  const pct = ((node.value / ROOT.value) * 100).toFixed(1);
  const path = (function ancestry(n) {
    return n.parent ? `${ancestry(nodesByName.get(n.parent))} → ${n.name}` : n.name;
  })(node);

  const rect = chart.renderer
    .rect(bx, by, bw, bh, 3)
    .attr({
      fill,
      stroke,
      "stroke-width": strokeWidth,
      zIndex: 2 + depth,
    })
    .add(g);
  addTooltip(rect, `${path}\n${kb(node.value)} (${pct}% of repo)`);
  nodeElements.set(node.name, { rect, fill, stroke, strokeWidth });

  // Highcharts-specific interactivity: hovering a tile brightens it and
  // thickens+recolors the stroke of every ancestor up to the root, tracing
  // the lineage chain — a native mouseover/mouseout touch on top of the
  // hand-drawn rects, most useful in the interactive HTML view.
  const chain = ancestorsOf(node);
  rect.element.addEventListener("mouseenter", () => {
    chain.forEach((n, i) => {
      const entry = nodeElements.get(n.name);
      if (!entry) return;
      entry.rect.attr({
        fill: i === 0 ? mix(entry.fill, "#FFFFFF", 0.15) : entry.fill,
        stroke: t.amber,
        "stroke-width": entry.strokeWidth + (i === 0 ? 1.5 : 1),
      });
    });
  });
  rect.element.addEventListener("mouseleave", () => {
    chain.forEach((n) => {
      const entry = nodeElements.get(n.name);
      if (!entry) return;
      entry.rect.attr({ fill: entry.fill, stroke: entry.stroke, "stroke-width": entry.strokeWidth });
    });
  });

  const label = node.name;
  const nameSize = fitFontSize(label, bw - 10, 16, 11);
  if (nameSize && bh >= 24) {
    const showValue = bh >= 46 && bw >= 56;
    const textColor = labelColorFor(fill);
    chart.renderer
      .text(label, bx + 8, showValue ? by + 20 : by + bh / 2 + nameSize * 0.35)
      .attr({ align: "left", zIndex: 6 + depth })
      .css({ color: textColor, fontSize: `${nameSize}px`, fontWeight: "600", pointerEvents: "none" })
      .add(g);
    if (showValue) {
      chart.renderer
        .text(kb(node.value), bx + 8, by + 20 + 16)
        .attr({ align: "left", zIndex: 6 + depth })
        .css({ color: textColor, fontSize: "12px", pointerEvents: "none" })
        .add(g);
    }
  }
});
Runnable source as JSON, for any HTTP client: https://api.anyplot.ai/specs/icicle-basic/highcharts/code. Any spec id and library id listed in llms-full.txt fit the same URL shape; every URL below is complete and callable.
{
  "spec_id": "icicle-basic",
  "language": "javascript",
  "library": "highcharts",
  "page": "https://anyplot.ai/icicle-basic/javascript/highcharts",
  "hub": "https://anyplot.ai/icicle-basic",
  "code_json": "https://api.anyplot.ai/specs/icicle-basic/highcharts/code",
  "spec_json": "https://api.anyplot.ai/specs/icicle-basic",
  "render_light_png": "https://storage.googleapis.com/anyplot-images/plots/icicle-basic/javascript/highcharts/plot-light.png",
  "render_dark_png": "https://storage.googleapis.com/anyplot-images/plots/icicle-basic/javascript/highcharts/plot-dark.png",
  "interactive_light_html": "https://storage.googleapis.com/anyplot-images/plots/icicle-basic/javascript/highcharts/plot-light.html",
  "interactive_dark_html": "https://storage.googleapis.com/anyplot-images/plots/icicle-basic/javascript/highcharts/plot-dark.html",
  "quality_score": 87.0,
  "license": "MIT",
  "guide": "https://anyplot.ai/llms.txt"
}
Part of Basic Icicle Chart on anyplot.ai.