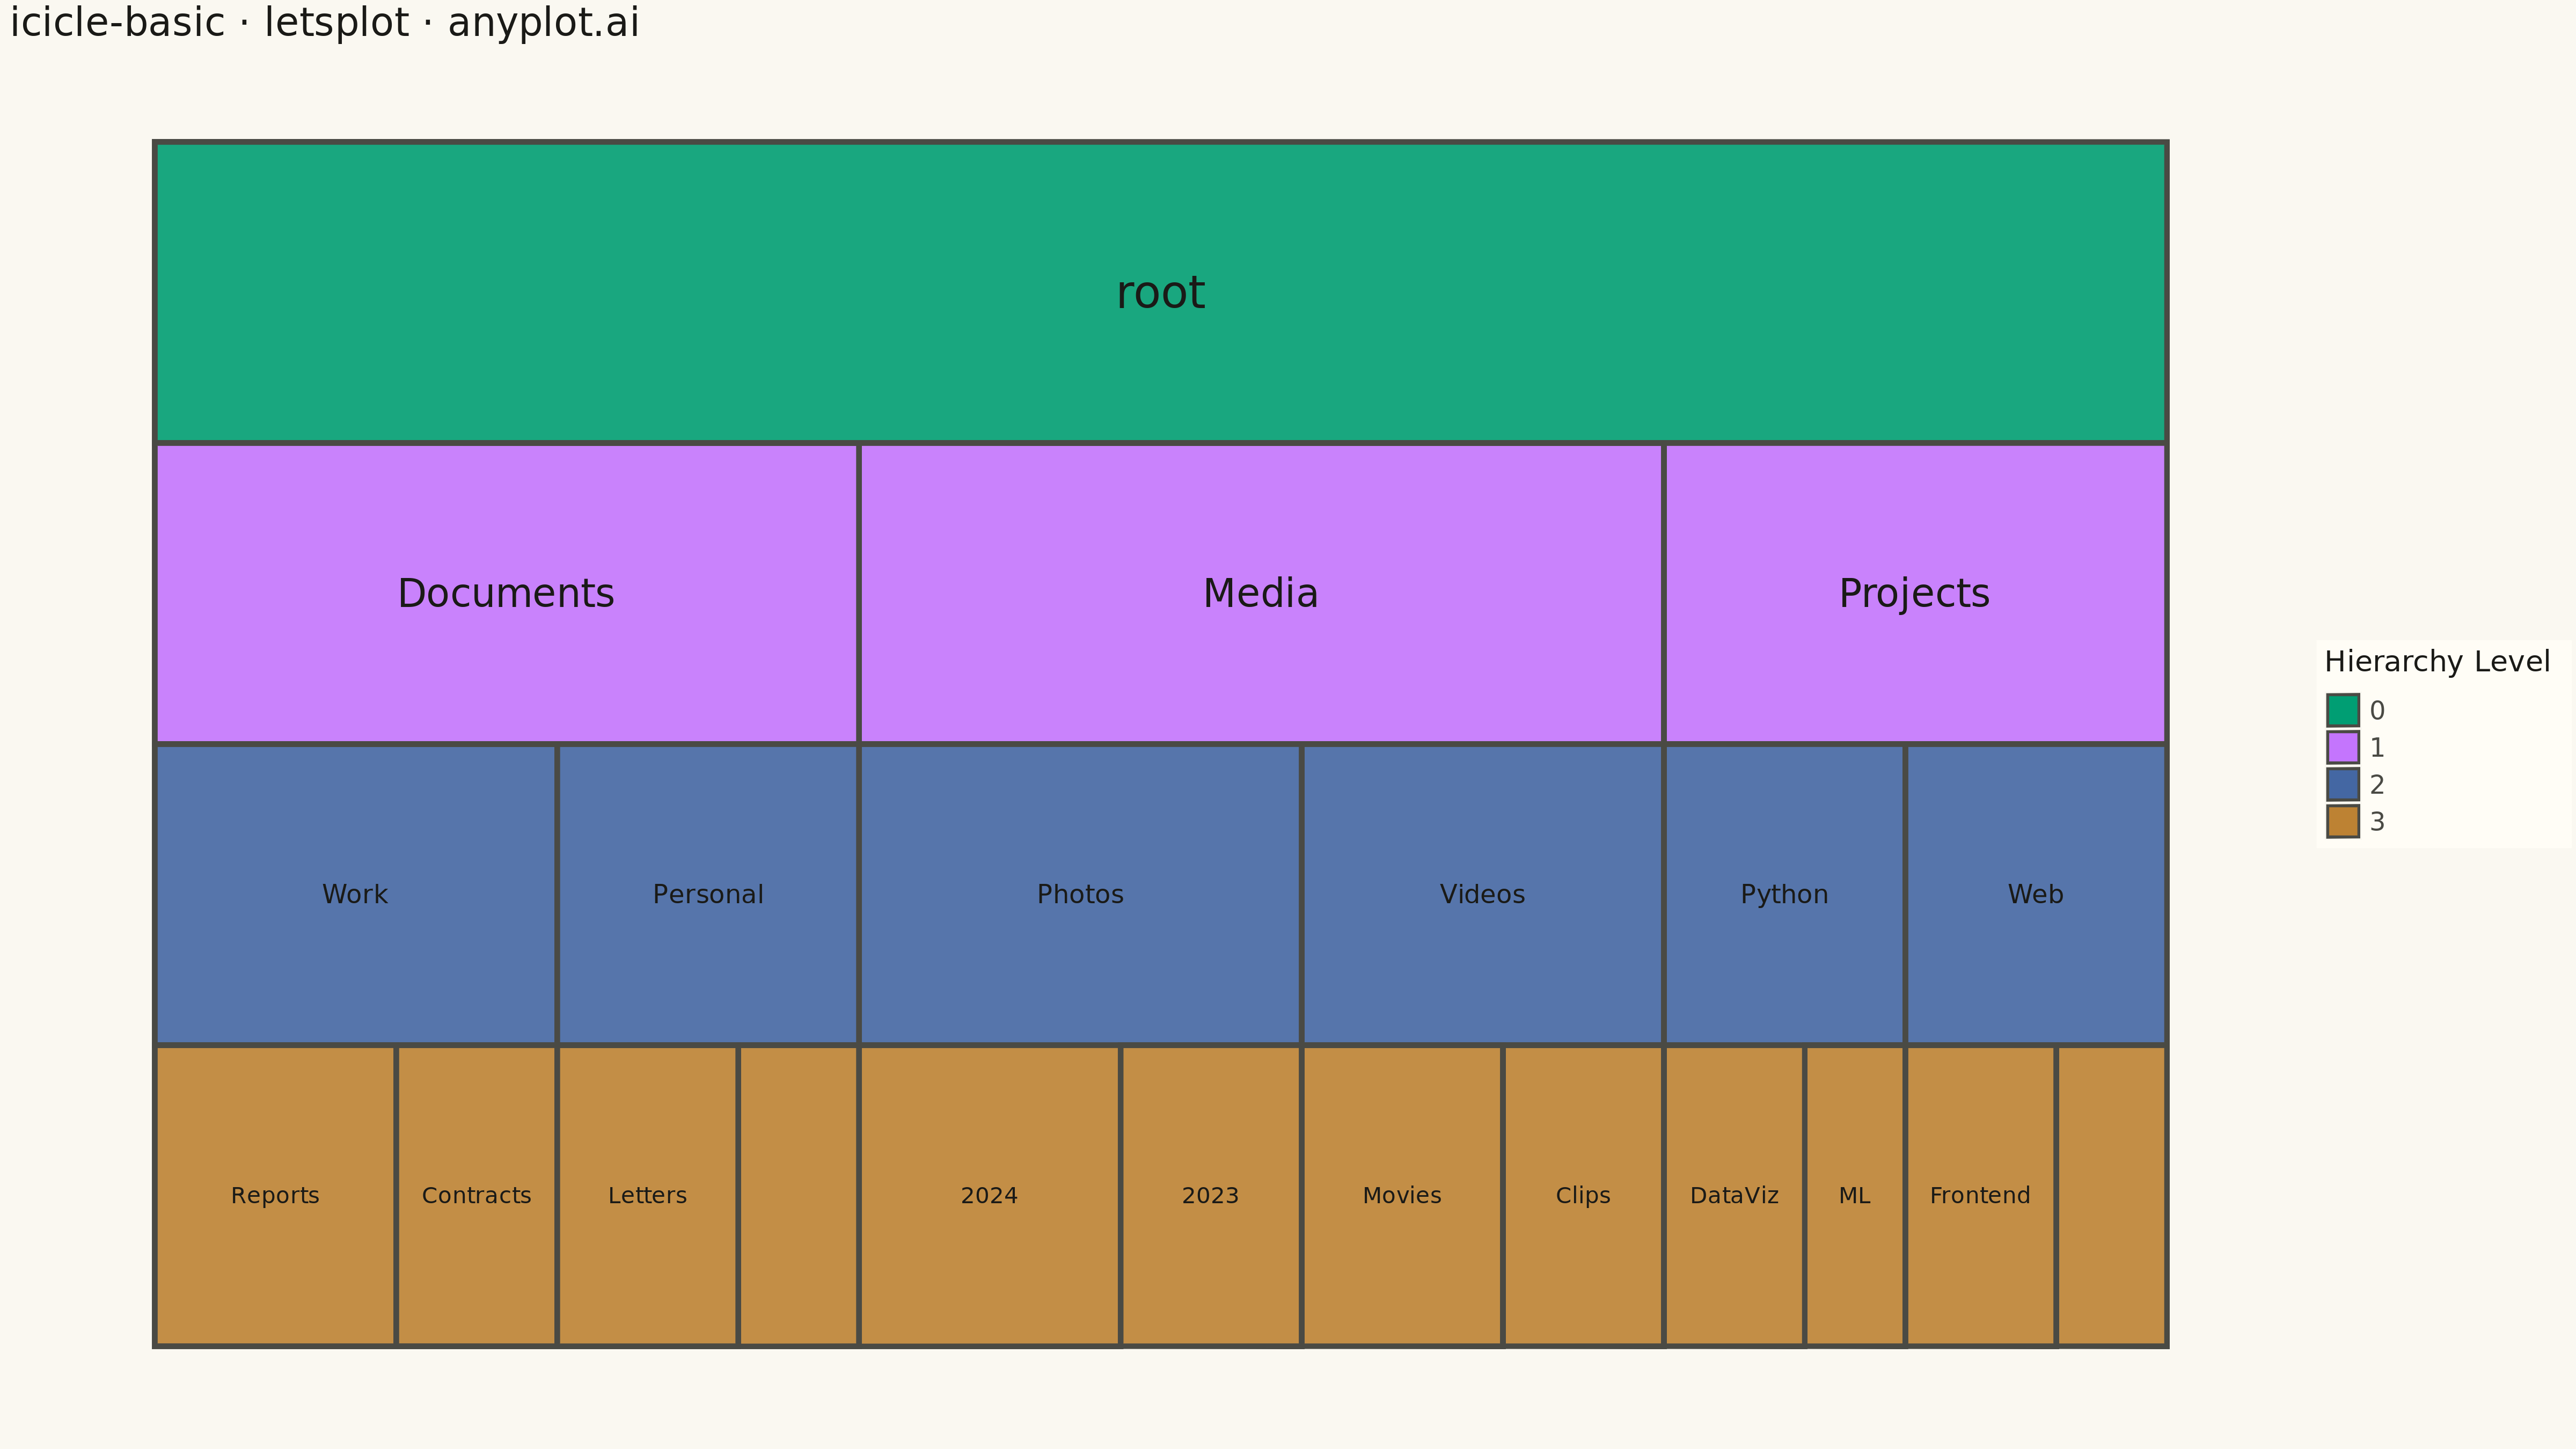
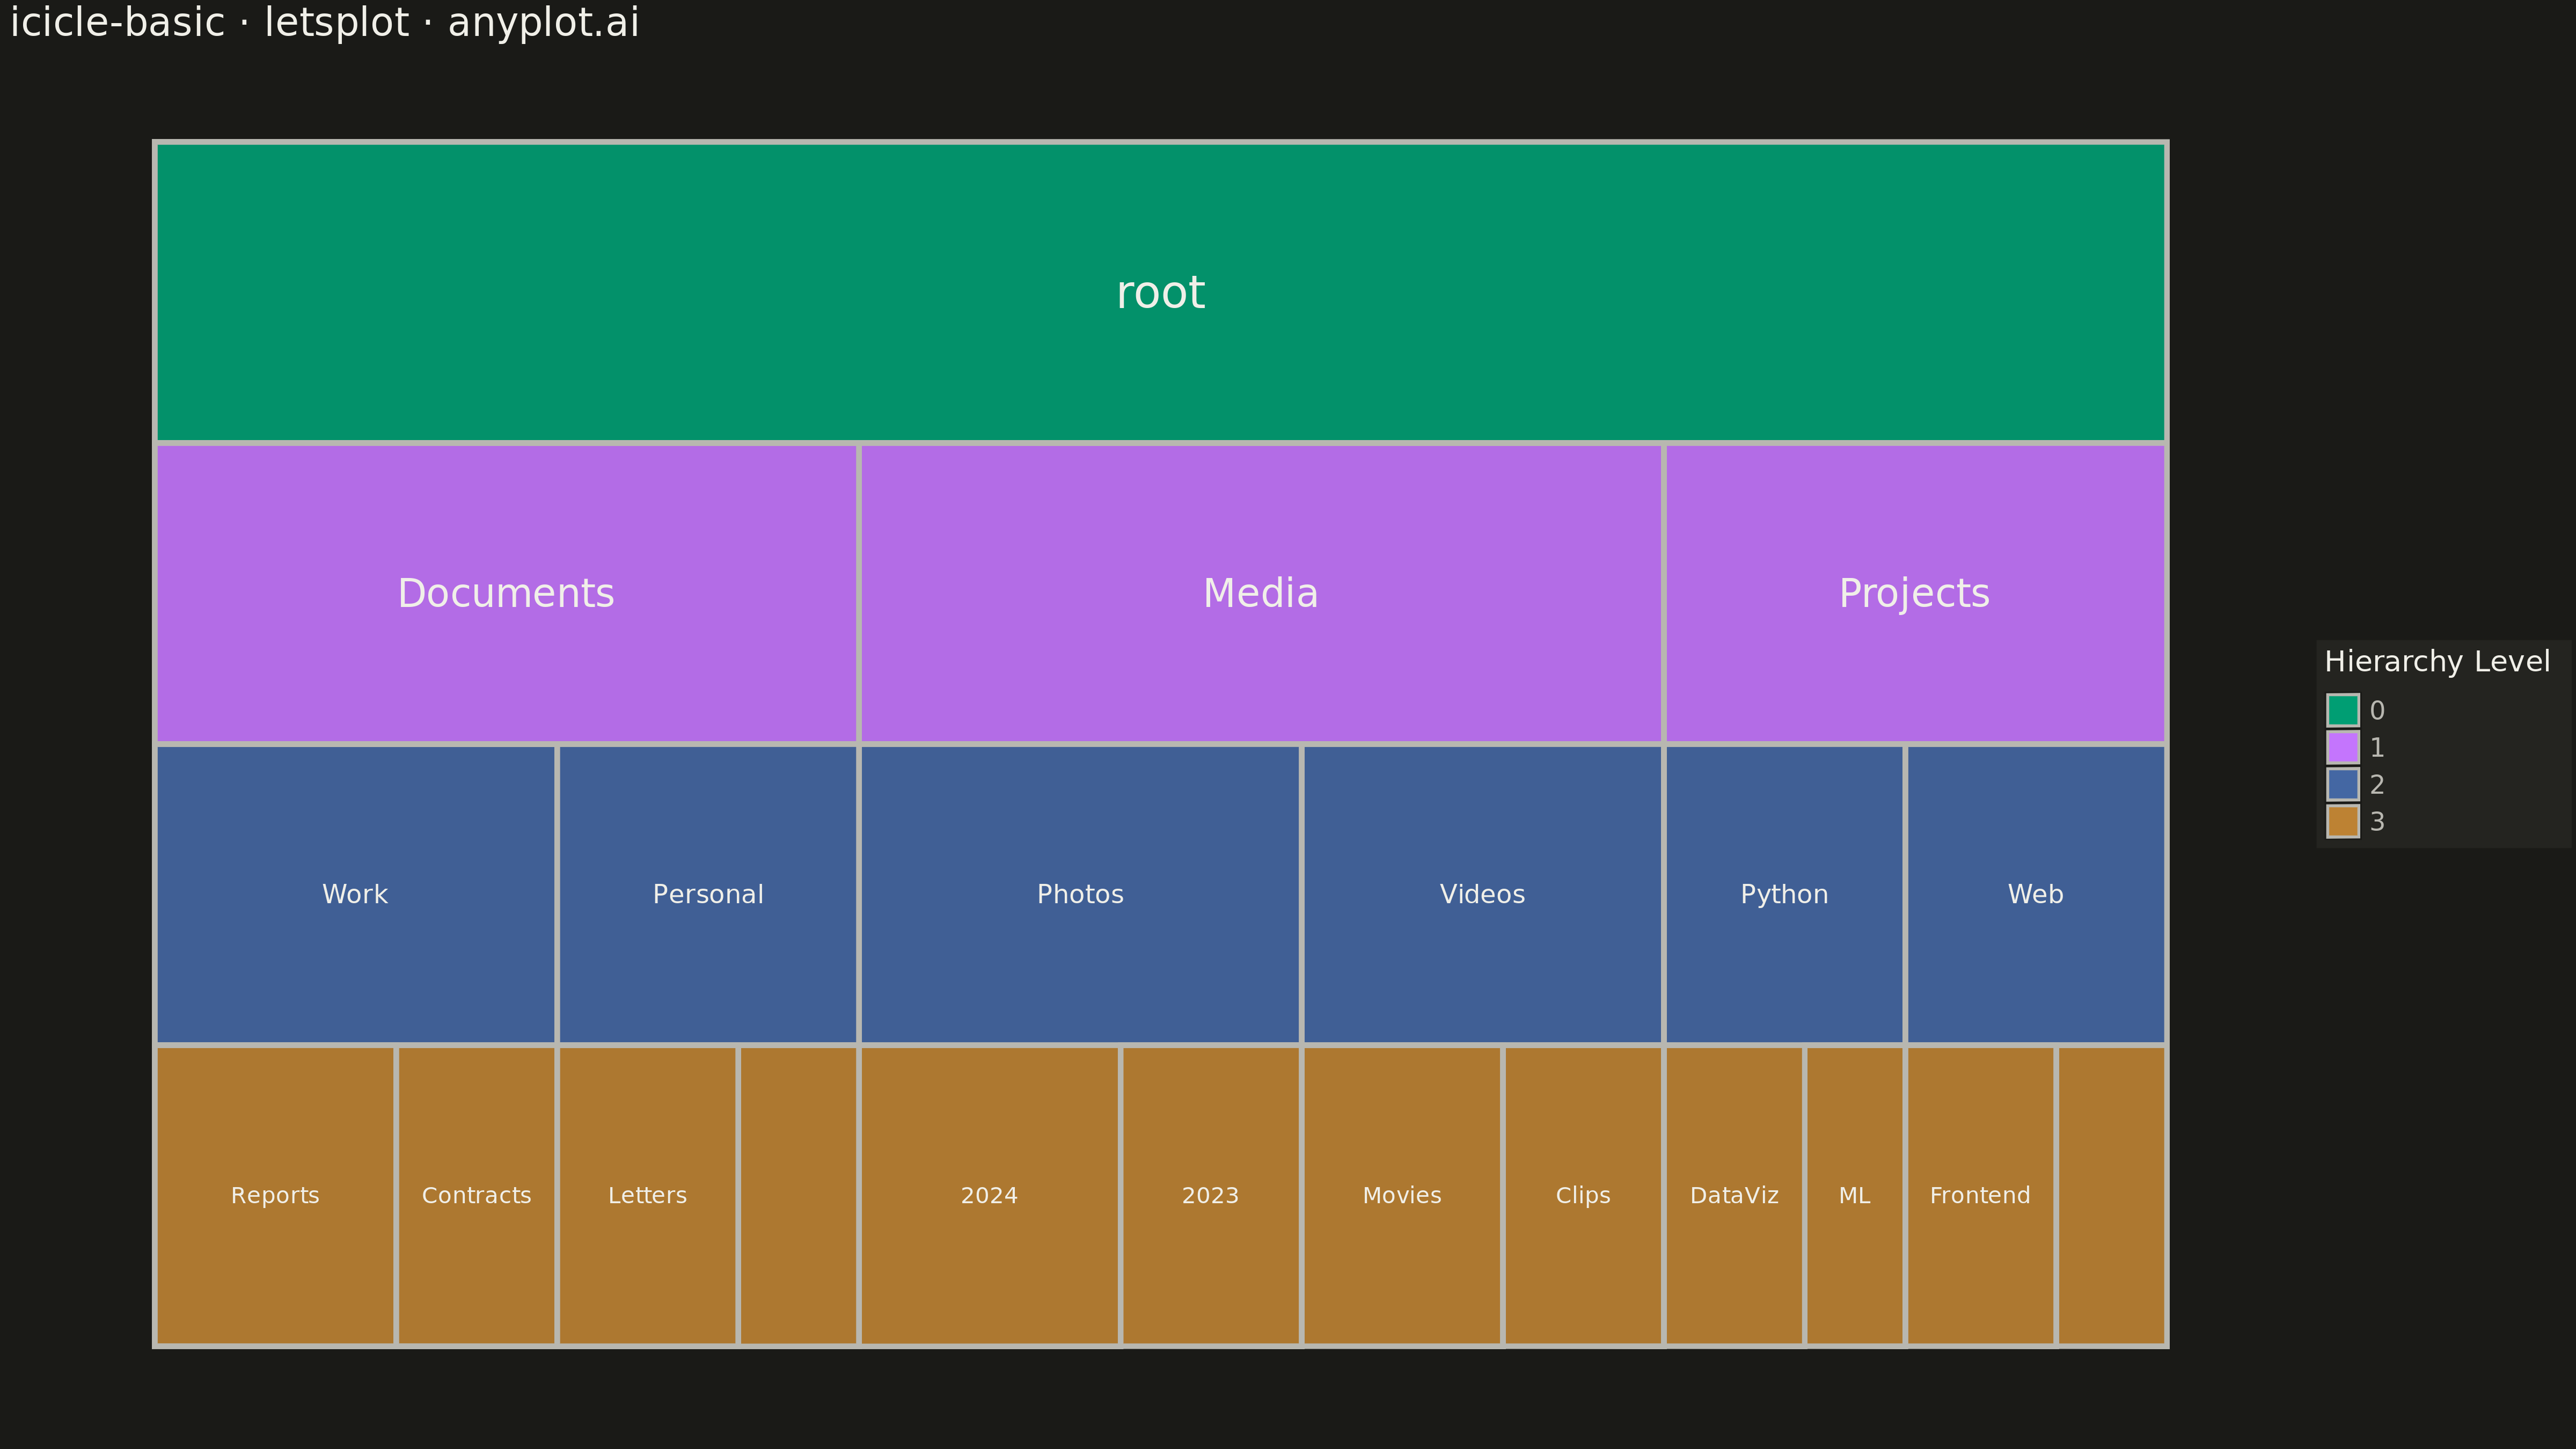
An icicle chart displaying hierarchical data as adjacent rectangles in a layered structure, where each rectangle's size represents its value in the hierarchy. Unlike treemaps that nest rectangles, icicle charts stack them in rows (horizontal) or columns (vertical), making parent-child relationships explicitly visible through spatial adjacency. This layout excels at showing both the hierarchy levels and the proportional values simultaneously.
""" anyplot.ai
icicle-basic: Basic Icicle Chart
Library: letsplot 4.9.0 | Python 3.13.13
Quality: 92/100 | Updated: 2026-05-13
"""

import os

import pandas as pd
from lets_plot import (
    LetsPlot,
    aes,
    element_blank,
    element_rect,
    element_text,
    geom_rect,
    geom_text,
    ggplot,
    ggsave,
    ggsize,
    labs,
    scale_fill_manual,
    scale_size_identity,
    theme,
    xlim,
    ylim,
)


LetsPlot.setup_html()

THEME = os.getenv("ANYPLOT_THEME", "light")
PAGE_BG = "#FAF8F1" if THEME == "light" else "#1A1A17"
ELEVATED_BG = "#FFFDF6" if THEME == "light" else "#242420"
INK = "#1A1A17" if THEME == "light" else "#F0EFE8"
INK_SOFT = "#4A4A44" if THEME == "light" else "#B8B7B0"

IMPRINT = ["#009E73", "#C475FD", "#4467A3", "#BD8233"]

# Hierarchical data: File system example
hierarchy = [
    {"name": "root", "parent": "", "value": 1000},
    {"name": "Documents", "parent": "root", "value": 350},
    {"name": "Media", "parent": "root", "value": 400},
    {"name": "Projects", "parent": "root", "value": 250},
    {"name": "Work", "parent": "Documents", "value": 200},
    {"name": "Personal", "parent": "Documents", "value": 150},
    {"name": "Photos", "parent": "Media", "value": 220},
    {"name": "Videos", "parent": "Media", "value": 180},
    {"name": "Python", "parent": "Projects", "value": 120},
    {"name": "Web", "parent": "Projects", "value": 130},
    {"name": "Reports", "parent": "Work", "value": 120},
    {"name": "Contracts", "parent": "Work", "value": 80},
    {"name": "Letters", "parent": "Personal", "value": 90},
    {"name": "Receipts", "parent": "Personal", "value": 60},
    {"name": "2024", "parent": "Photos", "value": 130},
    {"name": "2023", "parent": "Photos", "value": 90},
    {"name": "Movies", "parent": "Videos", "value": 100},
    {"name": "Clips", "parent": "Videos", "value": 80},
    {"name": "DataViz", "parent": "Python", "value": 70},
    {"name": "ML", "parent": "Python", "value": 50},
    {"name": "Frontend", "parent": "Web", "value": 75},
    {"name": "Backend", "parent": "Web", "value": 55},
]

# Build tree structure
name_to_node = {row["name"]: row for row in hierarchy}
children = {}
for row in hierarchy:
    parent = row["parent"]
    if parent not in children:
        children[parent] = []
    if parent:
        children[parent].append(row["name"])

# Calculate level for each node
levels = {}
for row in hierarchy:
    level = 0
    current = row["name"]
    while name_to_node[current]["parent"]:
        level += 1
        current = name_to_node[current]["parent"]
    levels[row["name"]] = level

max_level = max(levels.values())

# Calculate rectangle positions (horizontal icicle: root at top)
rects = []
stack = [("root", 0.0, 1.0)]

while stack:
    name, x_start, x_end = stack.pop()
    level = levels[name]

    rects.append(
        {
            "name": name,
            "xmin": x_start,
            "xmax": x_end,
            "ymin": max_level - level,
            "ymax": max_level - level + 1,
            "level": level,
        }
    )

    if name in children and children[name]:
        child_names = children[name]
        total_value = sum(name_to_node[c]["value"] for c in child_names)
        x_end_temp = x_end

        for child_name in reversed(child_names):
            child_value = name_to_node[child_name]["value"]
            child_width = (x_end - x_start) * (child_value / total_value)
            child_x_start = x_end_temp - child_width
            stack.append((child_name, child_x_start, x_end_temp))
            x_end_temp = child_x_start

# Create dataframe for rectangles
rect_df = pd.DataFrame(rects)
rect_df["level_str"] = rect_df["level"].astype(str)

# Calculate center positions and dimensions for labels
rect_df["x_center"] = (rect_df["xmin"] + rect_df["xmax"]) / 2
rect_df["y_center"] = (rect_df["ymin"] + rect_df["ymax"]) / 2
rect_df["width"] = rect_df["xmax"] - rect_df["xmin"]

# Show labels for rectangles with sufficient width
rect_df["label_len"] = rect_df["name"].str.len()
rect_df["show_label"] = rect_df["width"] > (rect_df["label_len"] * 0.007 + 0.01)
label_df = rect_df[rect_df["show_label"]].copy()

# Adjust font size based on level
label_df["font_size"] = label_df["level"].map({0: 14, 1: 12, 2: 8, 3: 7})

# Color palette by level using Okabe-Ito
colors = {
    "0": IMPRINT[0],  # Level 0: bluish green
    "1": IMPRINT[1],  # Level 1: vermillion
    "2": IMPRINT[2],  # Level 2: blue
    "3": IMPRINT[3],  # Level 3: reddish purple
}

anyplot_theme = theme(
    plot_background=element_rect(fill=PAGE_BG, color=PAGE_BG),
    panel_background=element_rect(fill=PAGE_BG, color=PAGE_BG),
    panel_grid=element_blank(),
    axis_title=element_blank(),
    axis_text=element_blank(),
    axis_ticks=element_blank(),
    axis_line=element_blank(),
    plot_title=element_text(size=24, color=INK),
    legend_background=element_rect(fill=ELEVATED_BG, color=INK_SOFT),
    legend_text=element_text(size=16, color=INK_SOFT),
    legend_title=element_text(size=18, color=INK),
)

# Create plot
plot = (
    ggplot()
    + geom_rect(
        aes(xmin="xmin", xmax="xmax", ymin="ymin", ymax="ymax", fill="level_str"),
        data=rect_df,
        color=INK_SOFT,
        size=1.5,
        alpha=0.9,
    )
    + geom_text(aes(x="x_center", y="y_center", label="name", size="font_size"), data=label_df, color=INK)
    + scale_fill_manual(values=colors, name="Hierarchy Level")
    + scale_size_identity()
    + xlim(-0.02, 1.02)
    + ylim(-0.1, max_level + 1.1)
    + labs(title="icicle-basic · letsplot · anyplot.ai")
    + anyplot_theme
    + ggsize(1600, 900)
)

# Save outputs
ggsave(plot, f"plot-{THEME}.png", path=".", scale=3)
ggsave(plot, f"plot-{THEME}.html", path=".")
Runnable source as JSON, for any HTTP client: https://api.anyplot.ai/specs/icicle-basic/letsplot/code. Any spec id and library id listed in llms-full.txt fit the same URL shape; every URL below is complete and callable.
{
  "spec_id": "icicle-basic",
  "language": "python",
  "library": "letsplot",
  "page": "https://anyplot.ai/icicle-basic/python/letsplot",
  "hub": "https://anyplot.ai/icicle-basic",
  "code_json": "https://api.anyplot.ai/specs/icicle-basic/letsplot/code",
  "spec_json": "https://api.anyplot.ai/specs/icicle-basic",
  "render_light_png": "https://storage.googleapis.com/anyplot-images/plots/icicle-basic/python/letsplot/plot-light.png",
  "render_dark_png": "https://storage.googleapis.com/anyplot-images/plots/icicle-basic/python/letsplot/plot-dark.png",
  "interactive_light_html": "https://storage.googleapis.com/anyplot-images/plots/icicle-basic/python/letsplot/plot-light.html",
  "interactive_dark_html": "https://storage.googleapis.com/anyplot-images/plots/icicle-basic/python/letsplot/plot-dark.html",
  "quality_score": 92.0,
  "license": "MIT",
  "guide": "https://anyplot.ai/llms.txt"
}
Part of Basic Icicle Chart on anyplot.ai.