The same plot in 14 other libraries — Python: Altair, Bokeh, lets-plot, Matplotlib, Plotly, plotnine, Pygal, Seaborn; Julia: Makie.jl; JavaScript: Chart.js, D3.js, Apache ECharts, Highcharts, MUI X Charts. Compare all 15 side by side: Basic Icicle Chart in Python, R, Julia and JavaScript.
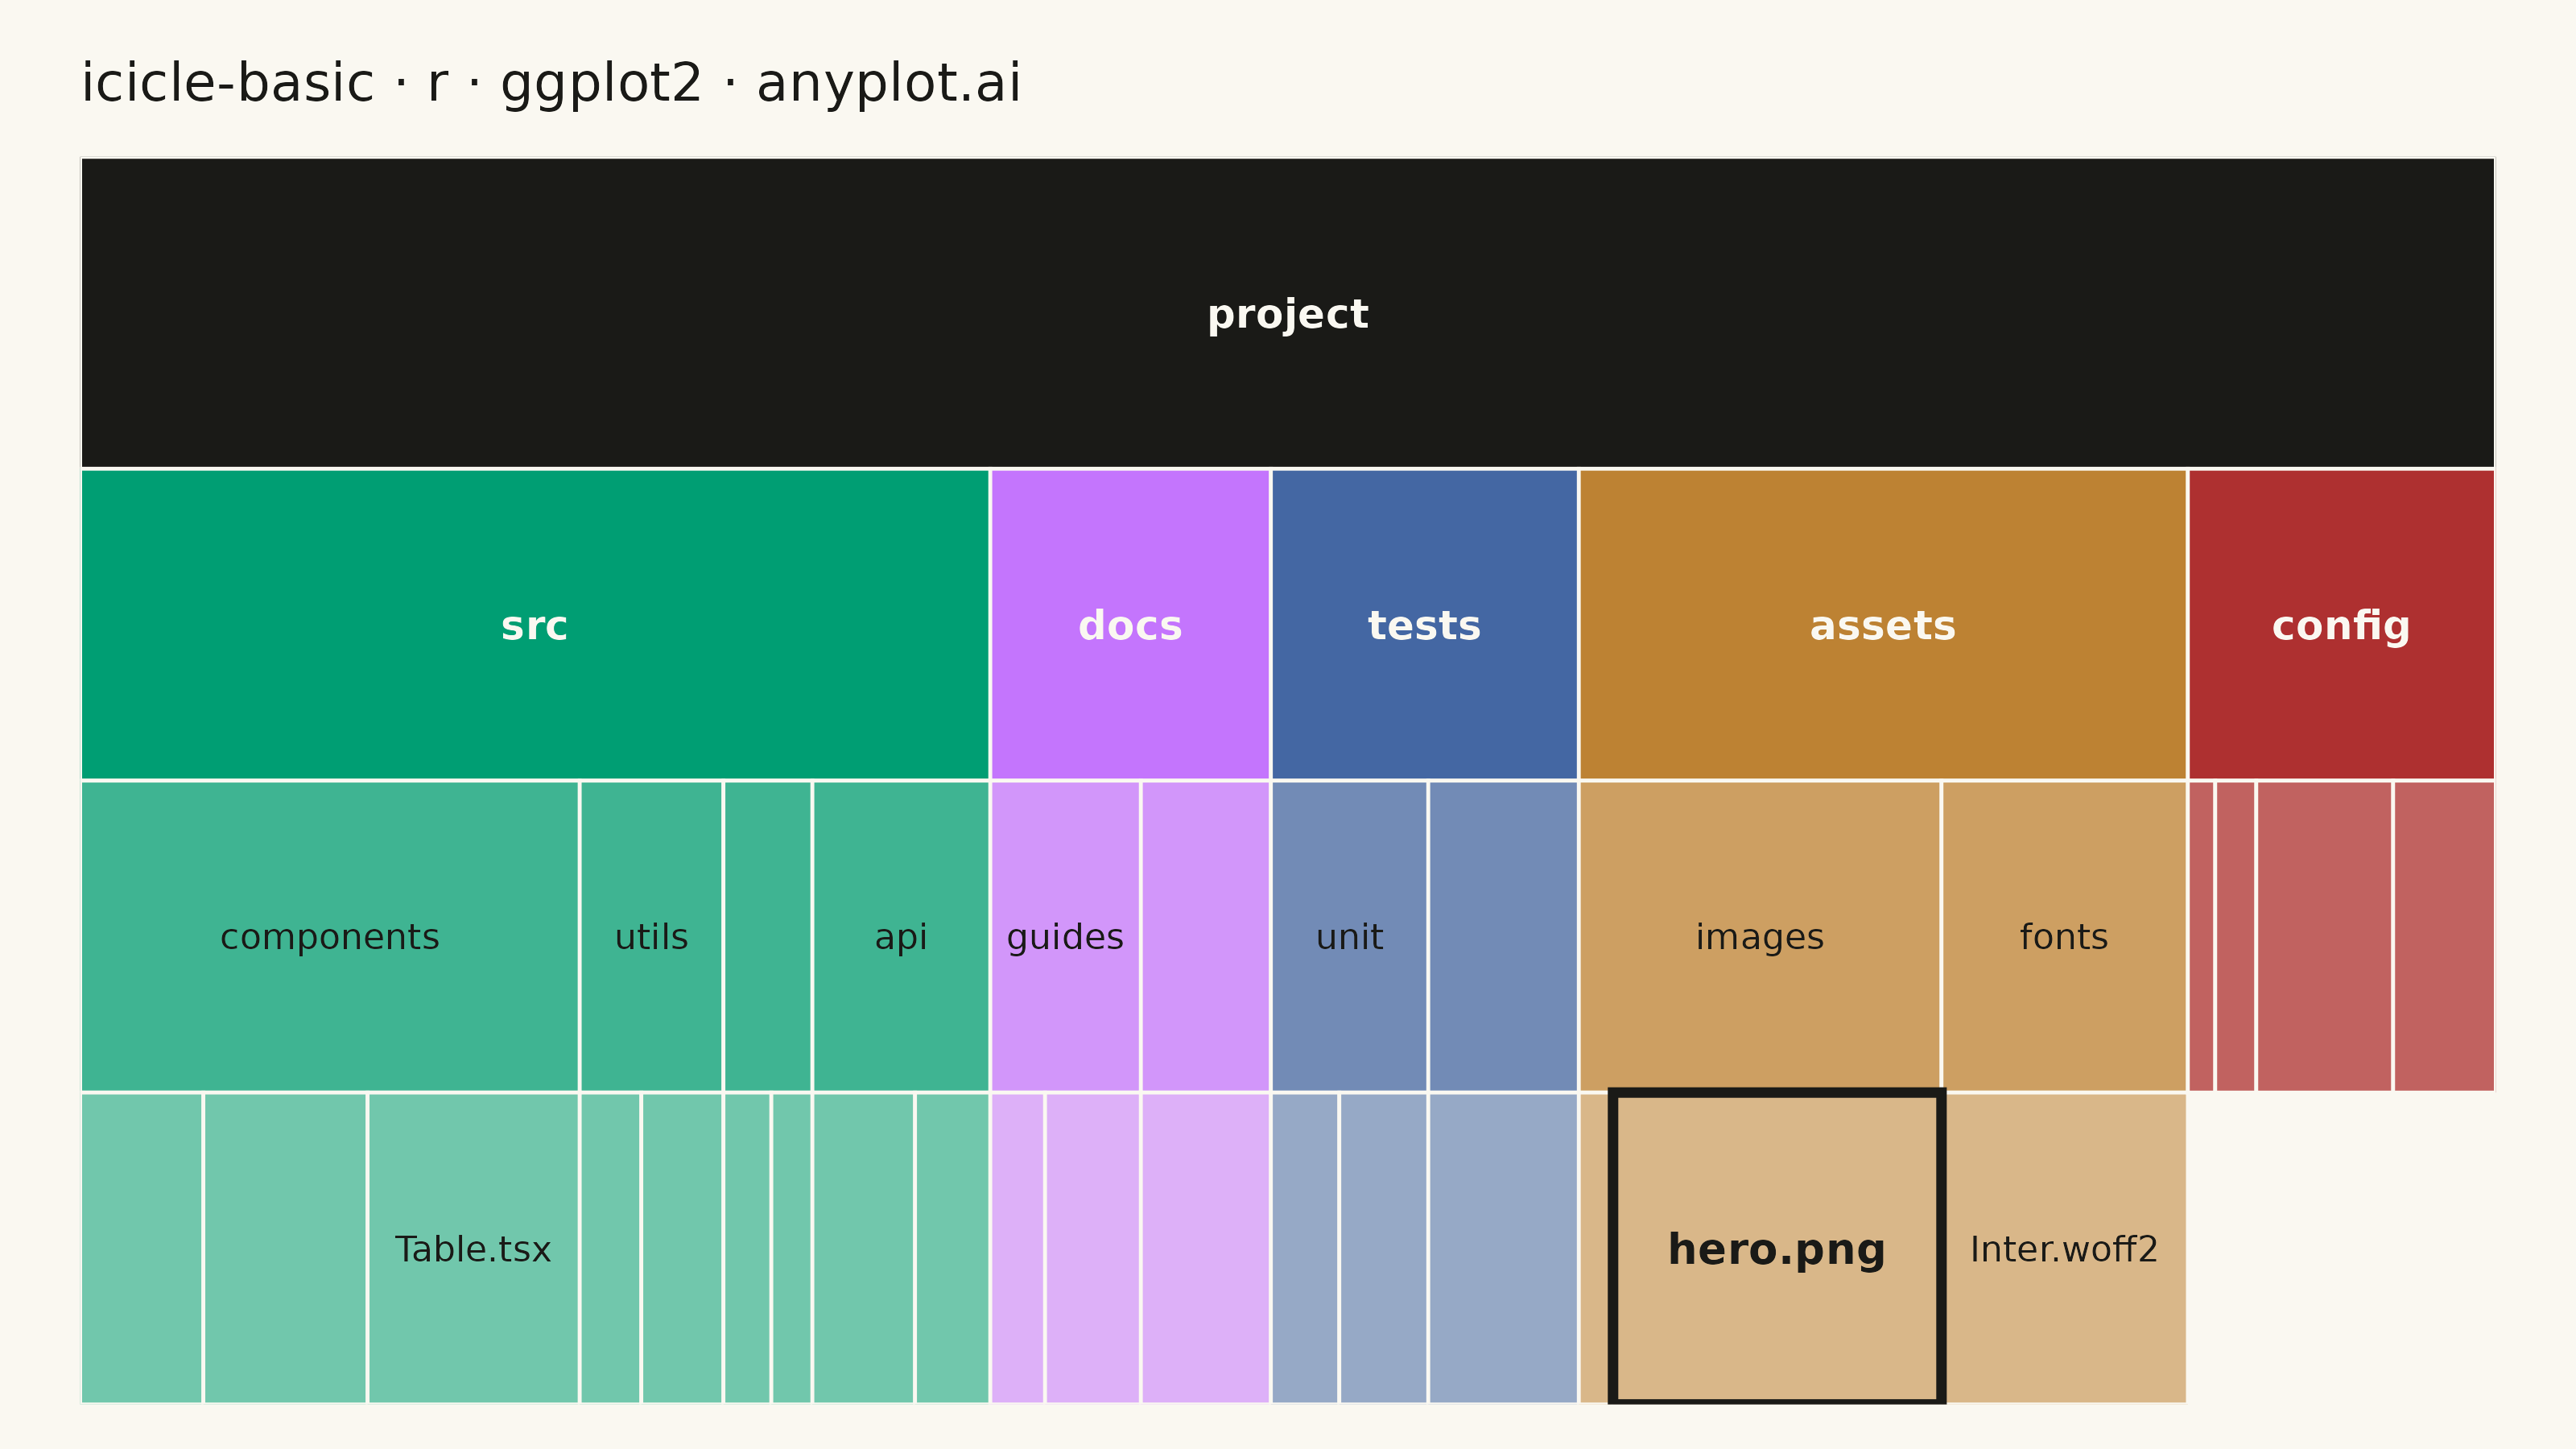
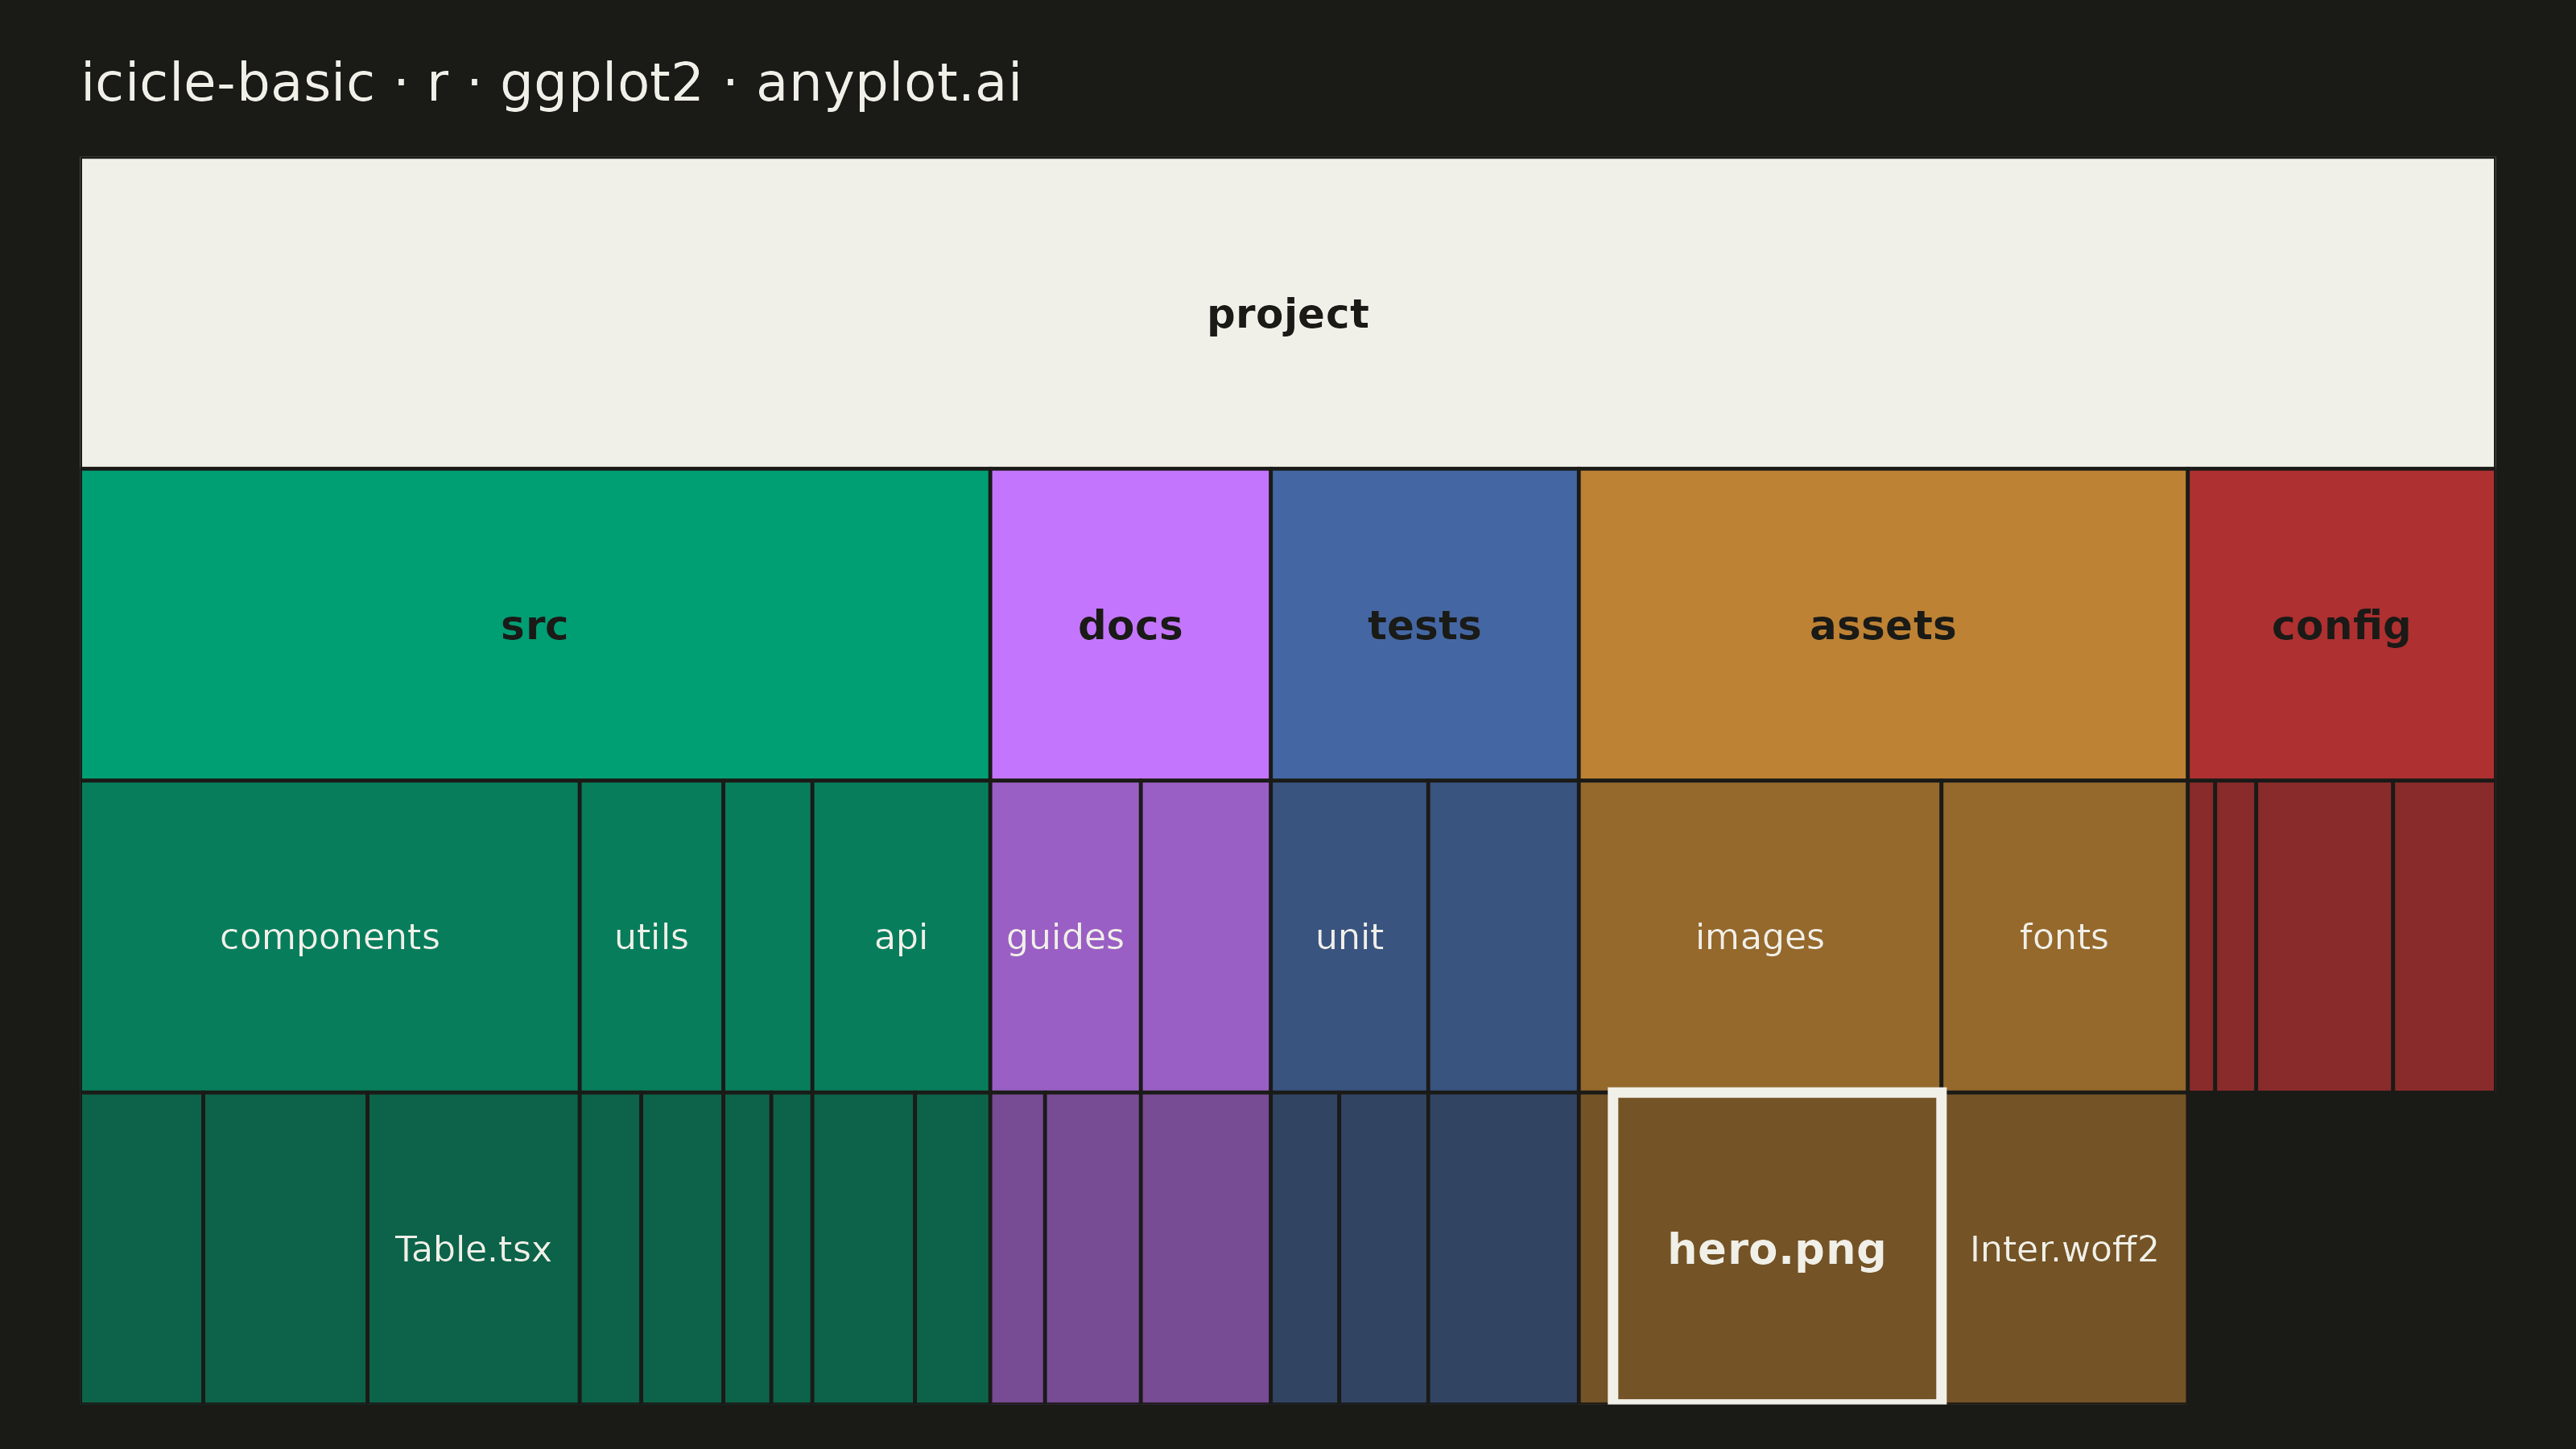
An icicle chart displaying hierarchical data as adjacent rectangles in a layered structure, where each rectangle's size represents its value in the hierarchy. Unlike treemaps that nest rectangles, icicle charts stack them in rows (horizontal) or columns (vertical), making parent-child relationships explicitly visible through spatial adjacency. This layout excels at showing both the hierarchy levels and the proportional values simultaneously.
#' anyplot.ai
#' icicle-basic: Basic Icicle Chart
#' Library: ggplot2 3.5.1 | R 4.4.1
#' Quality: 91/100 | Created: 2026-09-05

library(ggplot2)
library(dplyr)
library(ragg)

set.seed(42)

# --- Theme tokens -----------------------------------------------------------
THEME   <- Sys.getenv("ANYPLOT_THEME", "light")
PAGE_BG <- if (THEME == "light") "#FAF8F1" else "#1A1A17"
INK     <- if (THEME == "light") "#1A1A17" else "#F0EFE8"
NEUTRAL <- INK
IMPRINT_PALETTE <- c("#009E73", "#C475FD", "#4467A3", "#BD8233",
                     "#AE3030", "#2ABCCD", "#954477", "#99B314")

# --- Data: file system hierarchy (folder/file sizes in KB) ------------------
nodes <- tibble::tribble(
  ~id,                   ~parent,        ~value,
  "project",             NA,             NA,
  "src",                 "project",      NA,
  "docs",                "project",      NA,
  "tests",               "project",      NA,
  "assets",              "project",      NA,
  "config",              "project",      NA,
  "components",          "src",          NA,
  "utils",               "src",          NA,
  "hooks",               "src",          NA,
  "api",                 "src",          NA,
  "guides",              "docs",         NA,
  "api-docs",            "docs",         NA,
  "unit",                "tests",        NA,
  "integration",         "tests",        NA,
  "images",              "assets",       NA,
  "fonts",               "assets",       NA,
  "Button.tsx",          "components",   18,
  "Modal.tsx",           "components",   24,
  "Table.tsx",           "components",   31,
  "format.ts",           "utils",         9,
  "validate.ts",         "utils",        12,
  "useAuth.ts",          "hooks",         7,
  "useFetch.ts",         "hooks",         6,
  "client.ts",           "api",          15,
  "routes.ts",           "api",          11,
  "getting-started.md",  "guides",        8,
  "deployment.md",       "guides",       14,
  "endpoints.md",        "api-docs",     19,
  "Button.test.ts",      "unit",         10,
  "Table.test.ts",       "unit",         13,
  "auth.test.ts",        "integration",  22,
  "logo.svg",            "images",        5,
  "hero.png",            "images",       48,
  "Inter.woff2",         "fonts",        36,
  "ci.yml",              "config",        4,
  "build.config.js",     "config",        6,
  "eslint.config.js",    "config",       20,
  "tsconfig.json",       "config",       15
)

# Depth of each node from the root (iterative — resolves one generation per pass)
nodes$depth <- ifelse(is.na(nodes$parent), 0L, NA_integer_)
for (pass in 1:3) {
  parent_depth <- setNames(nodes$depth, nodes$id)
  pending <- is.na(nodes$depth)
  nodes$depth[pending] <- parent_depth[nodes$parent[pending]] + 1L
}
max_depth <- max(nodes$depth)

# Node size = own value for leaves, sum of children for folders (bottom-up)
nodes$size <- nodes$value
for (d in rev(0:(max_depth - 1))) {
  for (pid in nodes$id[nodes$depth == d]) {
    child_sizes <- nodes$size[nodes$parent == pid & !is.na(nodes$parent)]
    if (length(child_sizes) > 0) nodes$size[nodes$id == pid] <- sum(child_sizes)
  }
}

# Horizontal extent: each node's width is proportional to its size within
# the span its parent occupies (top-down pass fills children from parents)
nodes$x0 <- NA_real_
nodes$x1 <- NA_real_
nodes$x0[nodes$depth == 0] <- 0
nodes$x1[nodes$depth == 0] <- nodes$size[nodes$depth == 0]
for (d in 0:(max_depth - 1)) {
  for (pid in nodes$id[nodes$depth == d]) {
    child_idx <- which(nodes$parent == pid)
    if (length(child_idx) == 0) next
    parent_x0 <- nodes$x0[nodes$id == pid]
    parent_x1 <- nodes$x1[nodes$id == pid]
    child_sizes <- nodes$size[child_idx]
    cum_end <- cumsum(child_sizes) / sum(child_sizes) * (parent_x1 - parent_x0)
    nodes$x0[child_idx] <- parent_x0 + c(0, head(cum_end, -1))
    nodes$x1[child_idx] <- parent_x0 + cum_end
  }
}

# Vertical position: root row at top, deeper levels stack below it
nodes$y1 <- max_depth + 1 - nodes$depth
nodes$y0 <- nodes$y1 - 1

# Branch = the top-level folder each node descends from (root is its own branch)
nodes$branch <- NA_character_
nodes$branch[nodes$depth == 0] <- "root"
for (d in 1:max_depth) {
  for (nid in nodes$id[nodes$depth == d]) {
    nodes$branch[nodes$id == nid] <- if (d == 1) {
      nid
    } else {
      nodes$branch[nodes$id == nodes$parent[nodes$id == nid]]
    }
  }
}

px_per_unit <- 3200 / nodes$size[nodes$depth == 0]

nodes <- nodes %>%
  mutate(
    fill_color = case_when(
      branch == "root"   ~ NEUTRAL,
      branch == "src"    ~ IMPRINT_PALETTE[1],
      branch == "docs"   ~ IMPRINT_PALETTE[2],
      branch == "tests"  ~ IMPRINT_PALETTE[3],
      branch == "assets" ~ IMPRINT_PALETTE[4],
      branch == "config" ~ IMPRINT_PALETTE[5]
    ),
    depth_alpha = case_when(
      depth <= 1 ~ 1.00,
      depth == 2 ~ 0.75,
      depth == 3 ~ 0.55
    ),
    label_color = if_else(depth <= 1, PAGE_BG, INK),
    width = x1 - x0,
    # A label only fits if the rect is wider than its own text at render size —
    # avoids the classic icicle/treemap failure mode of text spilling past narrow cells.
    char_px = if_else(depth <= 1, 30, 24.3),
    required_width = (nchar(id) * char_px * 1.15) / px_per_unit,
    show_label = width >= required_width
  )

headers <- filter(nodes, show_label, depth <= 1)
leaves  <- filter(nodes, show_label, depth > 1)

# Focal point: the single largest terminal file gets an ink outline + bolder
# label so the viewer has one clear "biggest thing" to anchor on.
largest_id <- nodes %>%
  filter(!(id %in% nodes$parent)) %>%
  slice_max(value, n = 1) %>%
  pull(id)

highlight      <- filter(nodes, id == largest_id)
leaves_plain   <- filter(leaves, id != largest_id)
leaves_focal   <- filter(leaves, id == largest_id)

# --- Plot --------------------------------------------------------------------
title_text <- "icicle-basic · r · ggplot2 · anyplot.ai"

p <- ggplot(nodes) +
  geom_rect(
    aes(xmin = x0, xmax = x1, ymin = y0, ymax = y1,
        fill = fill_color, alpha = depth_alpha),
    color = PAGE_BG, linewidth = 0.4
  ) +
  geom_rect(
    data = highlight,
    aes(xmin = x0, xmax = x1, ymin = y0, ymax = y1),
    color = INK, fill = NA, linewidth = 1.1
  ) +
  geom_text(
    data = headers,
    aes(x = (x0 + x1) / 2, y = (y0 + y1) / 2, label = id, color = label_color),
    size = 3.2, fontface = "bold"
  ) +
  geom_text(
    data = leaves_plain,
    aes(x = (x0 + x1) / 2, y = (y0 + y1) / 2, label = id, color = label_color),
    size = 2.8
  ) +
  geom_text(
    data = leaves_focal,
    aes(x = (x0 + x1) / 2, y = (y0 + y1) / 2, label = id, color = label_color),
    size = 3.4, fontface = "bold"
  ) +
  scale_fill_identity() +
  scale_alpha_identity() +
  scale_color_identity() +
  scale_x_continuous(expand = c(0, 0)) +
  scale_y_continuous(expand = c(0, 0)) +
  labs(title = title_text) +
  theme_void(base_size = 8) +
  theme(
    plot.background = element_rect(fill = PAGE_BG, color = PAGE_BG),
    panel.background = element_rect(fill = PAGE_BG, color = NA),
    plot.title = element_text(color = INK, size = 12, hjust = 0, margin = margin(b = 10)),
    plot.margin = margin(t = 14, r = 18, b = 10, l = 18)
  )

# --- Save --------------------------------------------------------------------
ggsave(
  filename = sprintf("plot-%s.png", THEME),
  plot     = p,
  device   = ragg::agg_png,
  width    = 8,
  height   = 4.5,
  units    = "in",
  dpi      = 400
)
Runnable source as JSON, for any HTTP client: https://api.anyplot.ai/specs/icicle-basic/ggplot2/code. Any spec id and library id listed in llms-full.txt fit the same URL shape; every URL below is complete and callable.
{
  "spec_id": "icicle-basic",
  "language": "r",
  "library": "ggplot2",
  "page": "https://anyplot.ai/icicle-basic/r/ggplot2",
  "hub": "https://anyplot.ai/icicle-basic",
  "code_json": "https://api.anyplot.ai/specs/icicle-basic/ggplot2/code",
  "spec_json": "https://api.anyplot.ai/specs/icicle-basic",
  "render_light_png": "https://storage.googleapis.com/anyplot-images/plots/icicle-basic/r/ggplot2/plot-light.png",
  "render_dark_png": "https://storage.googleapis.com/anyplot-images/plots/icicle-basic/r/ggplot2/plot-dark.png",
  "quality_score": 91.0,
  "license": "MIT",
  "guide": "https://anyplot.ai/llms.txt"
}
Part of Basic Icicle Chart on anyplot.ai.