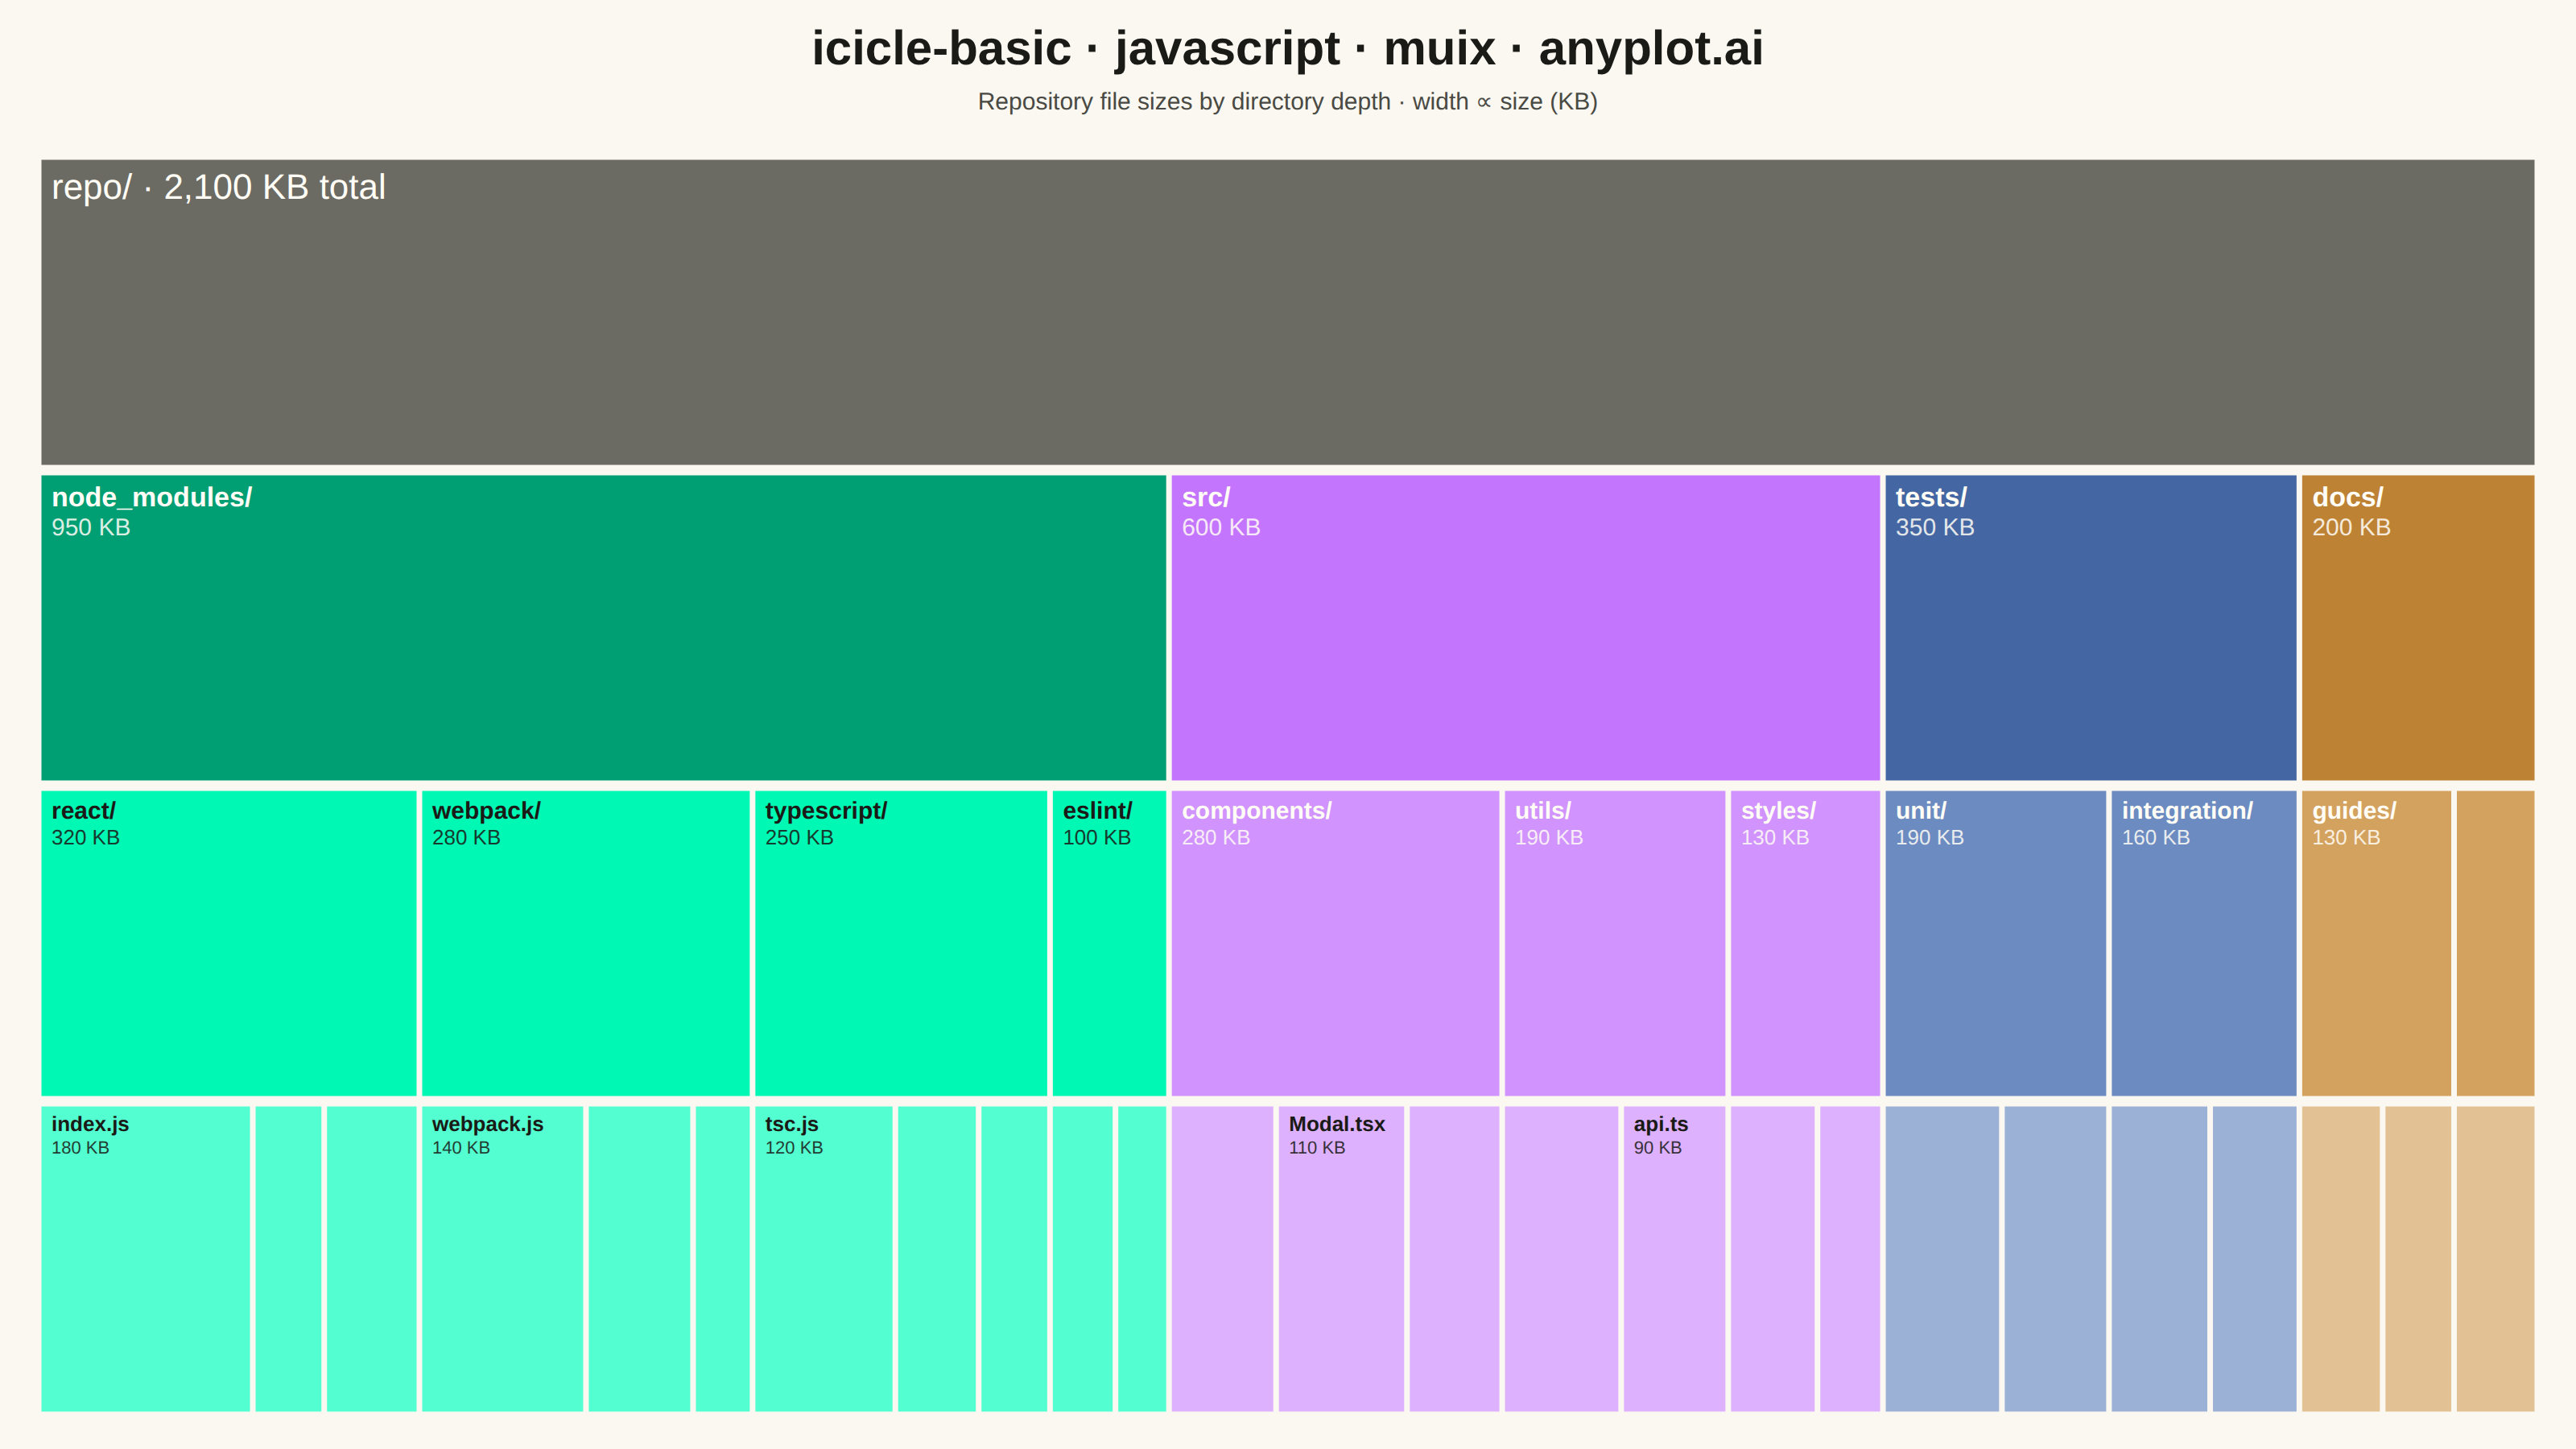
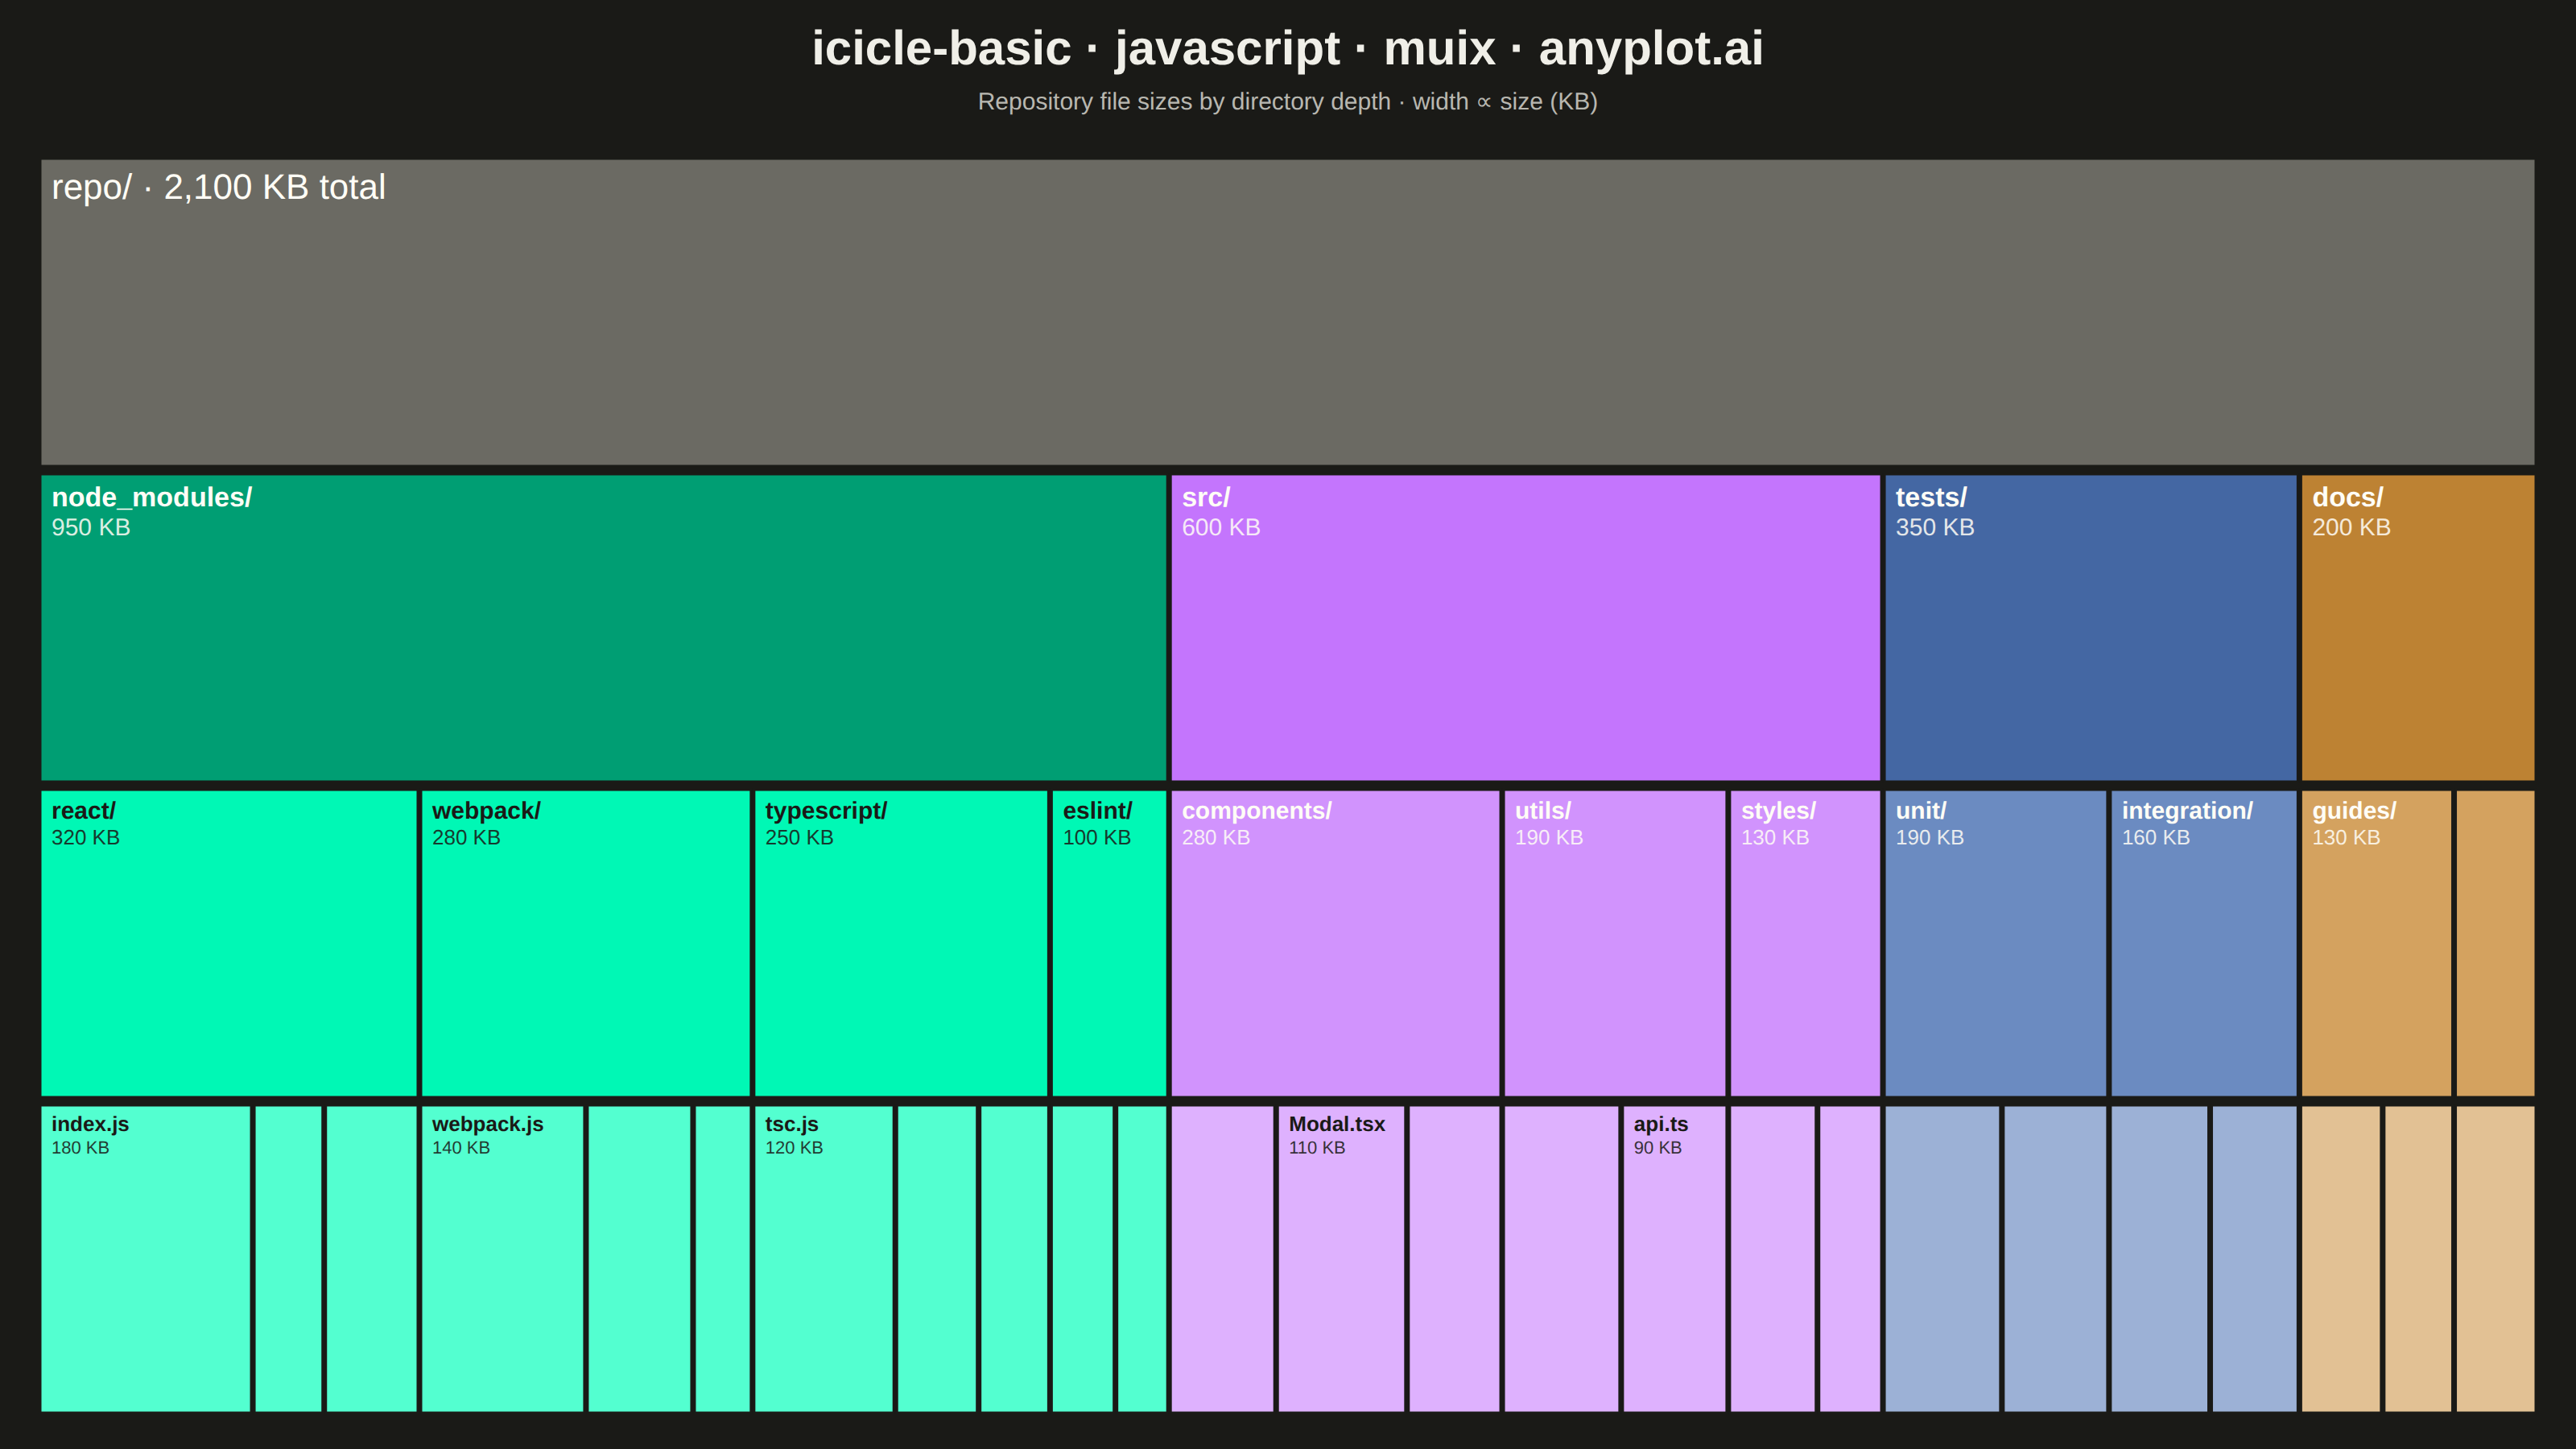
The same plot in 14 other libraries — JavaScript: Chart.js, D3.js, Apache ECharts, Highcharts; Python: Altair, Bokeh, lets-plot, Matplotlib, Plotly, plotnine, Pygal, Seaborn; R: ggplot2; Julia: Makie.jl. Compare all 15 side by side: Basic Icicle Chart in Python, R, Julia and JavaScript.
An icicle chart displaying hierarchical data as adjacent rectangles in a layered structure, where each rectangle's size represents its value in the hierarchy. Unlike treemaps that nest rectangles, icicle charts stack them in rows (horizontal) or columns (vertical), making parent-child relationships explicitly visible through spatial adjacency. This layout excels at showing both the hierarchy levels and the proportional values simultaneously.
// anyplot.ai
// icicle-basic: Basic Icicle Chart
// Library: muix 7.29.1 | JavaScript 22.23.2
// Quality: 86/100 | Created: 2026-09-05
import { ChartContainer } from "@mui/x-charts/ChartContainer";
import { useDrawingArea } from "@mui/x-charts/hooks";

const t = window.ANYPLOT_TOKENS;

const title = "icicle-basic · javascript · muix · anyplot.ai";
const titleFontSize = Math.round(30 * Math.min(1, 67 / title.length));

// --- Data: a file-system hierarchy (name/children/value in KB) -- one of the
// spec's listed applications. 4 top-level directories, 11 subdirectories, 25
// files -- 41 nodes total, well inside the spec's 10-100 node range. Only
// leaves carry an explicit size; directory sizes are the sum of their
// contents, exactly like `du` on a real file system. -----------------------
const TREE = {
  name: "repo/",
  children: [
    {
      name: "node_modules/",
      children: [
        {
          name: "react/",
          children: [
            { name: "index.js", value: 180 },
            { name: "package.json", value: 60 },
            { name: "README.md", value: 80 },
          ],
        },
        {
          name: "webpack/",
          children: [
            { name: "webpack.js", value: 140 },
            { name: "loader.js", value: 90 },
            { name: "config.js", value: 50 },
          ],
        },
        {
          name: "typescript/",
          children: [
            { name: "tsc.js", value: 120 },
            { name: "lib.d.ts", value: 70 },
            { name: "compiler.js", value: 60 },
          ],
        },
        {
          name: "eslint/",
          children: [
            { name: "index.js", value: 55 },
            { name: "rules.js", value: 45 },
          ],
        },
      ],
    },
    {
      name: "src/",
      children: [
        {
          name: "components/",
          children: [
            { name: "Button.tsx", value: 90 },
            { name: "Modal.tsx", value: 110 },
            { name: "Chart.tsx", value: 80 },
          ],
        },
        {
          name: "utils/",
          children: [
            { name: "format.ts", value: 100 },
            { name: "api.ts", value: 90 },
          ],
        },
        {
          name: "styles/",
          children: [
            { name: "theme.css", value: 75 },
            { name: "globals.css", value: 55 },
          ],
        },
      ],
    },
    {
      name: "tests/",
      children: [
        {
          name: "unit/",
          children: [
            { name: "button.test.ts", value: 100 },
            { name: "utils.test.ts", value: 90 },
          ],
        },
        {
          name: "integration/",
          children: [
            { name: "api.test.ts", value: 85 },
            { name: "flow.test.ts", value: 75 },
          ],
        },
      ],
    },
    {
      name: "docs/",
      children: [
        {
          name: "guides/",
          children: [
            { name: "getting-started.md", value: 70 },
            { name: "deployment.md", value: 60 },
          ],
        },
        {
          name: "reference/",
          children: [{ name: "api-reference.md", value: 70 }],
        },
      ],
    },
  ],
};

// Bottom-up: a directory's size is the sum of what it contains (leaves carry
// their own explicit `value`).
function computeValue(node) {
  if (!node.children) return node.value;
  node.value = node.children.reduce((sum, c) => sum + computeValue(c), 0);
  return node.value;
}
computeValue(TREE);

// Fixed neutral grey for the root/total band -- unlike `t.ink`, this stays
// pixel-identical across light and dark renders, so every data band
// (including root) is theme-stable, not just the top-level branches.
const ROOT_FILL = "#6B6A63";

// Each top-level directory owns one Imprint hue; every descendant inherits
// its ancestor's hue so a branch stays recognizable at any depth (the
// spec's "color by hierarchy level or category" note).
function assignBranch(node, color) {
  node.branchColor = color;
  node.children?.forEach((c) => assignBranch(c, color));
}
assignBranch(TREE, ROOT_FILL); // root itself reads as the neutral/total anchor
TREE.children.forEach((dir, i) => assignBranch(dir, t.palette[i % t.palette.length]));

// --- Icicle (partition) layout: each depth is a full-width horizontal band;
// within a band, a node's horizontal span is proportional to its value
// within its parent's span. Root at top, children stacked below -- the
// spec's "horizontal orientation, root at top" note. ------------------------
function partition(node, x0, x1, depth) {
  node.x0 = x0;
  node.x1 = x1;
  node.depth = depth;
  if (!node.children) return;
  let cx = x0;
  const total = node.value;
  node.children.forEach((child) => {
    const w = total > 0 ? (child.value / total) * (x1 - x0) : 0;
    partition(child, cx, cx + w, depth + 1);
    cx += w;
  });
}

function flatten(node, acc) {
  acc.push(node);
  node.children?.forEach((c) => flatten(c, acc));
  return acc;
}

const DEPTH_COUNT = 4; // root, directory, subdirectory, file
const TINT_STEP = 0.28; // lighter per depth level below the branch's directory

// --- Color: contrast-aware text over an arbitrary tinted fill, same
// relative-luminance technique used for every other custom-drawn anyplot
// chart so labels stay legible regardless of hue or tint. -------------------
function hexToRgb(hex) {
  const n = parseInt(hex.slice(1), 16);
  return [(n >> 16) & 255, (n >> 8) & 255, n & 255];
}
function rgbToHsl(r, g, b) {
  r /= 255;
  g /= 255;
  b /= 255;
  const max = Math.max(r, g, b);
  const min = Math.min(r, g, b);
  const l = (max + min) / 2;
  if (max === min) return [0, 0, l];
  const d = max - min;
  const s = l > 0.5 ? d / (2 - max - min) : d / (max + min);
  let h;
  if (max === r) h = (g - b) / d + (g < b ? 6 : 0);
  else if (max === g) h = (b - r) / d + 2;
  else h = (r - g) / d + 4;
  return [h / 6, s, l];
}
function hueToRgb(p, q, tIn) {
  let tt = tIn;
  if (tt < 0) tt += 1;
  if (tt > 1) tt -= 1;
  if (tt < 1 / 6) return p + (q - p) * 6 * tt;
  if (tt < 1 / 2) return q;
  if (tt < 2 / 3) return p + (q - p) * (2 / 3 - tt) * 6;
  return p;
}
function hslToRgb(h, s, l) {
  if (s === 0) {
    const v = Math.round(l * 255);
    return [v, v, v];
  }
  const q = l < 0.5 ? l * (1 + s) : l + s - l * s;
  const p = 2 * l - q;
  return [Math.round(hueToRgb(p, q, h + 1 / 3) * 255), Math.round(hueToRgb(p, q, h) * 255), Math.round(hueToRgb(p, q, h - 1 / 3) * 255)];
}
function tintRgb(hex, factor) {
  const [r, g, b] = hexToRgb(hex);
  const [h, s, l] = rgbToHsl(r, g, b);
  return hslToRgb(h, s, l + (0.94 - l) * factor);
}
function relLuminanceRgb([r, g, b]) {
  const srgb = [r, g, b].map((v) => v / 255).map((v) => (v <= 0.03928 ? v / 12.92 : Math.pow((v + 0.055) / 1.055, 2.4)));
  return 0.2126 * srgb[0] + 0.7152 * srgb[1] + 0.0722 * srgb[2];
}
// Fixed, theme-independent ink/paper pair -- the data fills themselves don't
// change between themes, so the contrast decision must depend only on the
// fill's own luminance, never on `t.ink`/`t.pageBg` (which flip meaning
// between light and dark theme and previously produced near-invisible text
// on the leaf-level tints in dark mode).
const FIXED_DARK_TEXT = "#1A1A17";
const FIXED_LIGHT_TEXT = "#FFFDF6";
function textColorForRgb(rgb) {
  return relLuminanceRgb(rgb) > 0.45 ? FIXED_DARK_TEXT : FIXED_LIGHT_TEXT;
}

// --- Sizing + label fitting -------------------------------------------------
const MARGIN = { top: 96, right: 24, bottom: 20, left: 24 };
const ROW_GUTTER = 5;
const COL_GUTTER = 2;
const LABEL_FONT_SIZE = [22, 17, 15, 13]; // by depth -- 15/13 for the two deepest levels (was 14/12) so labels hold up better at mobile thumbnail scale
const CHAR_WIDTH_RATIO = 0.56;

function fmtKB(v) {
  return `${v.toLocaleString()} KB`;
}
function fitsLabel(w, h, text, fontSize) {
  return w - 10 >= text.length * fontSize * CHAR_WIDTH_RATIO && h >= fontSize + 4;
}

function IcicleRect({ x, y, w, h, fill, textFill, label, sublabel, fontSize, tooltip }) {
  const showLabel = label && fitsLabel(w, h, label, fontSize);
  const showSub = showLabel && sublabel && h >= fontSize * 2 + 8 && fitsLabel(w, h, sublabel, fontSize - 2);
  return (
    <g>
      <rect x={x} y={y} width={w} height={h} fill={fill} stroke={t.pageBg} strokeWidth={1.5}>
        <title>{tooltip}</title>
      </rect>
      {showLabel && (
        <text x={x + 7} y={y + fontSize + 3} fontSize={fontSize} fontWeight={showSub ? 600 : 500} fill={textFill} pointerEvents="none">
          {label}
        </text>
      )}
      {showSub && (
        <text x={x + 7} y={y + fontSize * 2 + 4} fontSize={fontSize - 2} fill={textFill} opacity={0.85} pointerEvents="none">
          {sublabel}
        </text>
      )}
    </g>
  );
}

function Icicle() {
  // Drawing area comes from MUI X's own DrawingProvider (via ChartContainer's
  // `margin` prop), the documented composition primitive for a custom mark --
  // MUI X community has no native Icicle/partition chart type.
  const { left, top, width, height } = useDrawingArea();
  partition(TREE, left, left + width, 0);
  const nodes = flatten(TREE, []);
  const rowH = height / DEPTH_COUNT;

  return (
    <g>
      {nodes.map((node) => {
        const x = node.x0 + COL_GUTTER / 2;
        const w = Math.max(0, node.x1 - node.x0 - COL_GUTTER);
        const y = top + node.depth * rowH + ROW_GUTTER / 2;
        const h = rowH - ROW_GUTTER;
        const fontSize = LABEL_FONT_SIZE[node.depth];

        if (node.depth === 0) {
          return (
            <IcicleRect
              key="root"
              x={x}
              y={y}
              w={w}
              h={h}
              fill={ROOT_FILL}
              textFill={textColorForRgb(hexToRgb(ROOT_FILL))}
              label={`${node.name} · ${fmtKB(node.value)} total`}
              fontSize={fontSize}
              tooltip={`${node.name}: ${fmtKB(node.value)}`}
            />
          );
        }

        const tintFactor = (node.depth - 1) * TINT_STEP;
        const rgb = tintRgb(node.branchColor, tintFactor);
        const fill = `rgb(${rgb[0]}, ${rgb[1]}, ${rgb[2]})`;
        const parentValue = findParentValue(TREE, node);
        const pct = parentValue > 0 ? ((node.value / parentValue) * 100).toFixed(0) : "0";
        return (
          <IcicleRect
            key={`${node.depth}-${node.name}-${node.x0.toFixed(1)}`}
            x={x}
            y={y}
            w={w}
            h={h}
            fill={fill}
            textFill={textColorForRgb(rgb)}
            label={node.name}
            sublabel={fmtKB(node.value)}
            fontSize={fontSize}
            tooltip={`${node.name}: ${fmtKB(node.value)} (${pct}% of parent)`}
          />
        );
      })}
    </g>
  );
}

// Walks the tree to find `target`'s parent value, used for the "% of parent"
// tooltip -- flatten() discards parent links, so this is the cheap way back.
function findParentValue(node, target) {
  if (!node.children) return node.value;
  if (node.children.includes(target)) return node.value;
  for (const c of node.children) {
    const found = findParentValue(c, target);
    if (found !== undefined) return found;
  }
  return undefined;
}

// --- Chart (default-exported component -- the harness mounts it) ----------
// ChartContainer supplies the <ChartsSurface> SVG root and theme context; its
// `margin` prop drives the DrawingProvider that Icicle() reads back via
// useDrawingArea(), so the title/plot split uses MUI X's own layout system
// rather than a parallel hand-rolled offset. The bands themselves are laid
// out in absolute pixel space via partition() above, so no axis/scale is
// needed -- xAxis/yAxis are omitted entirely.
export default function Chart() {
  const { width, height } = window.ANYPLOT_SIZE;

  return (
    <ChartContainer width={width} height={height} series={[]} margin={MARGIN} skipAnimation>
      <text x={width / 2} y={40} textAnchor="middle" fontSize={titleFontSize} fontWeight={600} fill={t.ink}>
        {title}
      </text>
      <text x={width / 2} y={68} textAnchor="middle" fontSize={15} fill={t.inkSoft}>
        Repository file sizes by directory depth · width ∝ size (KB)
      </text>
      <Icicle />
    </ChartContainer>
  );
}
Runnable source as JSON, for any HTTP client: https://api.anyplot.ai/specs/icicle-basic/muix/code. Any spec id and library id listed in llms-full.txt fit the same URL shape; every URL below is complete and callable.
{
  "spec_id": "icicle-basic",
  "language": "javascript",
  "library": "muix",
  "page": "https://anyplot.ai/icicle-basic/javascript/muix",
  "hub": "https://anyplot.ai/icicle-basic",
  "code_json": "https://api.anyplot.ai/specs/icicle-basic/muix/code",
  "spec_json": "https://api.anyplot.ai/specs/icicle-basic",
  "render_light_png": "https://storage.googleapis.com/anyplot-images/plots/icicle-basic/javascript/muix/plot-light.png",
  "render_dark_png": "https://storage.googleapis.com/anyplot-images/plots/icicle-basic/javascript/muix/plot-dark.png",
  "interactive_light_html": "https://storage.googleapis.com/anyplot-images/plots/icicle-basic/javascript/muix/plot-light.html",
  "interactive_dark_html": "https://storage.googleapis.com/anyplot-images/plots/icicle-basic/javascript/muix/plot-dark.html",
  "quality_score": 86.0,
  "license": "MIT",
  "guide": "https://anyplot.ai/llms.txt"
}
Part of Basic Icicle Chart on anyplot.ai.