The same plot in 14 other libraries — JavaScript: D3.js, Apache ECharts, Highcharts, MUI X Charts; Python: Altair, Bokeh, lets-plot, Matplotlib, Plotly, plotnine, Pygal, Seaborn; R: ggplot2; Julia: Makie.jl. Compare all 15 side by side: Basic Icicle Chart in Python, R, Julia and JavaScript.
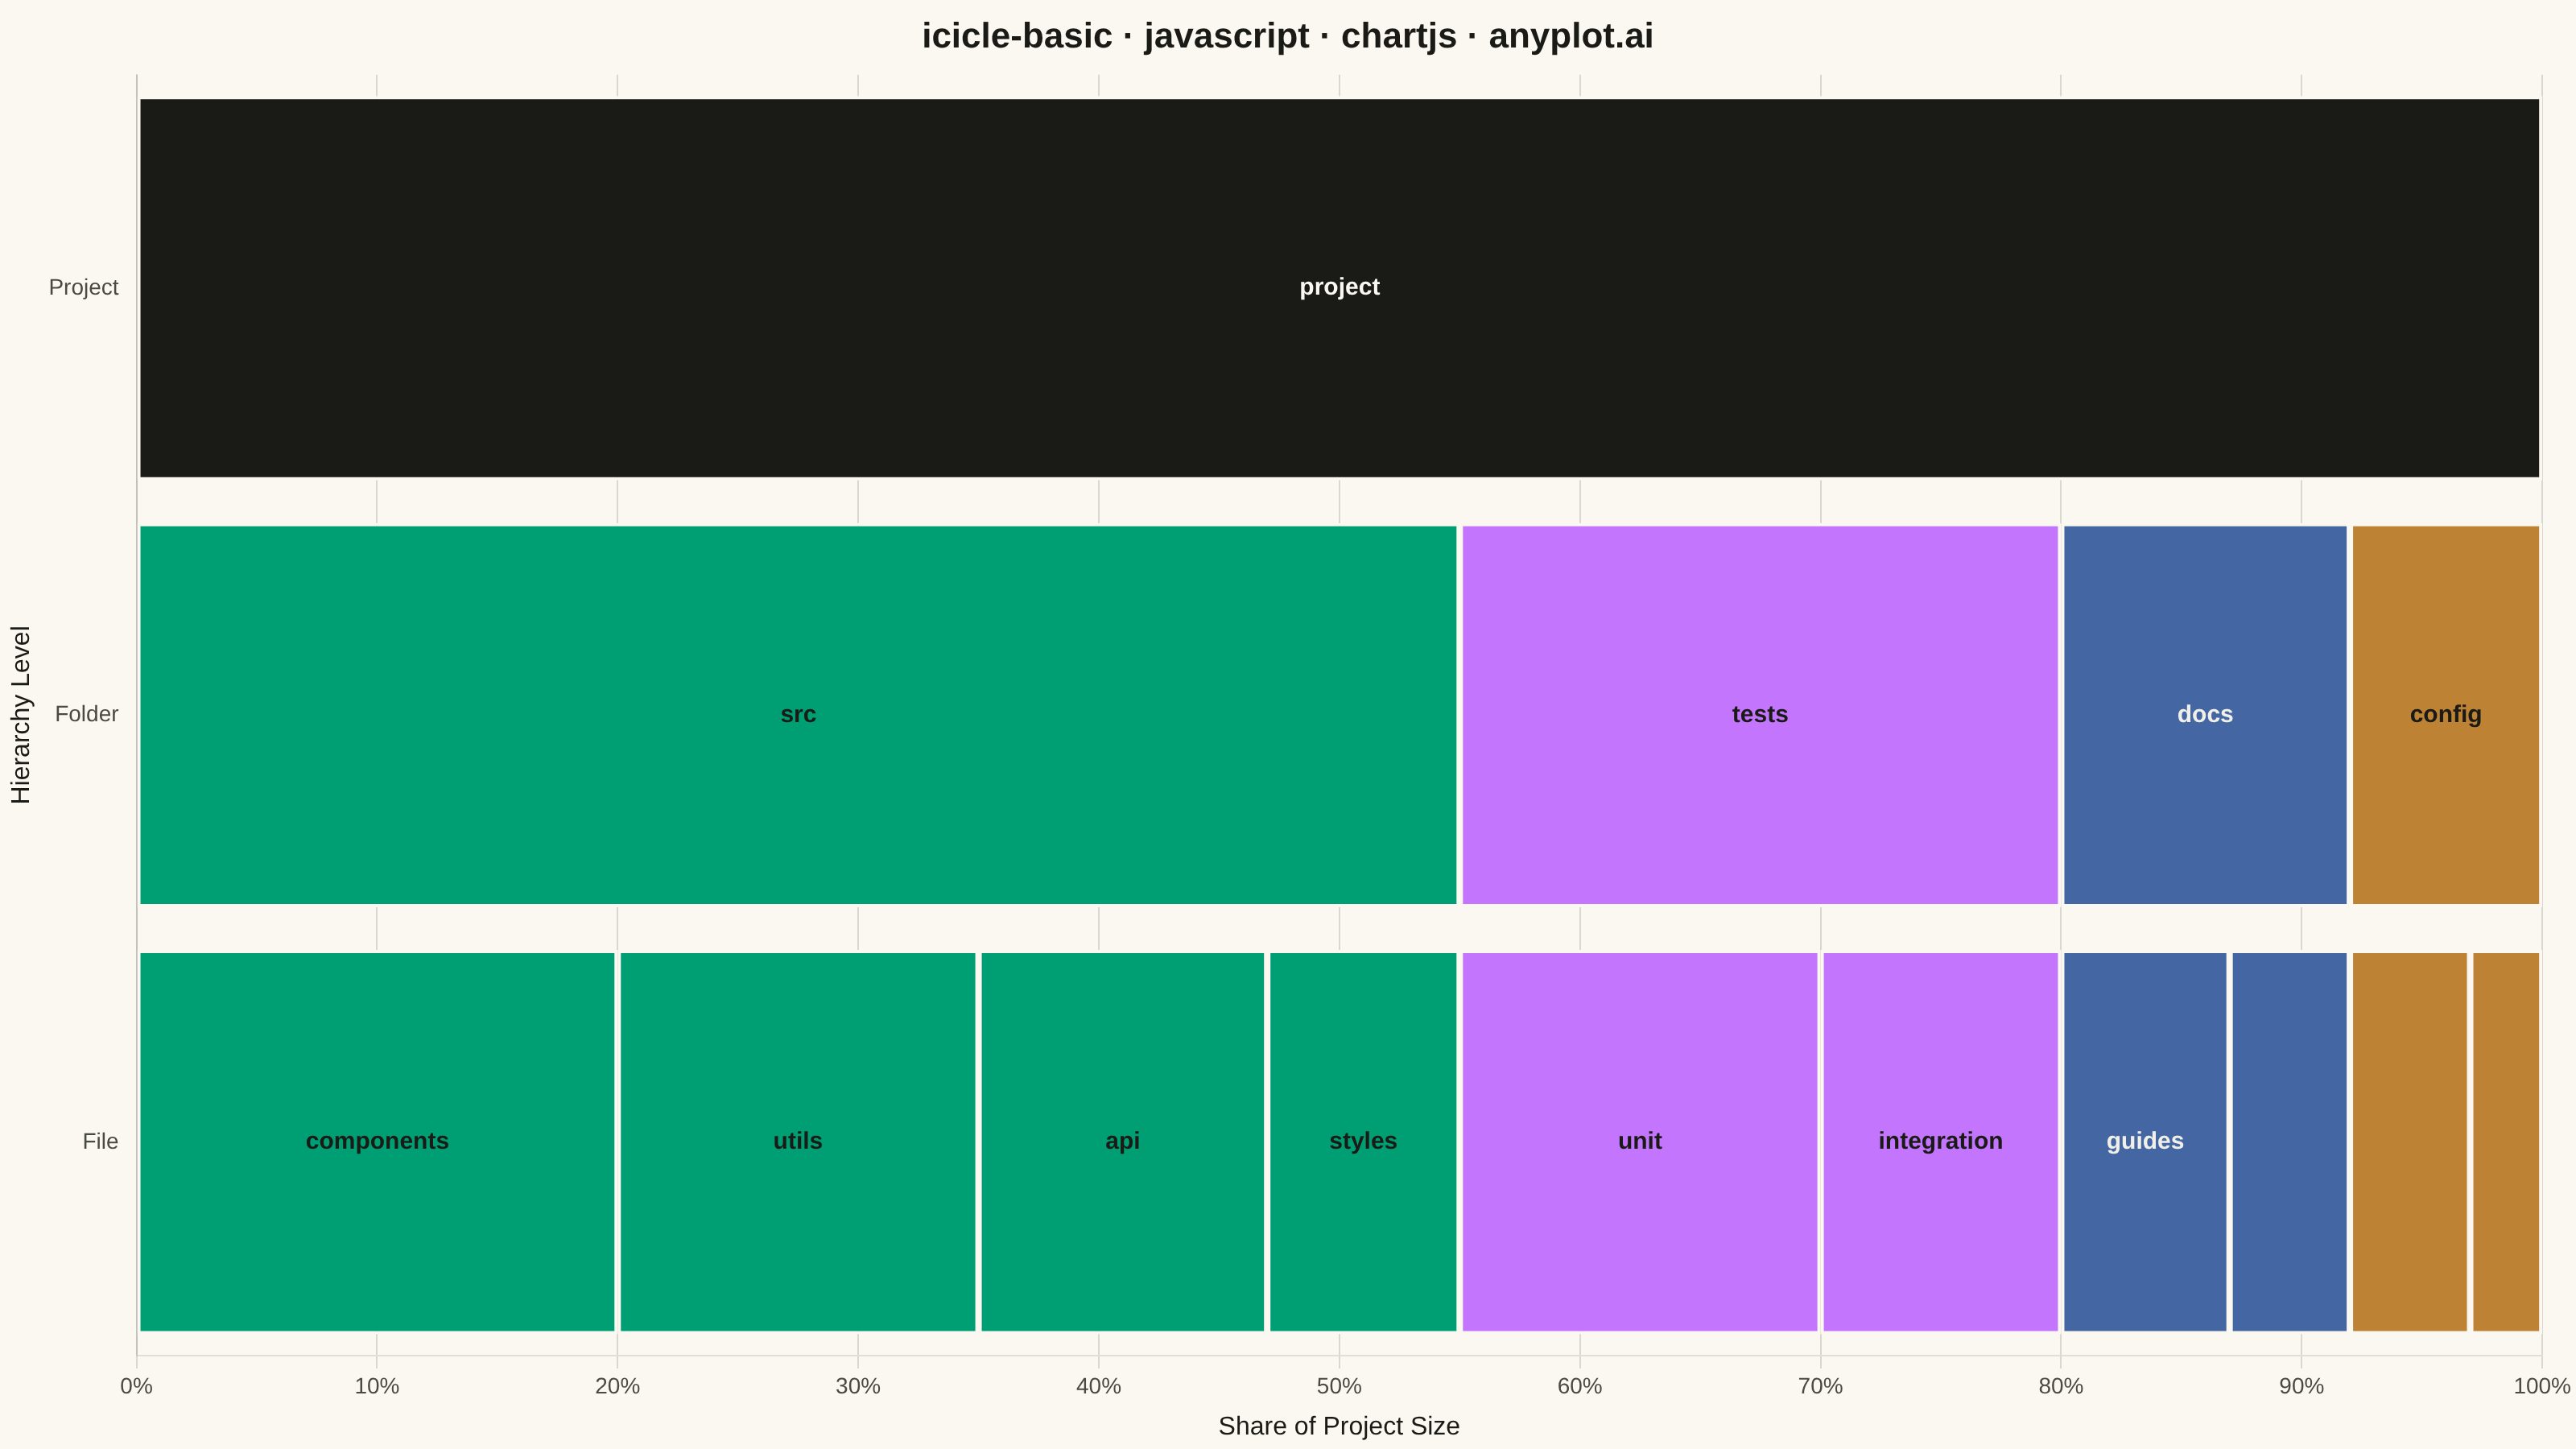
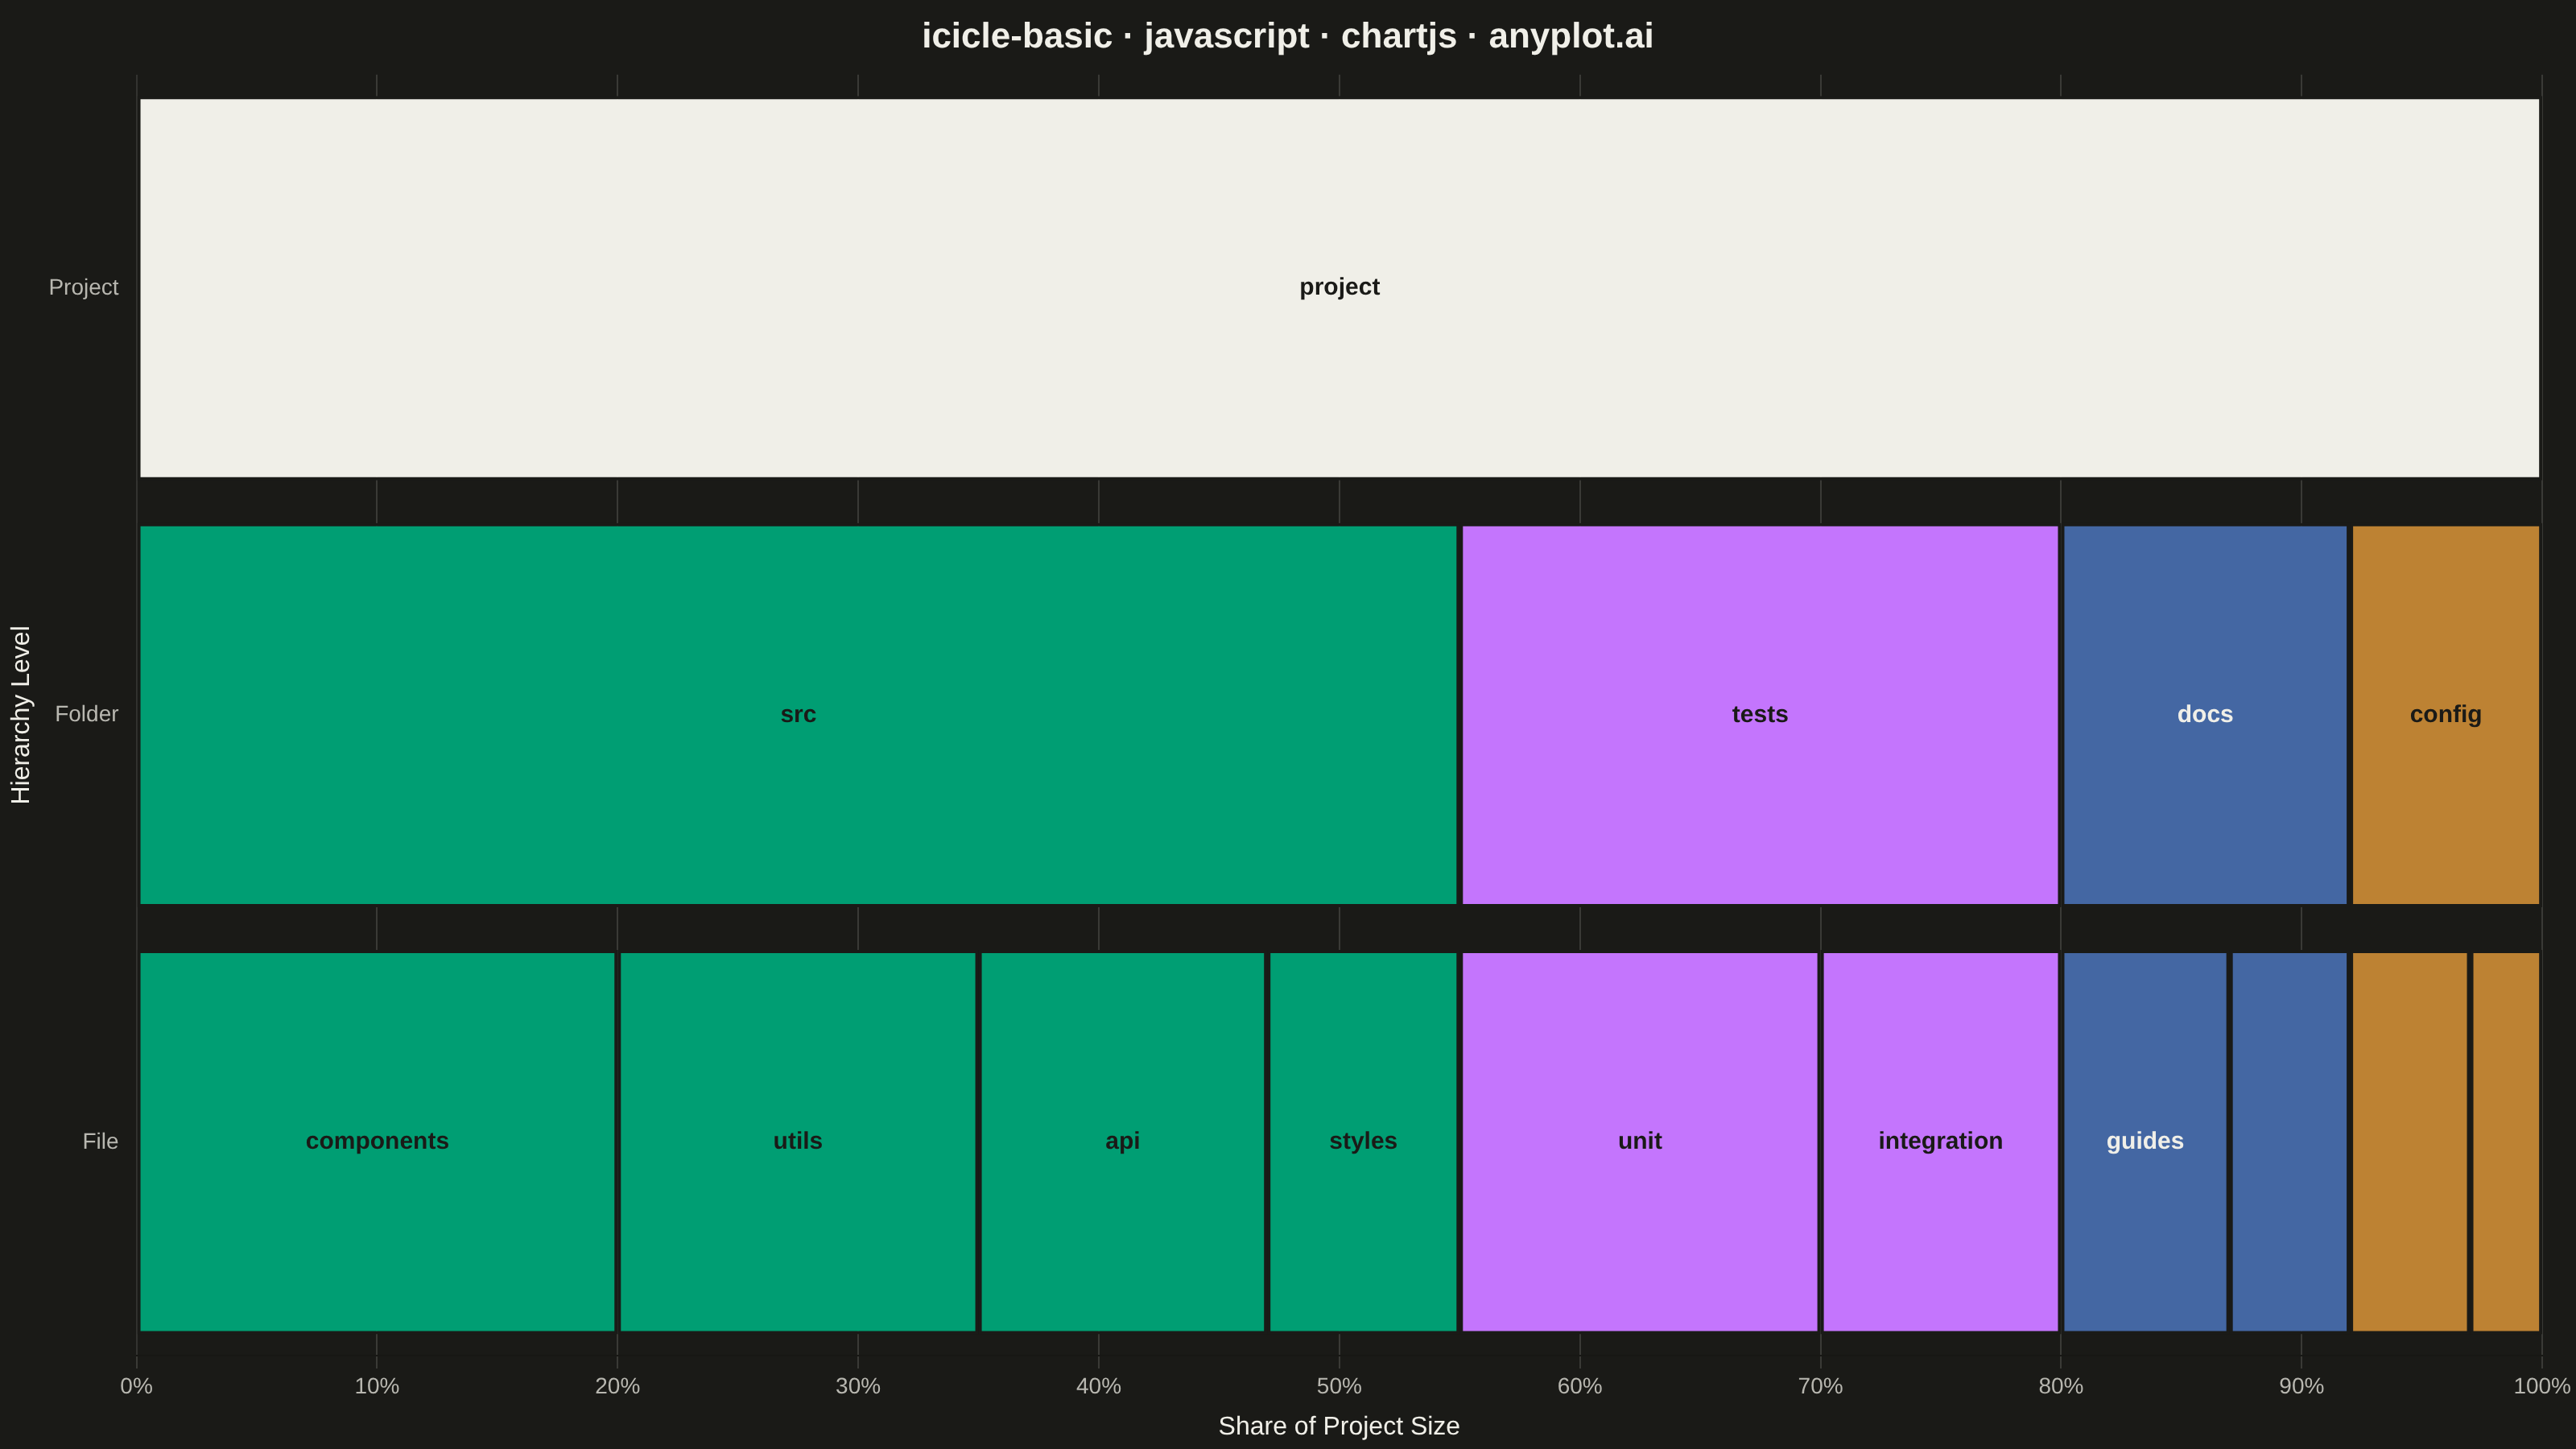
An icicle chart displaying hierarchical data as adjacent rectangles in a layered structure, where each rectangle's size represents its value in the hierarchy. Unlike treemaps that nest rectangles, icicle charts stack them in rows (horizontal) or columns (vertical), making parent-child relationships explicitly visible through spatial adjacency. This layout excels at showing both the hierarchy levels and the proportional values simultaneously.
// anyplot.ai
// icicle-basic: Basic Icicle Chart
// Library: chartjs 4.4.7 | JavaScript 22.23.2
// Quality: 94/100 | Created: 2026-09-05

const t = window.ANYPLOT_TOKENS;

// --- Data (in-memory, deterministic) ---------------------------------------
// File system hierarchy: project -> folders -> files, value = size (KB).
const nodes = [
  { name: "project", parent: null, value: 100, level: 0 },
  { name: "src", parent: "project", value: 55, level: 1 },
  { name: "tests", parent: "project", value: 25, level: 1 },
  { name: "docs", parent: "project", value: 12, level: 1 },
  { name: "config", parent: "project", value: 8, level: 1 },
  { name: "components", parent: "src", value: 20, level: 2 },
  { name: "utils", parent: "src", value: 15, level: 2 },
  { name: "api", parent: "src", value: 12, level: 2 },
  { name: "styles", parent: "src", value: 8, level: 2 },
  { name: "unit", parent: "tests", value: 15, level: 2 },
  { name: "integration", parent: "tests", value: 10, level: 2 },
  { name: "guides", parent: "docs", value: 7, level: 2 },
  { name: "reference", parent: "docs", value: 5, level: 2 },
  { name: "webpack", parent: "config", value: 5, level: 2 },
  { name: "eslint", parent: "config", value: 3, level: 2 },
];

// Partition layout: give each node a horizontal span [x0, x1] within its
// parent's span, proportional to value (same idea as d3's partition layout).
const byParent = new Map();
for (const node of nodes) {
  if (!byParent.has(node.parent)) byParent.set(node.parent, []);
  byParent.get(node.parent).push(node);
}
const root = nodes.find((node) => node.parent === null);
root.x0 = 0;
root.x1 = 100;
const queue = [root];
while (queue.length) {
  const parent = queue.shift();
  const children = byParent.get(parent.name) || [];
  const total = children.reduce((sum, child) => sum + child.value, 0);
  let cursor = parent.x0;
  for (const child of children) {
    const width = (child.value / total) * (parent.x1 - parent.x0);
    child.x0 = cursor;
    child.x1 = cursor + width;
    cursor += width;
    queue.push(child);
  }
}

// Color by top-level branch (root = neutral, each folder its own hue, files
// inherit their folder's hue) so the hierarchy groups visually.
const branchColor = new Map([
  ["src", t.palette[0]],
  ["tests", t.palette[1]],
  ["docs", t.palette[2]],
  ["config", t.palette[3]],
]);
const colorByName = new Map(nodes.map((node) => [node.name, null]));
for (const node of nodes) {
  if (node.level === 0) colorByName.set(node.name, t.ink);
  else if (node.level === 1) colorByName.set(node.name, branchColor.get(node.name));
  else colorByName.set(node.name, colorByName.get(node.parent));
}

const rowLabels = ["Project", "Folder", "File"];

// --- Label contrast: pick ink-dark or ink-light text per rectangle fill -----
// (root uses the theme-adaptive ink/pageBg swap directly; branch/file rows use
// this since their fill colors are fixed across themes, so the readable text
// color must be picked per-color rather than swapped by theme.)
function relativeLuminance(r, g, b) {
  const lin = (c) => {
    const s = c / 255;
    return s <= 0.03928 ? s / 12.92 : Math.pow((s + 0.055) / 1.055, 2.4);
  };
  return 0.2126 * lin(r) + 0.7152 * lin(g) + 0.0722 * lin(b);
}
function contrastRatio(l1, l2) {
  const lighter = Math.max(l1, l2);
  const darker = Math.min(l1, l2);
  return (lighter + 0.05) / (darker + 0.05);
}
function labelColorFor(hex) {
  const n = parseInt(hex.slice(1), 16);
  const luminance = relativeLuminance((n >> 16) & 255, (n >> 8) & 255, n & 255);
  const darkContrast = contrastRatio(luminance, relativeLuminance(0x1a, 0x1a, 0x17));
  const lightContrast = contrastRatio(luminance, relativeLuminance(0xf0, 0xef, 0xe8));
  return darkContrast >= lightContrast ? "#1A1A17" : "#F0EFE8";
}
const labelColorByName = new Map(
  nodes.map((node) => [
    node.name,
    node.level === 0 ? t.pageBg : labelColorFor(colorByName.get(node.name)),
  ]),
);

// --- Mount -------------------------------------------------------------------
const canvas = document.createElement("canvas");
document.getElementById("container").appendChild(canvas);

// --- Label plugin (draws node names onto rectangles with enough room) -------
const rectLabelPlugin = {
  id: "icicleRectLabels",
  afterDatasetsDraw(chart) {
    const { ctx } = chart;
    ctx.save();
    ctx.font = `600 15px ${Chart.defaults.font.family}`;
    ctx.textAlign = "center";
    ctx.textBaseline = "middle";
    nodes.forEach((node, i) => {
      const meta = chart.getDatasetMeta(i);
      const el = meta.data[node.level];
      if (!el) return;
      const { x, base, y } = el.getProps(["x", "base", "y"], true);
      const rectWidth = Math.abs(x - base);
      const textWidth = ctx.measureText(node.name).width;
      if (rectWidth < textWidth + 16) return;
      ctx.fillStyle = labelColorByName.get(node.name);
      ctx.fillText(node.name, (x + base) / 2, y);
    });
    ctx.restore();
  },
};

// --- Chart -------------------------------------------------------------------
new Chart(canvas, {
  type: "bar",
  data: {
    labels: rowLabels,
    datasets: nodes.map((node) => ({
      label: node.name,
      data: rowLabels.map((_, i) => (i === node.level ? [node.x0, node.x1] : null)),
      backgroundColor: colorByName.get(node.name),
      borderColor: t.pageBg,
      borderWidth: 2,
      borderSkipped: false,
      grouped: false,
      barPercentage: 1,
      categoryPercentage: 0.9,
    })),
  },
  options: {
    indexAxis: "y",
    responsive: true,
    maintainAspectRatio: false,
    animation: false,
    plugins: {
      title: {
        display: true,
        text: "icicle-basic · javascript · chartjs · anyplot.ai",
        color: t.ink,
        font: { size: 22 },
      },
      legend: { display: false },
      tooltip: { enabled: false },
    },
    scales: {
      x: {
        min: 0,
        max: 100,
        ticks: { color: t.inkSoft, font: { size: 14 }, callback: (v) => `${v}%` },
        grid: { color: t.grid },
        title: { display: true, text: "Share of Project Size", color: t.ink, font: { size: 16 } },
      },
      y: {
        ticks: { color: t.inkSoft, font: { size: 14 } },
        grid: { display: false },
        title: { display: true, text: "Hierarchy Level", color: t.ink, font: { size: 16 } },
      },
    },
  },
  plugins: [rectLabelPlugin],
});
Runnable source as JSON, for any HTTP client: https://api.anyplot.ai/specs/icicle-basic/chartjs/code. Any spec id and library id listed in llms-full.txt fit the same URL shape; every URL below is complete and callable.
{
  "spec_id": "icicle-basic",
  "language": "javascript",
  "library": "chartjs",
  "page": "https://anyplot.ai/icicle-basic/javascript/chartjs",
  "hub": "https://anyplot.ai/icicle-basic",
  "code_json": "https://api.anyplot.ai/specs/icicle-basic/chartjs/code",
  "spec_json": "https://api.anyplot.ai/specs/icicle-basic",
  "render_light_png": "https://storage.googleapis.com/anyplot-images/plots/icicle-basic/javascript/chartjs/plot-light.png",
  "render_dark_png": "https://storage.googleapis.com/anyplot-images/plots/icicle-basic/javascript/chartjs/plot-dark.png",
  "interactive_light_html": "https://storage.googleapis.com/anyplot-images/plots/icicle-basic/javascript/chartjs/plot-light.html",
  "interactive_dark_html": "https://storage.googleapis.com/anyplot-images/plots/icicle-basic/javascript/chartjs/plot-dark.html",
  "quality_score": 94.0,
  "license": "MIT",
  "guide": "https://anyplot.ai/llms.txt"
}
Part of Basic Icicle Chart on anyplot.ai.