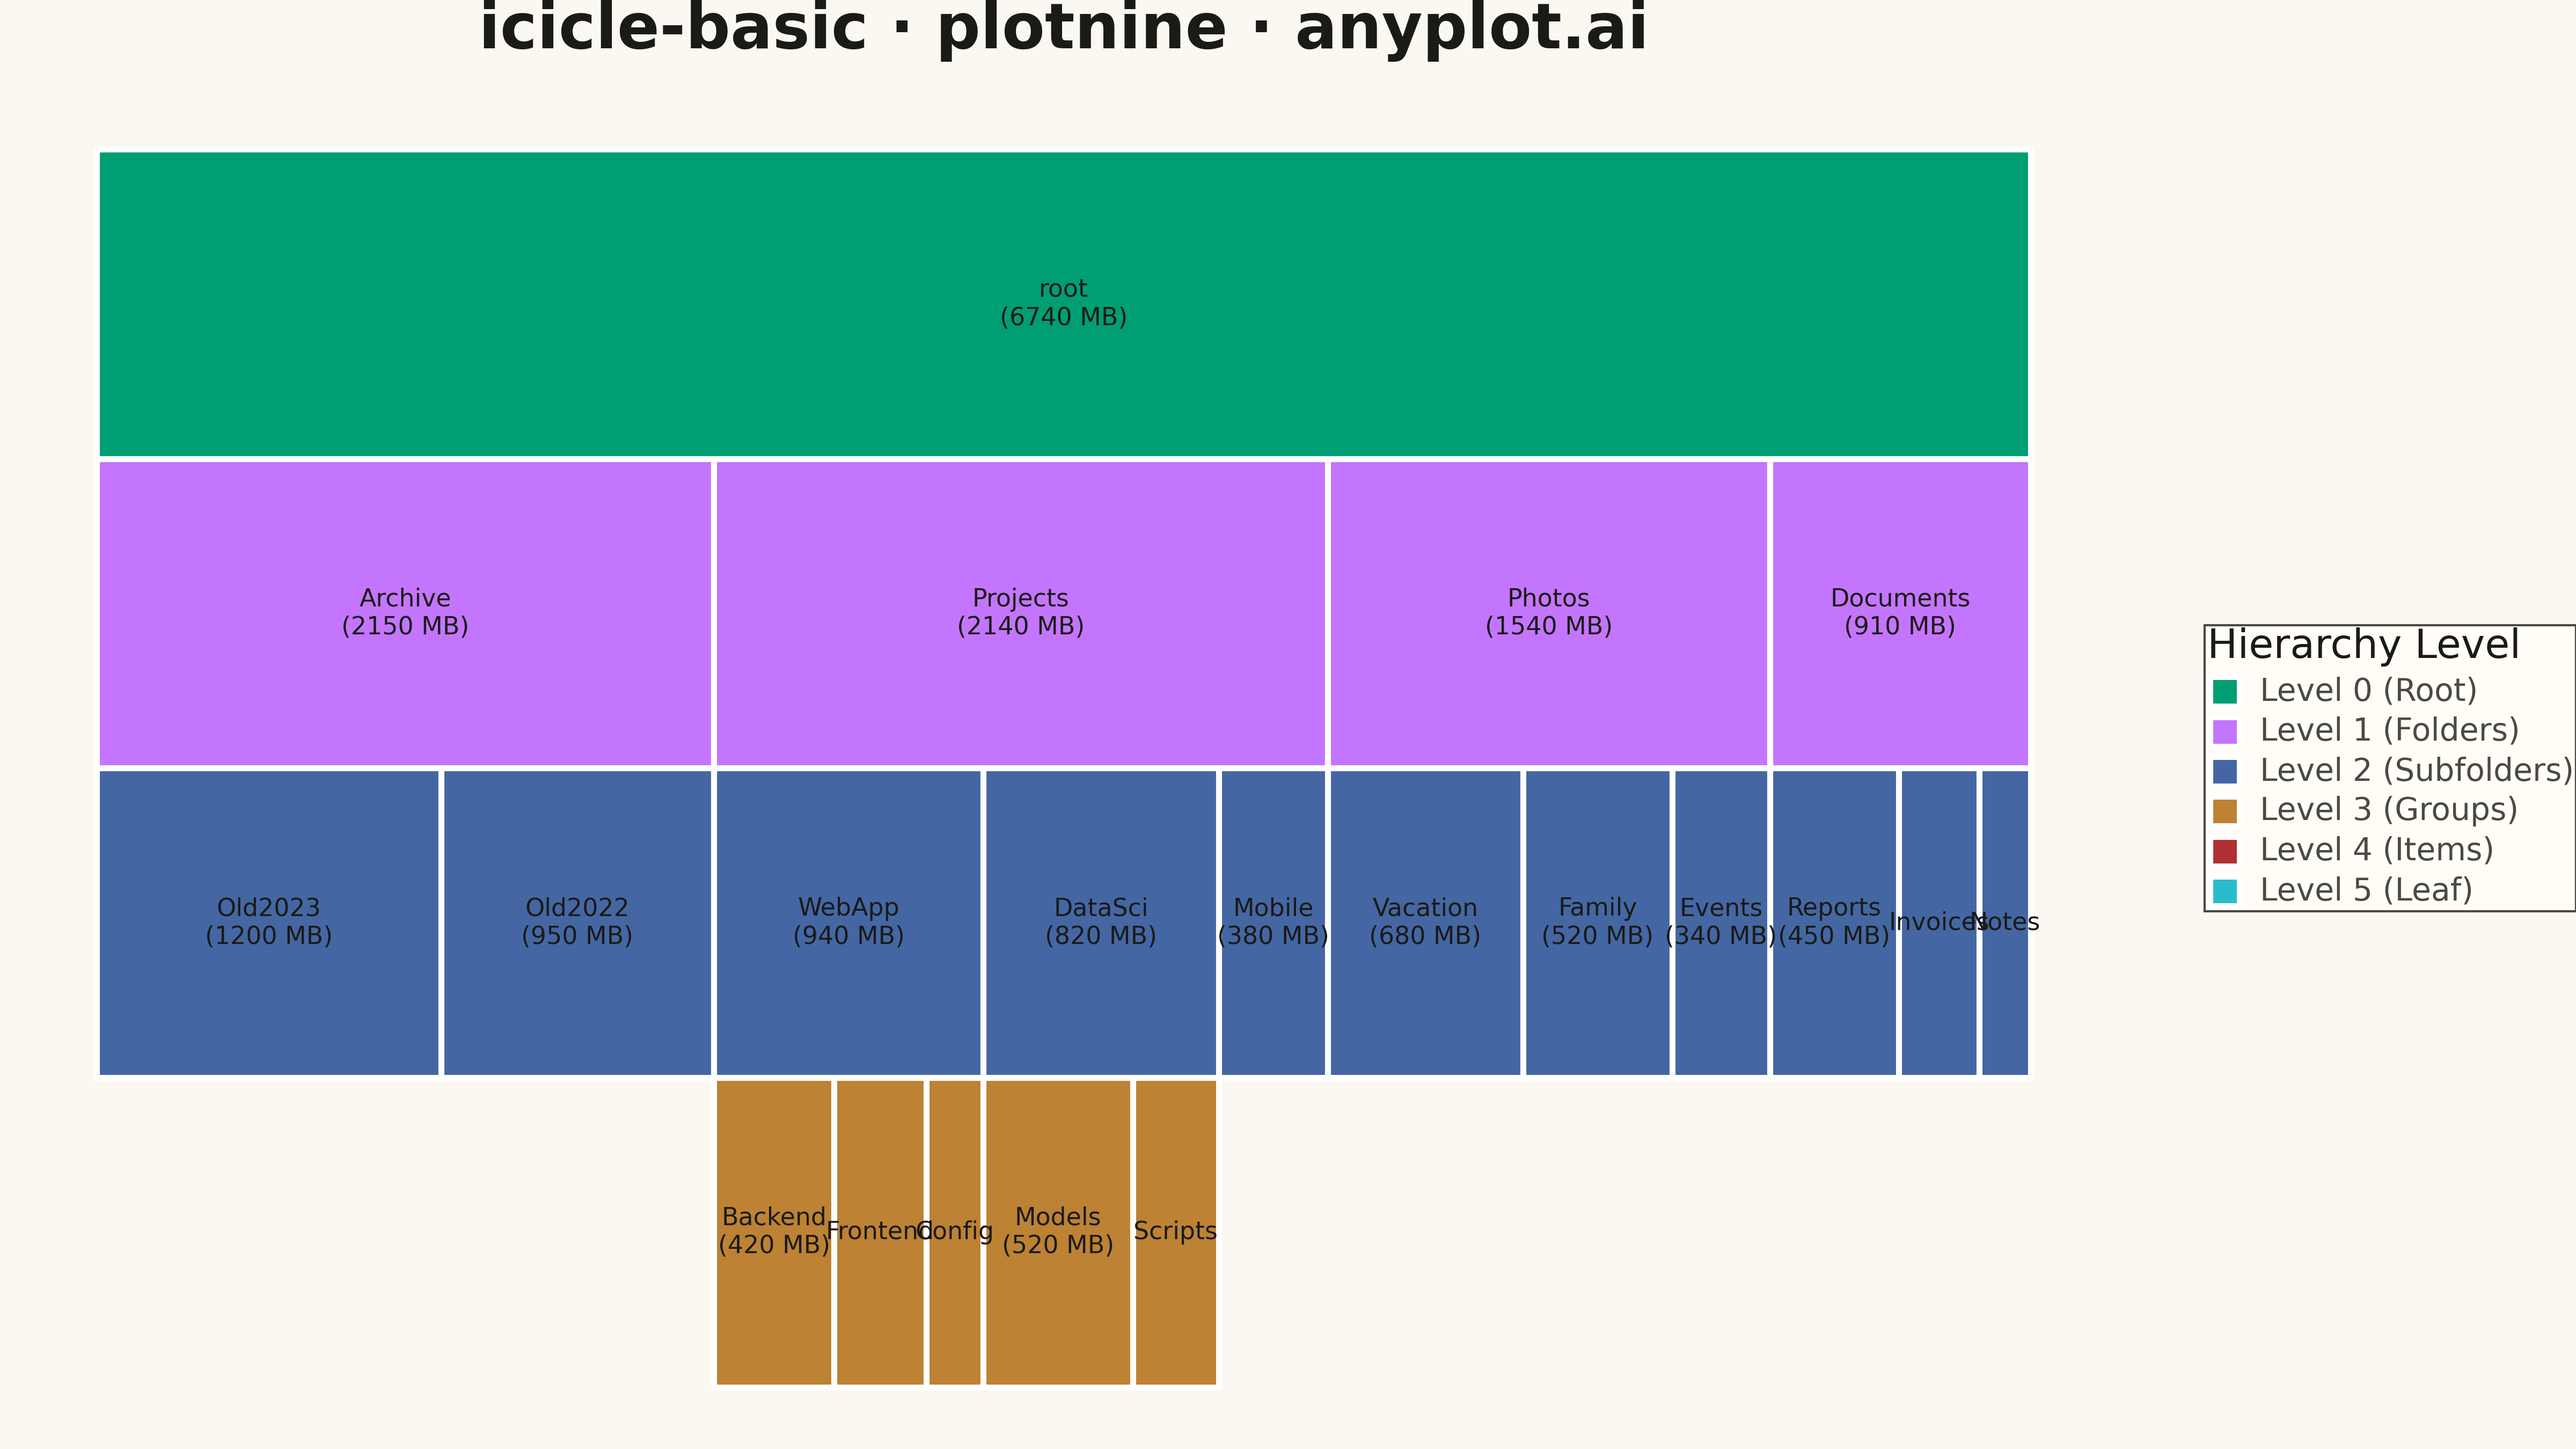
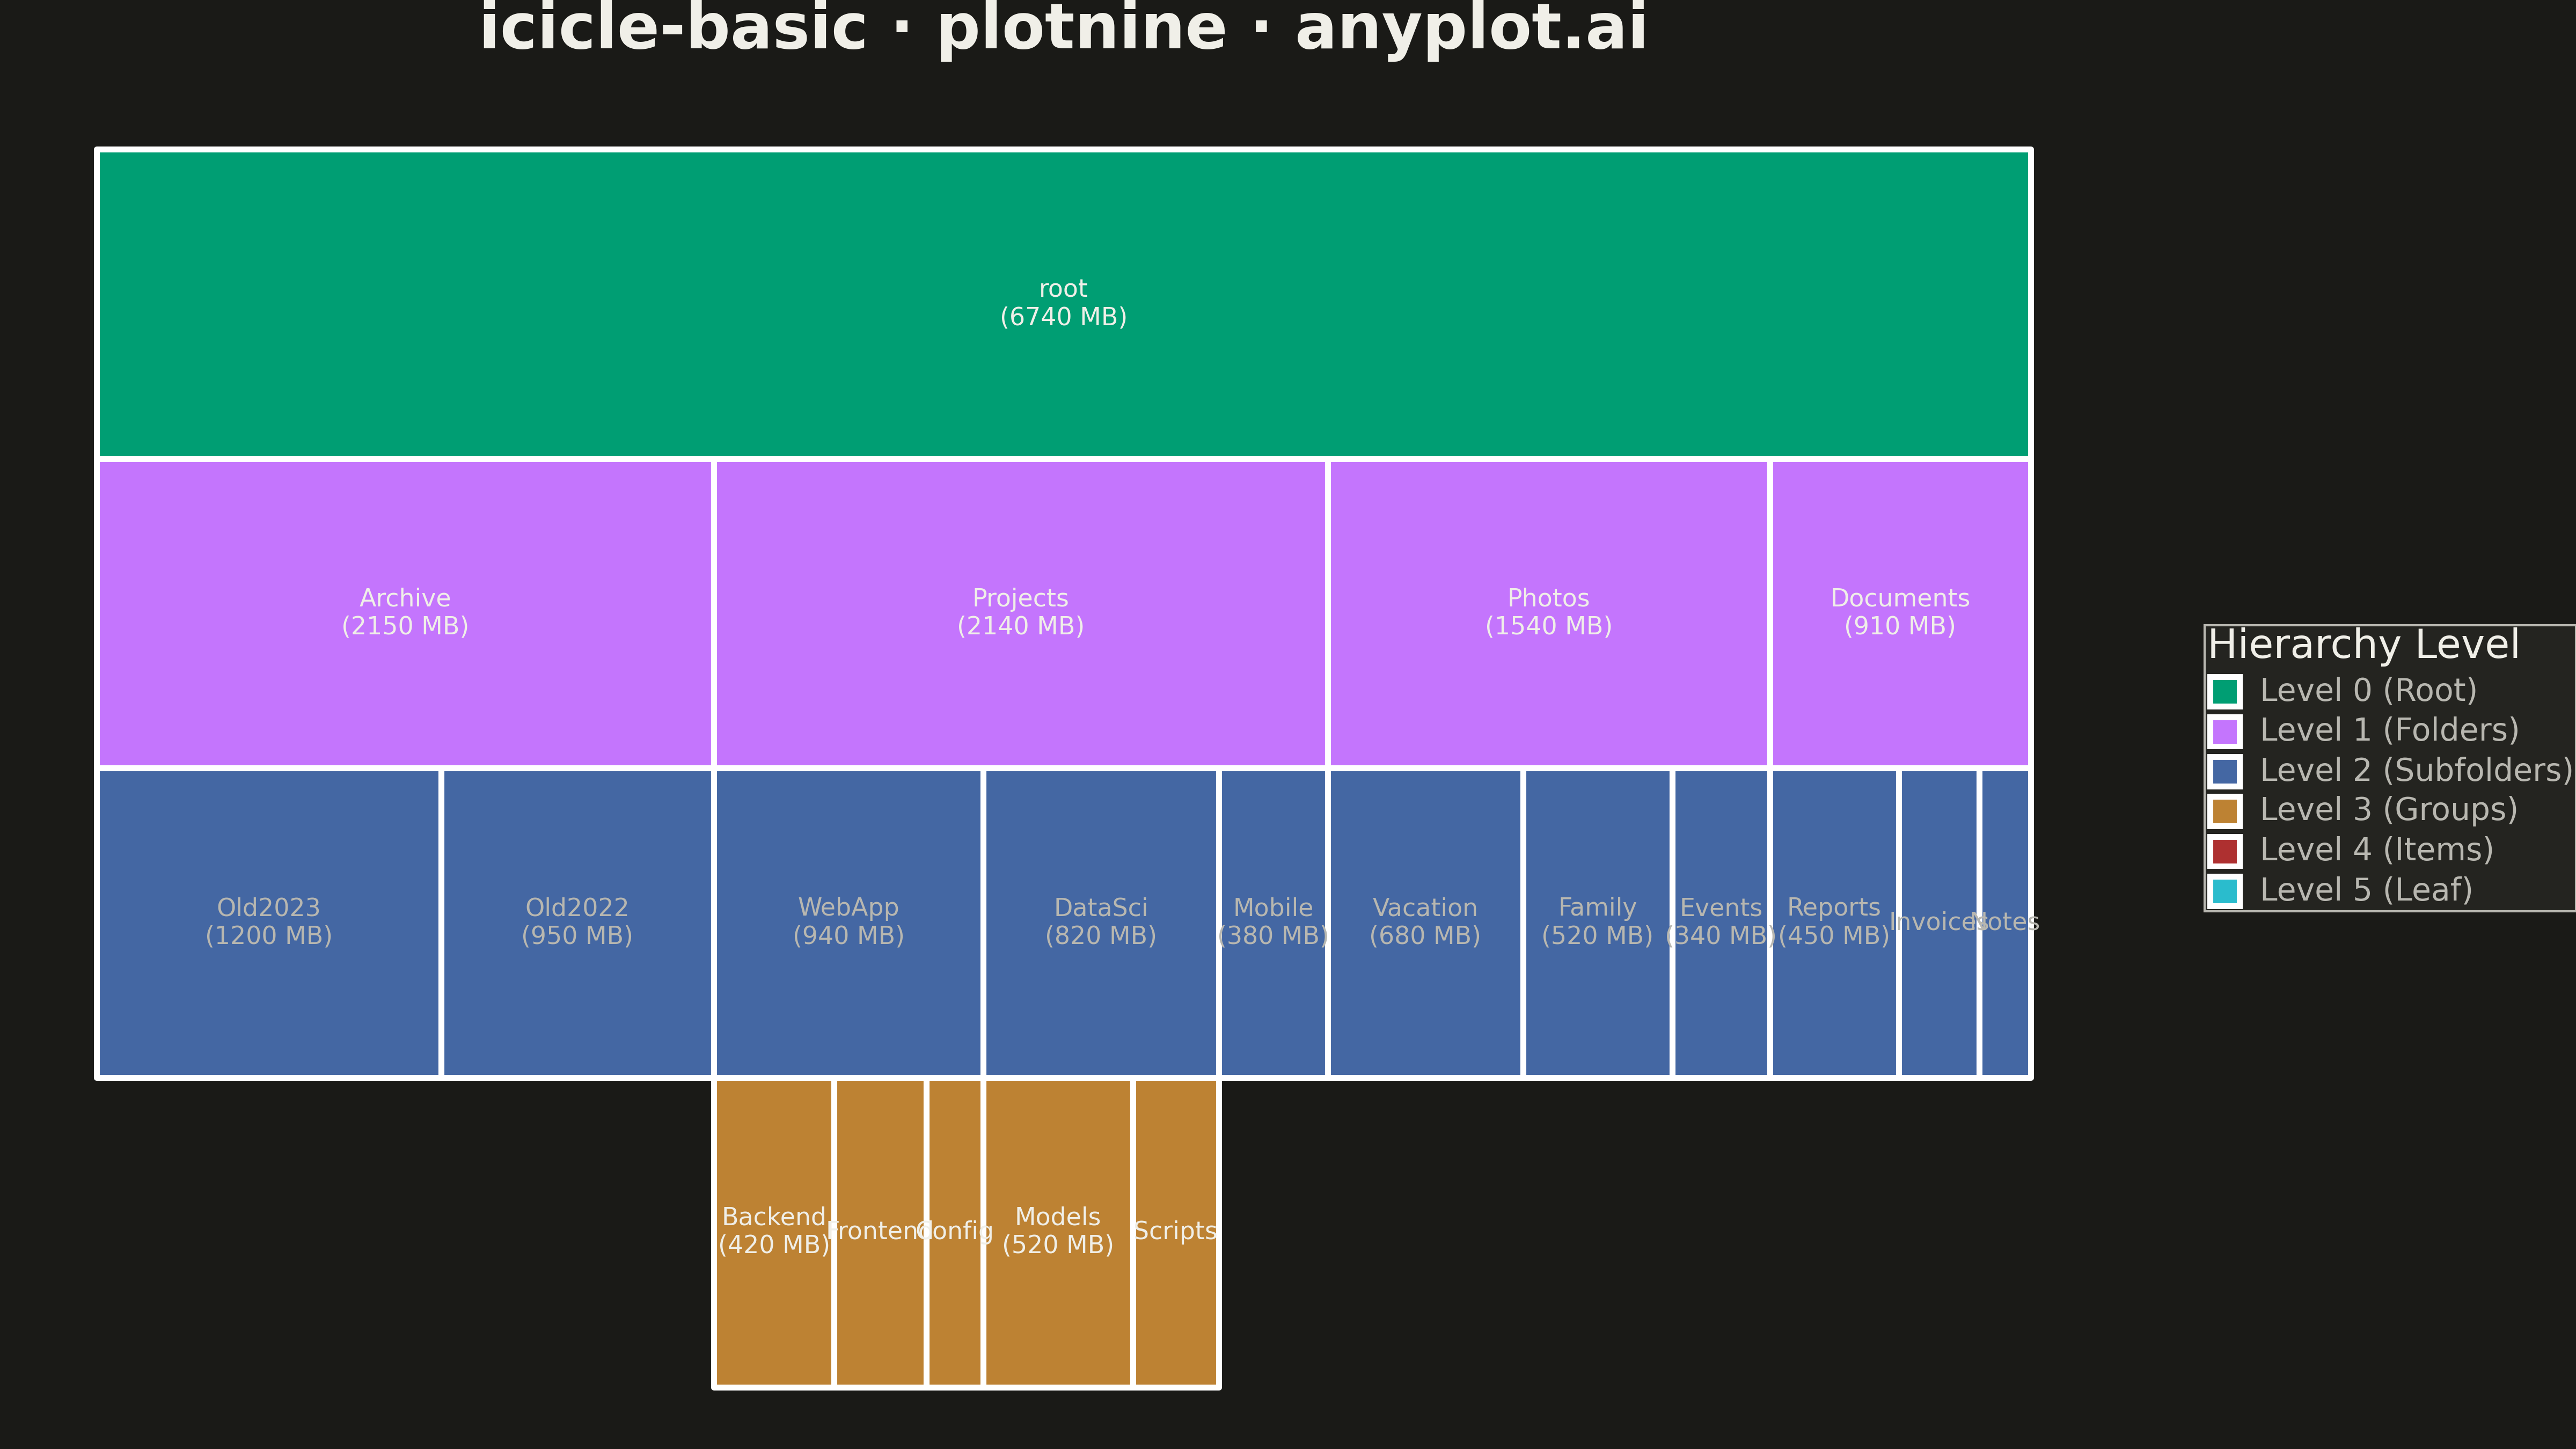
An icicle chart displaying hierarchical data as adjacent rectangles in a layered structure, where each rectangle's size represents its value in the hierarchy. Unlike treemaps that nest rectangles, icicle charts stack them in rows (horizontal) or columns (vertical), making parent-child relationships explicitly visible through spatial adjacency. This layout excels at showing both the hierarchy levels and the proportional values simultaneously.
""" anyplot.ai
icicle-basic: Basic Icicle Chart
Library: plotnine 0.15.4 | Python 3.13.13
Quality: 92/100 | Updated: 2026-05-13
"""

import os

import pandas as pd
from plotnine import (
    aes,
    element_rect,
    element_text,
    geom_rect,
    geom_text,
    ggplot,
    labs,
    scale_fill_manual,
    theme,
    theme_void,
)


# Theme tokens
THEME = os.getenv("ANYPLOT_THEME", "light")
PAGE_BG = "#FAF8F1" if THEME == "light" else "#1A1A17"
ELEVATED_BG = "#FFFDF6" if THEME == "light" else "#242420"
INK = "#1A1A17" if THEME == "light" else "#F0EFE8"
INK_SOFT = "#4A4A44" if THEME == "light" else "#B8B7B0"

# Okabe-Ito palette for hierarchy levels
IMPRINT = ["#009E73", "#C475FD", "#4467A3", "#BD8233", "#AE3030", "#2ABCCD"]

# Data: File system hierarchy with sizes (MB)
data = [
    {"name": "root", "parent": "", "value": 0},
    {"name": "Documents", "parent": "root", "value": 0},
    {"name": "Photos", "parent": "root", "value": 0},
    {"name": "Projects", "parent": "root", "value": 0},
    {"name": "Archive", "parent": "root", "value": 0},
    {"name": "Reports", "parent": "Documents", "value": 450},
    {"name": "Invoices", "parent": "Documents", "value": 280},
    {"name": "Notes", "parent": "Documents", "value": 180},
    {"name": "Vacation", "parent": "Photos", "value": 680},
    {"name": "Family", "parent": "Photos", "value": 520},
    {"name": "Events", "parent": "Photos", "value": 340},
    {"name": "WebApp", "parent": "Projects", "value": 0},
    {"name": "DataSci", "parent": "Projects", "value": 0},
    {"name": "Mobile", "parent": "Projects", "value": 380},
    {"name": "Frontend", "parent": "WebApp", "value": 320},
    {"name": "Backend", "parent": "WebApp", "value": 420},
    {"name": "Config", "parent": "WebApp", "value": 200},
    {"name": "Models", "parent": "DataSci", "value": 520},
    {"name": "Scripts", "parent": "DataSci", "value": 300},
    {"name": "Old2023", "parent": "Archive", "value": 1200},
    {"name": "Old2022", "parent": "Archive", "value": 950},
]

df = pd.DataFrame(data)

# Build lookup tables
name_to_idx = {row["name"]: idx for idx, row in df.iterrows()}
children_map = {name: df[df["parent"] == name]["name"].tolist() for name in df["name"]}

# Calculate values for non-leaf nodes (bottom-up aggregation)
processed = set()
while len(processed) < len(df):
    for _, row in df.iterrows():
        name = row["name"]
        if name in processed:
            continue
        kids = children_map[name]
        if len(kids) == 0:
            processed.add(name)
        elif all(k in processed for k in kids):
            total = sum(df.loc[name_to_idx[k], "value"] for k in kids)
            df.loc[name_to_idx[name], "value"] = total
            processed.add(name)

# Calculate depths (distance from root)
depths = {"root": 0}
queue = ["root"]
while queue:
    current = queue.pop(0)
    for child in children_map[current]:
        depths[child] = depths[current] + 1
        queue.append(child)

max_depth = max(depths.values())

# Build icicle rectangles using iterative BFS
rects = []
layout_queue = [("root", 0.0, 1.0)]

while layout_queue:
    name, x_start, x_end = layout_queue.pop(0)
    depth = depths[name]
    y_top = max_depth - depth + 1
    y_bottom = max_depth - depth
    value = df.loc[name_to_idx[name], "value"]

    rects.append(
        {"name": name, "xmin": x_start, "xmax": x_end, "ymin": y_bottom, "ymax": y_top, "depth": depth, "value": value}
    )

    # Queue children proportionally
    kids = children_map[name]
    if kids:
        kid_values = [(k, df.loc[name_to_idx[k], "value"]) for k in kids]
        kid_values.sort(key=lambda x: -x[1])
        total_value = sum(v for _, v in kid_values)
        if total_value > 0:
            curr_x = x_start
            for kid, val in kid_values:
                width = (val / total_value) * (x_end - x_start)
                layout_queue.append((kid, curr_x, curr_x + width))
                curr_x += width

rect_df = pd.DataFrame(rects)

# Color palette by depth using Okabe-Ito
colors = {0: IMPRINT[0], 1: IMPRINT[1], 2: IMPRINT[2], 3: IMPRINT[3], 4: IMPRINT[4], 5: IMPRINT[5]}
rect_df["fill_color"] = rect_df["depth"].map(colors)

# Calculate label positions and widths
rect_df["width"] = rect_df["xmax"] - rect_df["xmin"]
rect_df["x_center"] = (rect_df["xmin"] + rect_df["xmax"]) / 2
rect_df["y_center"] = (rect_df["ymin"] + rect_df["ymax"]) / 2

# Labels: show name + value for wide rectangles, name only for medium, hide for very narrow
rect_df["label"] = rect_df.apply(
    lambda r: f"{r['name']}\n({int(r['value'])} MB)" if r["width"] > 0.05 else (r["name"] if r["width"] > 0.02 else ""),
    axis=1,
)

# Convert depth to categorical with descriptive labels
level_labels = {
    0: "Level 0 (Root)",
    1: "Level 1 (Folders)",
    2: "Level 2 (Subfolders)",
    3: "Level 3 (Groups)",
    4: "Level 4 (Items)",
    5: "Level 5 (Leaf)",
}
rect_df["depth_label"] = pd.Categorical(
    rect_df["depth"].map(level_labels), categories=list(level_labels.values()), ordered=True
)

# Separate light and dark backgrounds for text color contrast
dark_bg = rect_df[rect_df["depth"].isin([0, 1, 3])]
light_bg = rect_df[rect_df["depth"].isin([2, 4, 5])]

# Create plot
plot = (
    ggplot(rect_df)
    + geom_rect(aes(xmin="xmin", xmax="xmax", ymin="ymin", ymax="ymax", fill="depth_label"), color="white", size=1.5)
    + geom_text(aes(x="x_center", y="y_center", label="label"), data=dark_bg, size=11, color=INK)
    + geom_text(
        aes(x="x_center", y="y_center", label="label"),
        data=light_bg,
        size=11,
        color=INK if THEME == "light" else INK_SOFT,
    )
    + scale_fill_manual(
        values={
            "Level 0 (Root)": IMPRINT[0],
            "Level 1 (Folders)": IMPRINT[1],
            "Level 2 (Subfolders)": IMPRINT[2],
            "Level 3 (Groups)": IMPRINT[3],
            "Level 4 (Items)": IMPRINT[4],
            "Level 5 (Leaf)": IMPRINT[5],
        },
        name="Hierarchy Level",
    )
    + labs(title="icicle-basic · plotnine · anyplot.ai")
    + theme_void()
    + theme(
        plot_background=element_rect(fill=PAGE_BG, color=PAGE_BG),
        panel_background=element_rect(fill=PAGE_BG),
        figure_size=(16, 9),
        plot_title=element_text(size=28, ha="center", weight="bold", color=INK),
        legend_position="right",
        legend_background=element_rect(fill=ELEVATED_BG, color=INK_SOFT),
        legend_title=element_text(size=18, color=INK),
        legend_text=element_text(size=14, color=INK_SOFT),
    )
)

# Save
plot.save(f"plot-{THEME}.png", dpi=300, verbose=False)
Runnable source as JSON, for any HTTP client: https://api.anyplot.ai/specs/icicle-basic/plotnine/code. Any spec id and library id listed in llms-full.txt fit the same URL shape; every URL below is complete and callable.
{
  "spec_id": "icicle-basic",
  "language": "python",
  "library": "plotnine",
  "page": "https://anyplot.ai/icicle-basic/python/plotnine",
  "hub": "https://anyplot.ai/icicle-basic",
  "code_json": "https://api.anyplot.ai/specs/icicle-basic/plotnine/code",
  "spec_json": "https://api.anyplot.ai/specs/icicle-basic",
  "render_light_png": "https://storage.googleapis.com/anyplot-images/plots/icicle-basic/python/plotnine/plot-light.png",
  "render_dark_png": "https://storage.googleapis.com/anyplot-images/plots/icicle-basic/python/plotnine/plot-dark.png",
  "quality_score": 92.0,
  "license": "MIT",
  "guide": "https://anyplot.ai/llms.txt"
}
Part of Basic Icicle Chart on anyplot.ai.