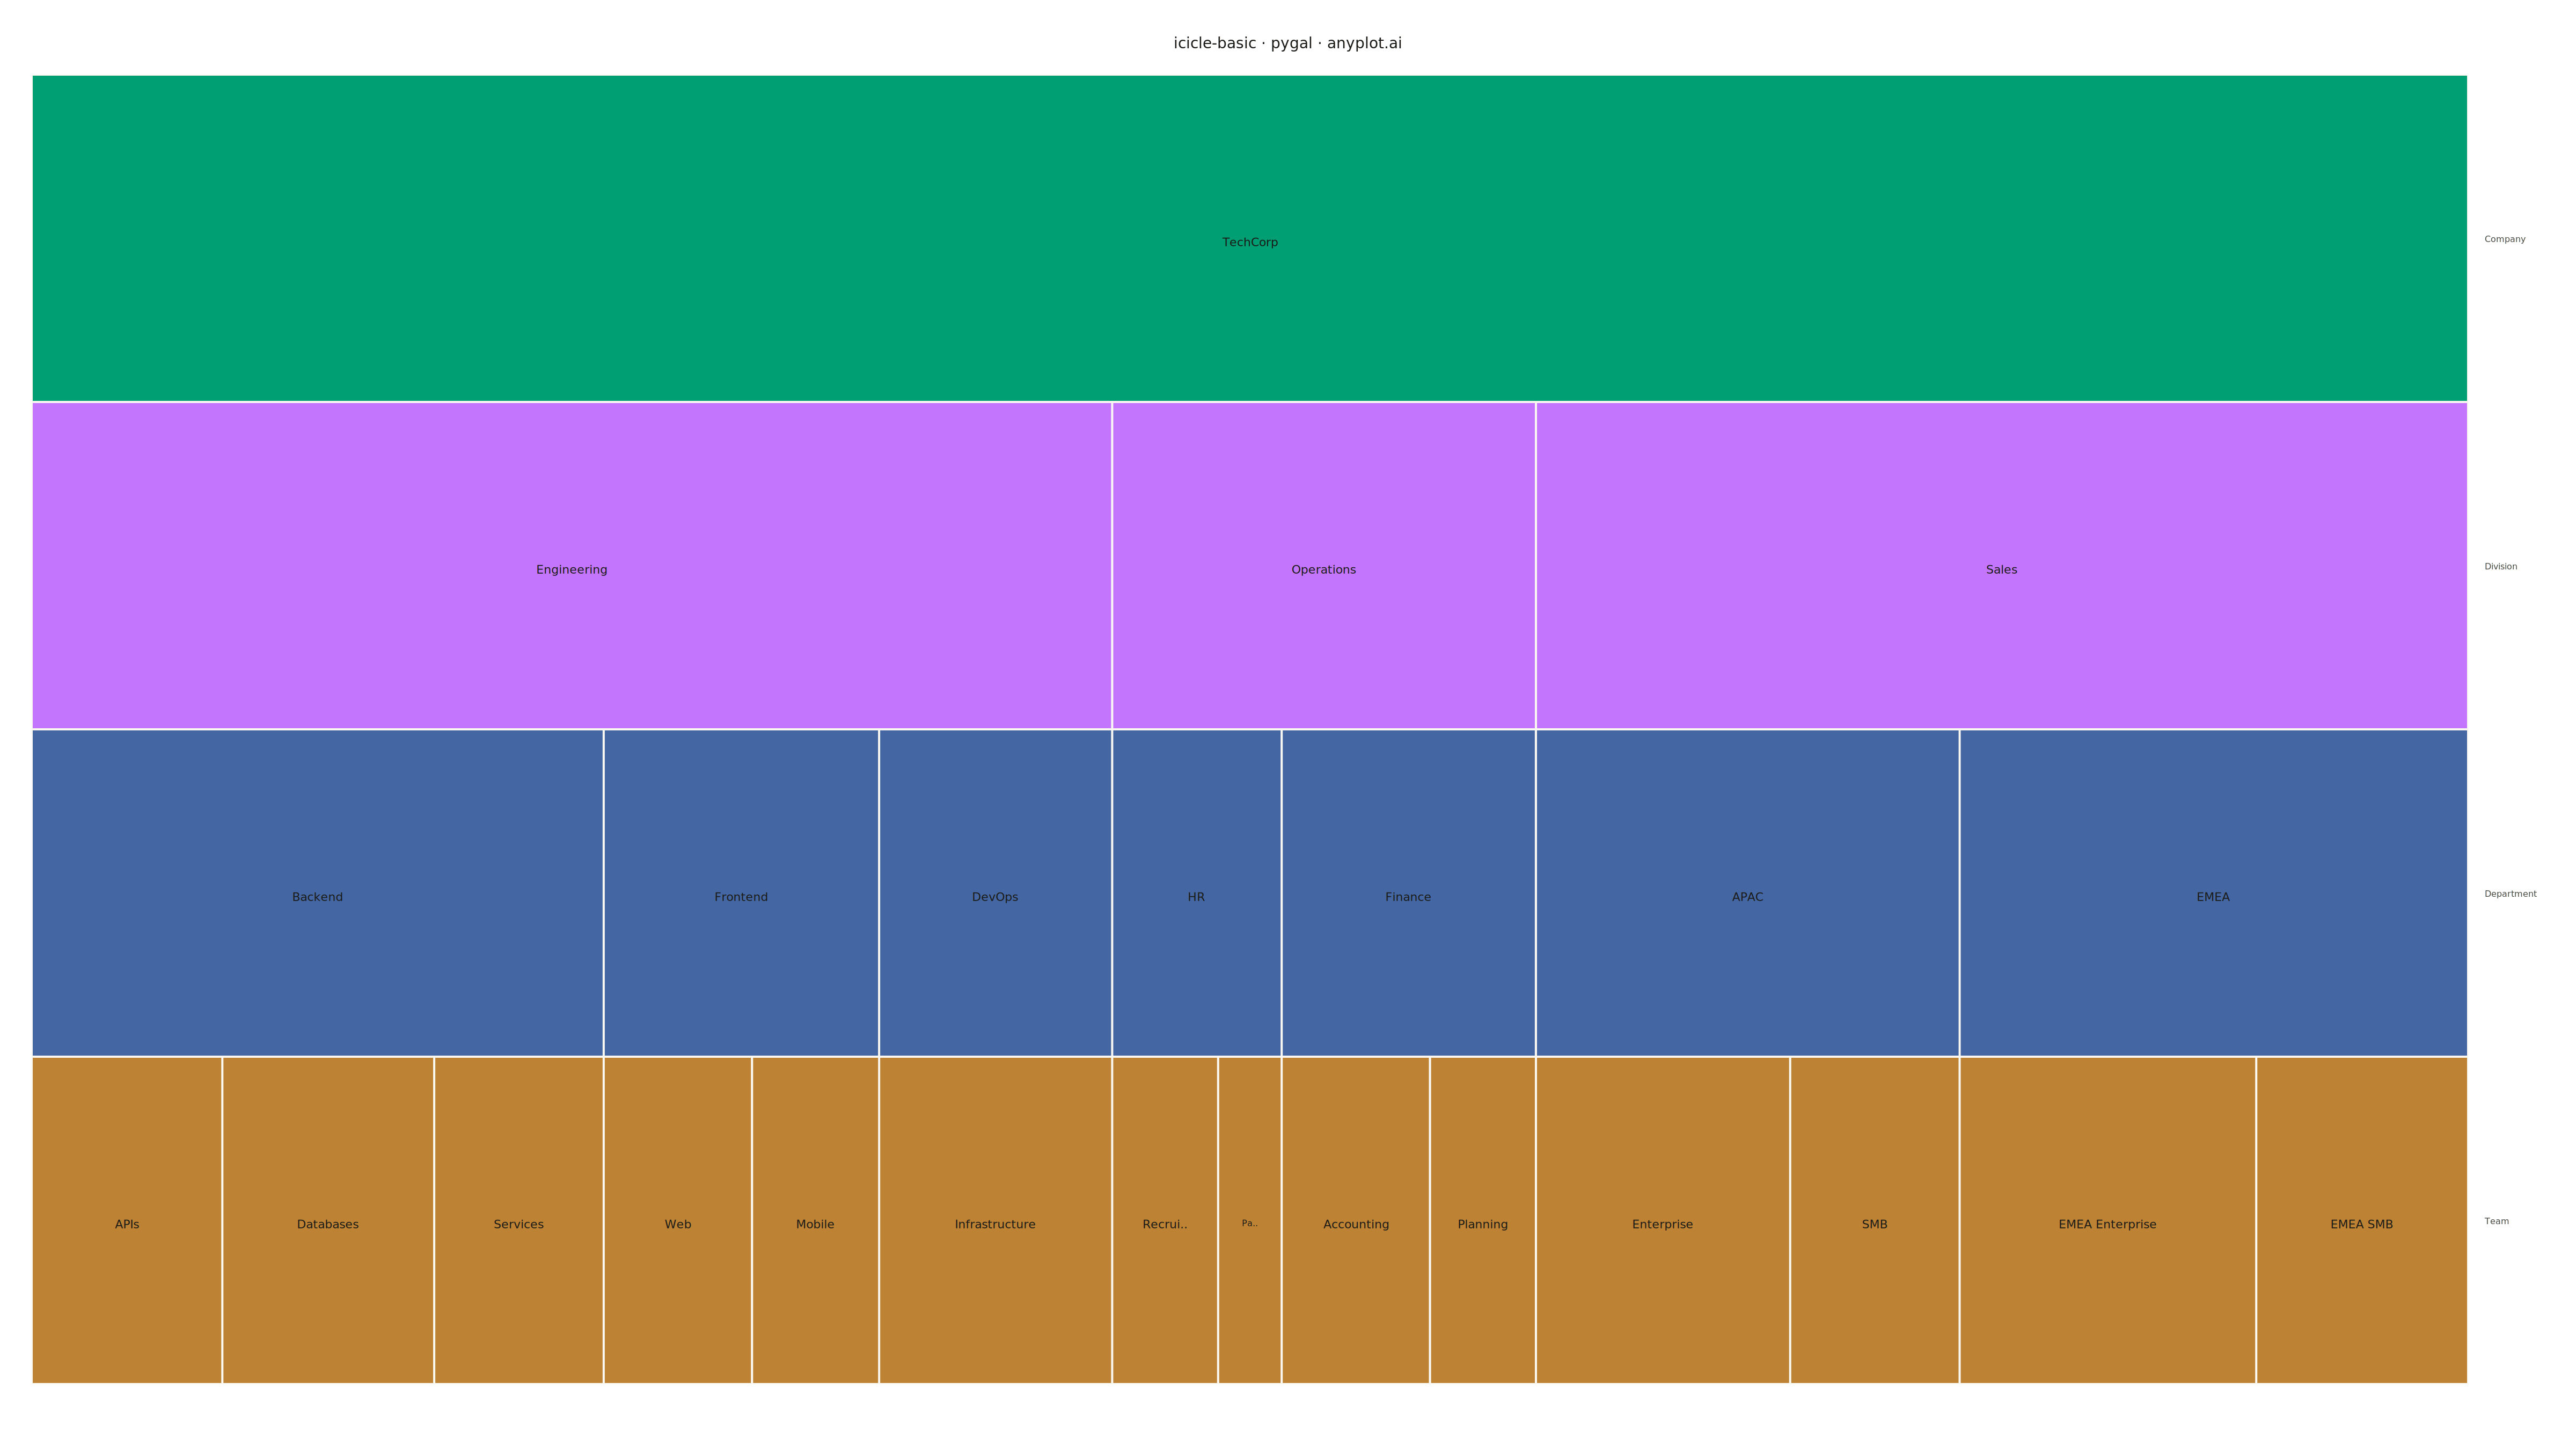
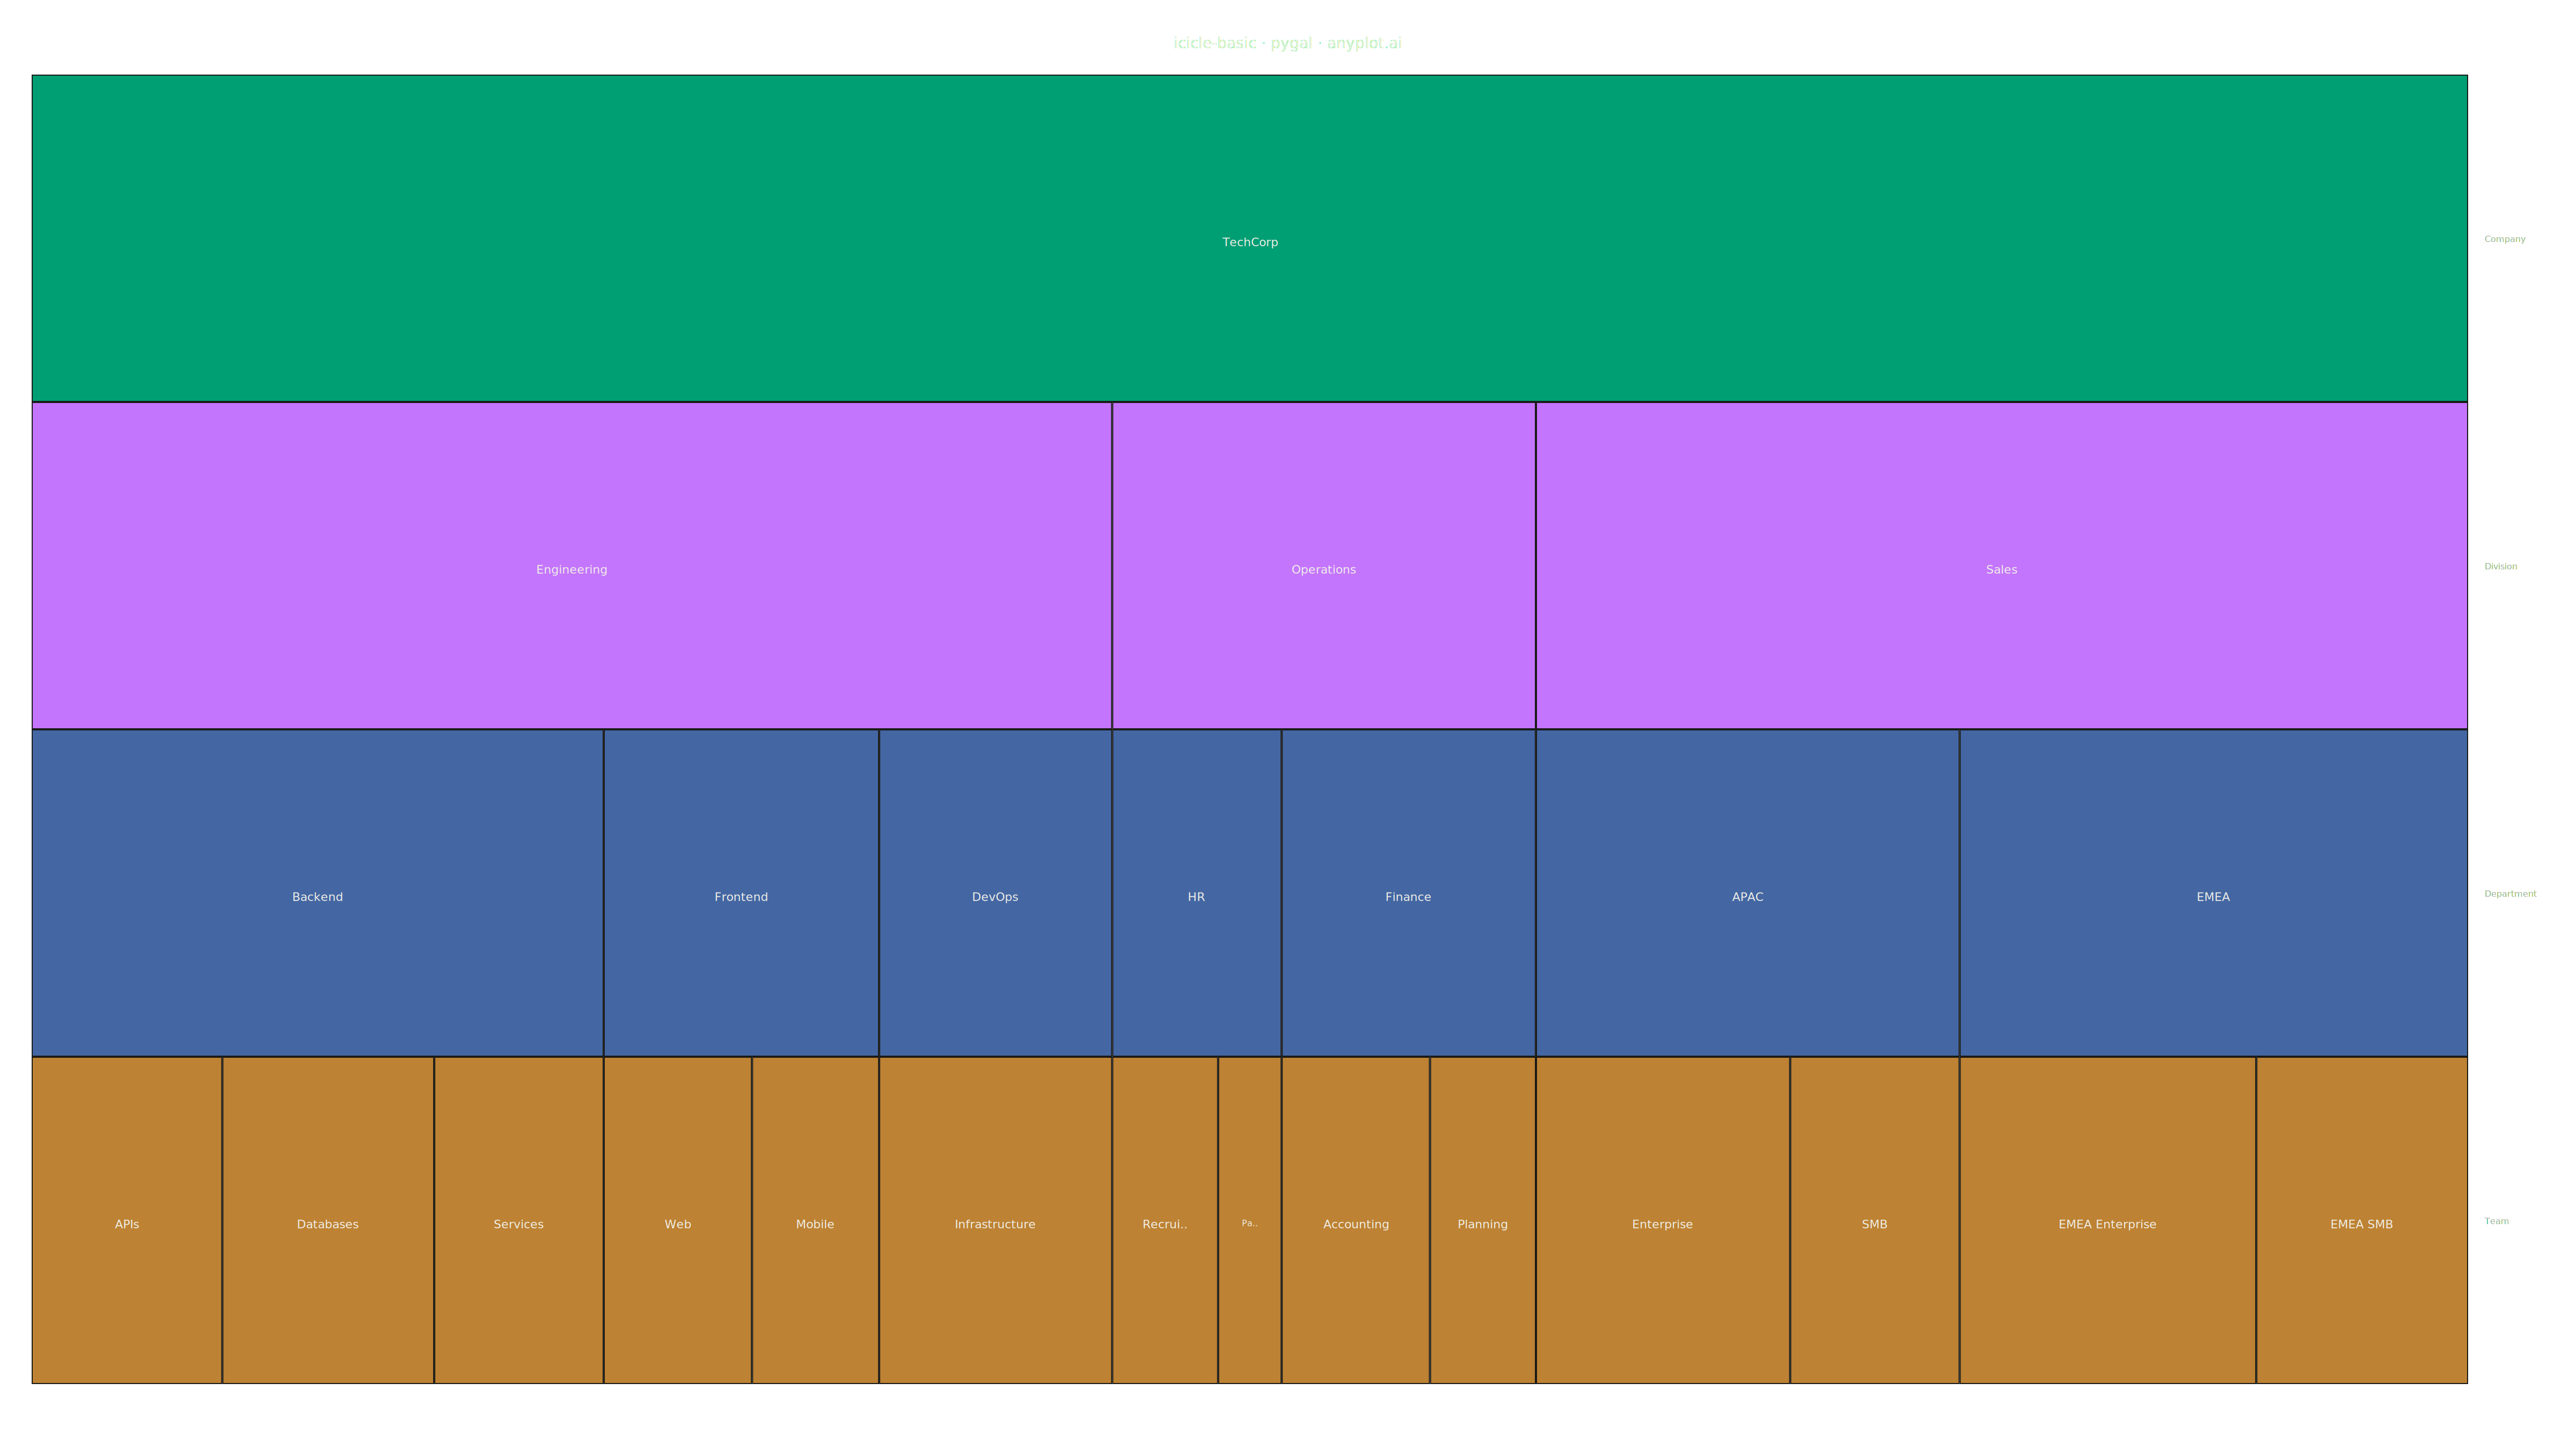
An icicle chart displaying hierarchical data as adjacent rectangles in a layered structure, where each rectangle's size represents its value in the hierarchy. Unlike treemaps that nest rectangles, icicle charts stack them in rows (horizontal) or columns (vertical), making parent-child relationships explicitly visible through spatial adjacency. This layout excels at showing both the hierarchy levels and the proportional values simultaneously.
""" anyplot.ai
icicle-basic: Basic Icicle Chart
Library: pygal 3.1.0 | Python 3.13.13
Quality: 90/100 | Updated: 2026-05-13
"""

import os
import sys
import xml.etree.ElementTree as ET


sys.path.pop(0)

import cairosvg
from pygal.style import Style


# Theme tokens (see prompts/default-style-guide.md)
THEME = os.getenv("ANYPLOT_THEME", "light")
PAGE_BG = "#FAF8F1" if THEME == "light" else "#1A1A17"
INK = "#1A1A17" if THEME == "light" else "#F0EFE8"
INK_SOFT = "#4A4A44" if THEME == "light" else "#B8B7B0"
INK_MUTED = "#6B6A63" if THEME == "light" else "#A8A79F"

# Okabe-Ito palette
IMPRINT = (
    "#009E73",  # bluish green (brand)
    "#C475FD",  # vermillion
    "#4467A3",  # blue
    "#BD8233",  # reddish purple
    "#AE3030",  # orange
    "#2ABCCD",  # sky blue
    "#954477",  # yellow
)

# Data: Organizational hierarchy (Company -> Divisions -> Departments -> Teams)
hierarchy_data = [
    ("TechCorp", None, 0),
    ("Engineering", "TechCorp", 0),
    ("Operations", "TechCorp", 0),
    ("Sales", "TechCorp", 0),
    ("Backend", "Engineering", 0),
    ("Frontend", "Engineering", 0),
    ("DevOps", "Engineering", 0),
    ("HR", "Operations", 0),
    ("Finance", "Operations", 0),
    ("APAC", "Sales", 0),
    ("EMEA", "Sales", 0),
    ("APIs", "Backend", 45),
    ("Databases", "Backend", 50),
    ("Services", "Backend", 40),
    ("Web", "Frontend", 35),
    ("Mobile", "Frontend", 30),
    ("Infrastructure", "DevOps", 55),
    ("Recruiting", "HR", 25),
    ("Payroll", "HR", 15),
    ("Accounting", "Finance", 35),
    ("Planning", "Finance", 25),
    ("Enterprise", "APAC", 60),
    ("SMB", "APAC", 40),
    ("EMEA_Enterprise", "EMEA", 70),
    ("EMEA_SMB", "EMEA", 50),
]

# Build tree structure
nodes = {}
children = {}

for name, parent, value in hierarchy_data:
    nodes[name] = {"name": name, "parent": parent, "value": value}
    if parent is not None:
        if parent not in children:
            children[parent] = []
        children[parent].append(name)

# Calculate total values bottom-up
node_depths = {"TechCorp": 0}
queue = ["TechCorp"]
depth_order = []
while queue:
    current = queue.pop(0)
    depth_order.append(current)
    if current in children:
        for child in children[current]:
            node_depths[child] = node_depths[current] + 1
            queue.append(child)

node_values = {}
for node_name in reversed(depth_order):
    if node_name not in children:
        node_values[node_name] = nodes[node_name]["value"]
    else:
        node_values[node_name] = sum(node_values[child] for child in children[node_name])

# Calculate positions (horizontal icicle layout)
positions = {}
positions["TechCorp"] = {"x_start": 0, "x_end": 1, "depth": 0, "value": node_values["TechCorp"]}

for node_name in depth_order:
    if node_name in children:
        pos = positions[node_name]
        current_x = pos["x_start"]
        total_value = node_values[node_name]
        for child in children[node_name]:
            child_value = node_values[child]
            child_width = (child_value / total_value) * (pos["x_end"] - pos["x_start"])
            positions[child] = {
                "x_start": current_x,
                "x_end": current_x + child_width,
                "depth": pos["depth"] + 1,
                "value": child_value,
            }
            current_x += child_width

max_depth = max(pos["depth"] for pos in positions.values())

# Chart dimensions
WIDTH = 4800
HEIGHT = 2700
MARGIN_TOP = 140
MARGIN_BOTTOM = 120
MARGIN_LEFT = 60
MARGIN_RIGHT = 200
PLOT_WIDTH = WIDTH - MARGIN_LEFT - MARGIN_RIGHT
PLOT_HEIGHT = HEIGHT - MARGIN_TOP - MARGIN_BOTTOM

# Color by depth using Okabe-Ito subset with brand as primary
DEPTH_COLORS = [IMPRINT[i % len(IMPRINT)] for i in range(max_depth + 1)]

# Create pygal style for metadata extraction
custom_style = Style(
    background=PAGE_BG,
    plot_background=PAGE_BG,
    foreground=INK,
    foreground_strong=INK,
    foreground_subtle=INK_MUTED,
    colors=IMPRINT,
    title_font_size=28,
    label_font_size=22,
    major_label_font_size=18,
    legend_font_size=16,
)

# Build SVG manually (icicle requires custom rendering)
svg_ns = "http://www.w3.org/2000/svg"
ET.register_namespace("", svg_ns)

svg_root = ET.Element("svg", xmlns=svg_ns, width=str(WIDTH), height=str(HEIGHT), viewBox=f"0 0 {WIDTH} {HEIGHT}")
svg_root.set("style", f"background-color: {PAGE_BG};")

# Add title
title_elem = ET.SubElement(svg_root, "text")
title_elem.set("x", str(WIDTH / 2))
title_elem.set("y", "90")
title_elem.set("text-anchor", "middle")
title_elem.set("fill", INK)
title_elem.set("font-size", "28")
title_elem.set("font-family", "sans-serif")
title_elem.set("font-weight", "500")
title_elem.text = "icicle-basic · pygal · anyplot.ai"

# Create main group for rectangles
g = ET.SubElement(svg_root, "g")
g.set("class", "icicle-chart")

# Draw rectangles
row_height = PLOT_HEIGHT / (max_depth + 1)
gap = 2

for node_name, pos in positions.items():
    depth = pos["depth"]
    x_start = pos["x_start"]
    x_end = pos["x_end"]
    width = x_end - x_start

    # Calculate pixel positions
    px_x = MARGIN_LEFT + x_start * PLOT_WIDTH
    px_width = width * PLOT_WIDTH - gap
    px_y = MARGIN_TOP + depth * row_height
    px_height = row_height - gap

    # Color by depth from Okabe-Ito
    color = DEPTH_COLORS[depth % len(DEPTH_COLORS)]

    # Create rectangle
    rect = ET.SubElement(g, "rect")
    rect.set("x", f"{px_x:.1f}")
    rect.set("y", f"{px_y:.1f}")
    rect.set("width", f"{max(0, px_width):.1f}")
    rect.set("height", f"{px_height:.1f}")
    rect.set("fill", color)
    rect.set("stroke", PAGE_BG)
    rect.set("stroke-width", "2")

    # Add tooltip
    title = ET.SubElement(rect, "title")
    title.text = f"{node_name}: {pos['value']}"

    # Add label if rectangle is wide enough
    if px_width > 70:
        label = node_name.replace("_", " ")
        max_chars = max(3, int(px_width / 24))
        if len(label) > max_chars:
            label = label[: max_chars - 2] + ".."

        fontsize = min(22, max(14, int(px_width / 7)))

        text = ET.SubElement(g, "text")
        text.set("x", f"{px_x + px_width / 2:.1f}")
        text.set("y", f"{px_y + px_height / 2 + fontsize / 3:.1f}")
        text.set("text-anchor", "middle")
        text.set("dominant-baseline", "central")
        text.set("fill", INK)
        text.set("font-size", str(fontsize))
        text.set("font-family", "sans-serif")
        text.set("font-weight", "500")
        text.text = label

# Add depth level legend on right
level_labels = ["Company", "Division", "Department", "Team", "Function"]
labels_g = ET.SubElement(svg_root, "g")
labels_g.set("class", "level-labels")

for depth in range(max_depth + 1):
    y_pos = MARGIN_TOP + depth * row_height + row_height / 2
    level_label = level_labels[depth] if depth < len(level_labels) else f"Level {depth}"

    text = ET.SubElement(labels_g, "text")
    text.set("x", str(MARGIN_LEFT + PLOT_WIDTH + 30))
    text.set("y", f"{y_pos + 6:.1f}")
    text.set("fill", INK_SOFT)
    text.set("font-size", "16")
    text.set("font-family", "sans-serif")
    text.text = level_label

# Write SVG to file and render PNG
svg_output = ET.tostring(svg_root, encoding="unicode")

with open(f"plot-{THEME}.html", "w") as f:
    f.write(svg_output)

cairosvg.svg2png(bytestring=svg_output.encode("utf-8"), write_to=f"plot-{THEME}.png")
Runnable source as JSON, for any HTTP client: https://api.anyplot.ai/specs/icicle-basic/pygal/code. Any spec id and library id listed in llms-full.txt fit the same URL shape; every URL below is complete and callable.
{
  "spec_id": "icicle-basic",
  "language": "python",
  "library": "pygal",
  "page": "https://anyplot.ai/icicle-basic/python/pygal",
  "hub": "https://anyplot.ai/icicle-basic",
  "code_json": "https://api.anyplot.ai/specs/icicle-basic/pygal/code",
  "spec_json": "https://api.anyplot.ai/specs/icicle-basic",
  "render_light_png": "https://storage.googleapis.com/anyplot-images/plots/icicle-basic/python/pygal/plot-light.png",
  "render_dark_png": "https://storage.googleapis.com/anyplot-images/plots/icicle-basic/python/pygal/plot-dark.png",
  "interactive_light_html": "https://storage.googleapis.com/anyplot-images/plots/icicle-basic/python/pygal/plot-light.html",
  "interactive_dark_html": "https://storage.googleapis.com/anyplot-images/plots/icicle-basic/python/pygal/plot-dark.html",
  "quality_score": 90.0,
  "license": "MIT",
  "guide": "https://anyplot.ai/llms.txt"
}
Part of Basic Icicle Chart on anyplot.ai.