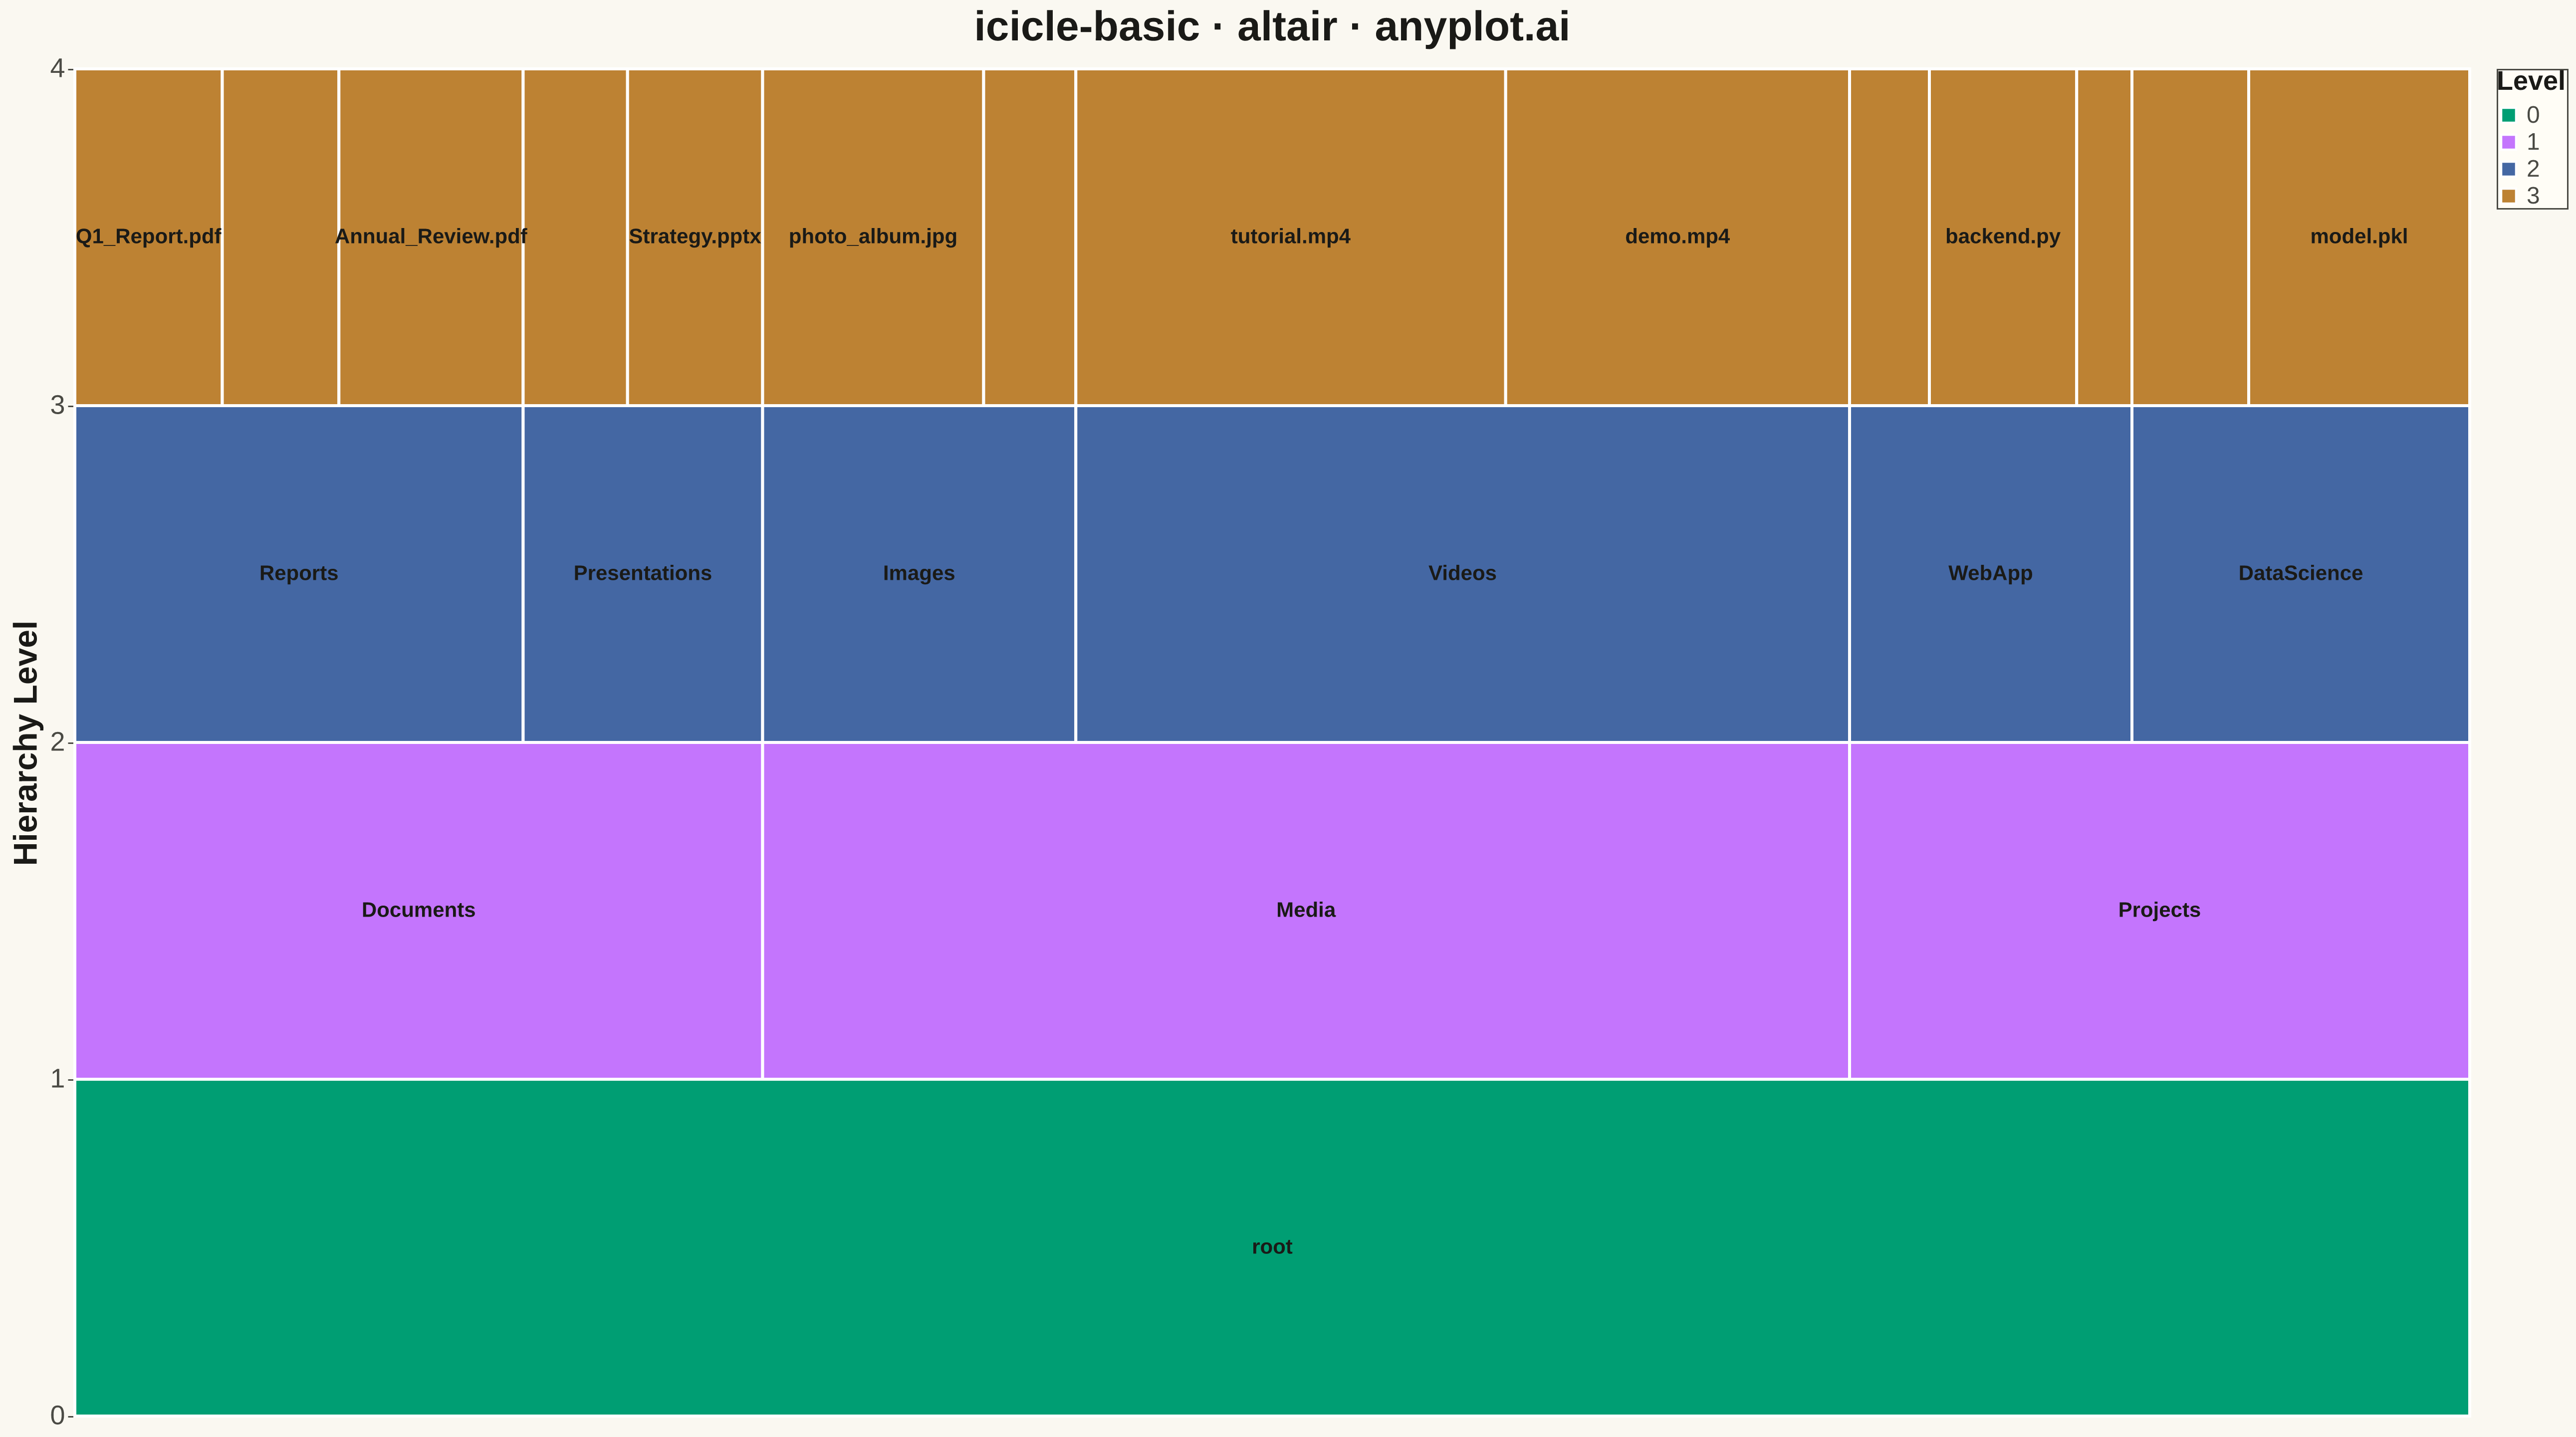
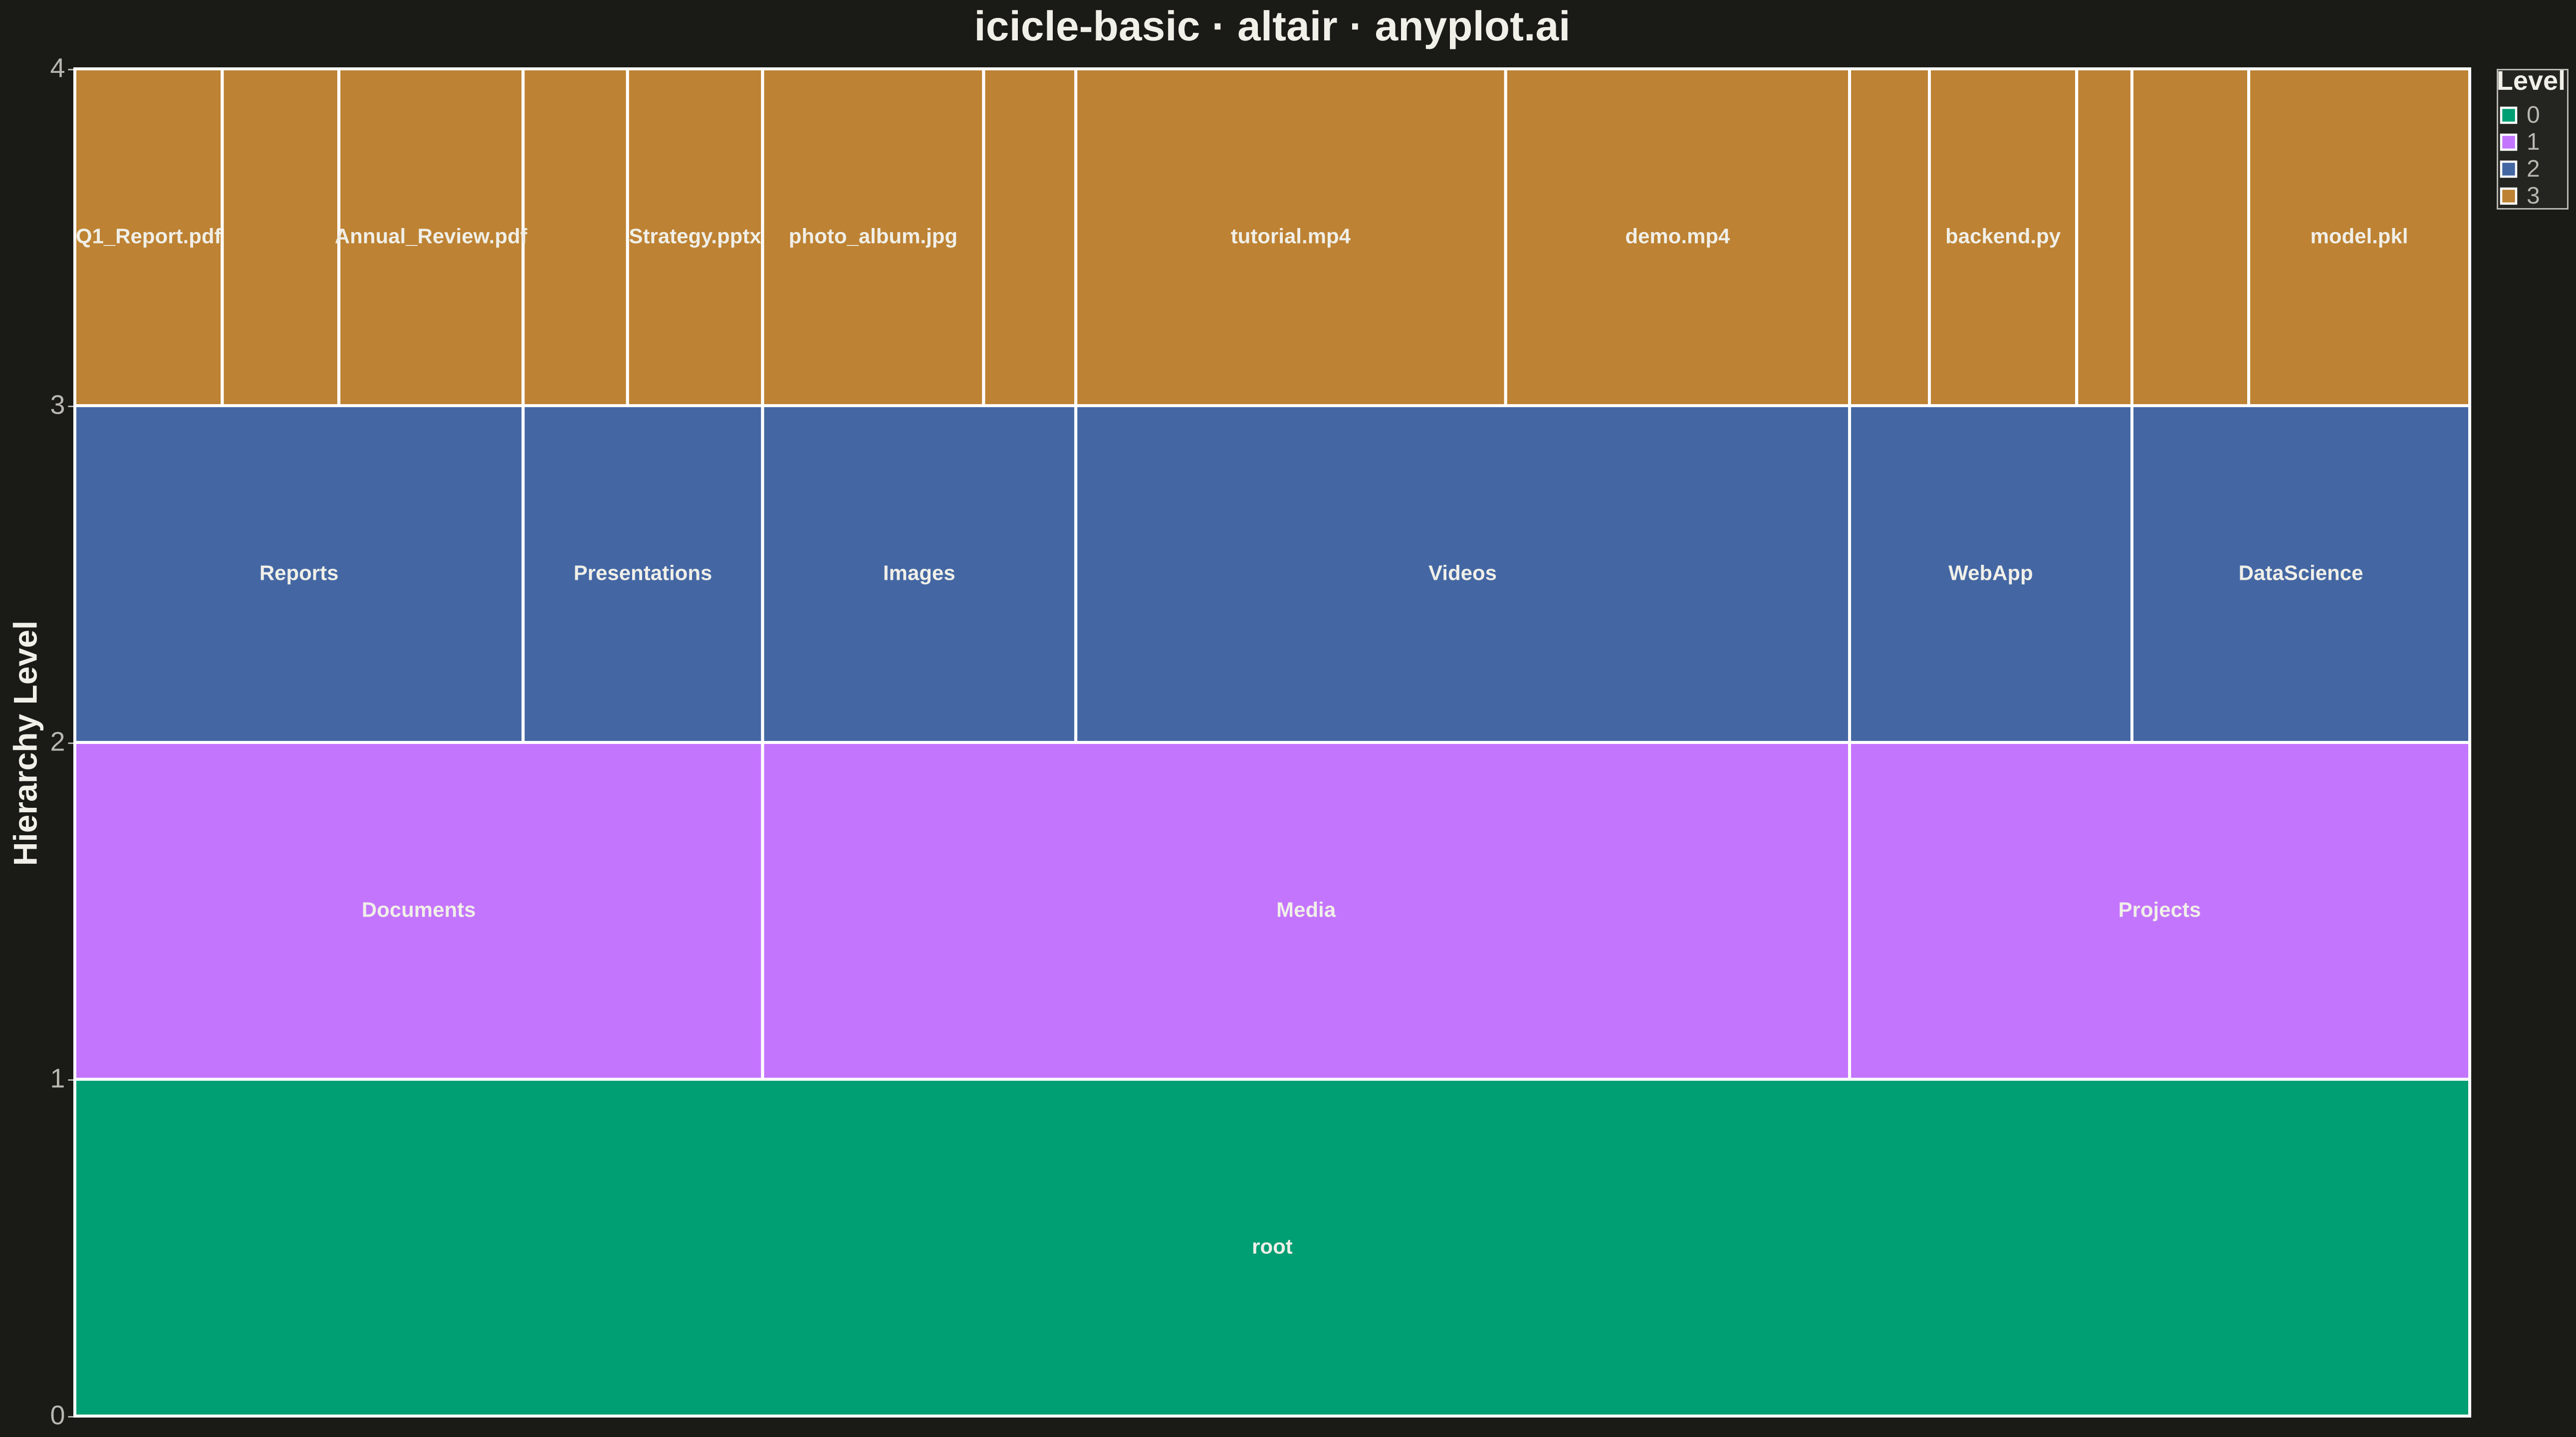
An icicle chart displaying hierarchical data as adjacent rectangles in a layered structure, where each rectangle's size represents its value in the hierarchy. Unlike treemaps that nest rectangles, icicle charts stack them in rows (horizontal) or columns (vertical), making parent-child relationships explicitly visible through spatial adjacency. This layout excels at showing both the hierarchy levels and the proportional values simultaneously.
""" anyplot.ai
icicle-basic: Basic Icicle Chart
Library: altair 6.1.0 | Python 3.13.13
Quality: 92/100 | Updated: 2026-05-13
"""

import os
import sys


# Prioritize site-packages for module resolution to avoid shadowing
site_packages = [p for p in sys.path if "site-packages" in p]
for p in site_packages:
    if p in sys.path:
        sys.path.remove(p)
    sys.path.insert(0, p)

import altair as alt
import pandas as pd


# Theme tokens
THEME = os.getenv("ANYPLOT_THEME", "light")
PAGE_BG = "#FAF8F1" if THEME == "light" else "#1A1A17"
ELEVATED_BG = "#FFFDF6" if THEME == "light" else "#242420"
INK = "#1A1A17" if THEME == "light" else "#F0EFE8"
INK_SOFT = "#4A4A44" if THEME == "light" else "#B8B7B0"

# Okabe-Ito palette for levels
IMPRINT = ["#009E73", "#C475FD", "#4467A3", "#BD8233", "#AE3030", "#2ABCCD", "#954477"]

# Data: File system hierarchy with sizes (in MB)
data = [
    # Root
    {"name": "root", "parent": None, "value": 0},
    # Level 1: Main folders
    {"name": "Documents", "parent": "root", "value": 0},
    {"name": "Media", "parent": "root", "value": 0},
    {"name": "Projects", "parent": "root", "value": 0},
    # Level 2: Documents subfolders
    {"name": "Reports", "parent": "Documents", "value": 0},
    {"name": "Presentations", "parent": "Documents", "value": 0},
    # Level 2: Media subfolders
    {"name": "Images", "parent": "Media", "value": 0},
    {"name": "Videos", "parent": "Media", "value": 0},
    # Level 2: Projects subfolders
    {"name": "WebApp", "parent": "Projects", "value": 0},
    {"name": "DataScience", "parent": "Projects", "value": 0},
    # Level 3: Leaf nodes with sizes balanced for better visual representation
    {"name": "Q1_Report.pdf", "parent": "Reports", "value": 120},
    {"name": "Q2_Report.pdf", "parent": "Reports", "value": 95},
    {"name": "Annual_Review.pdf", "parent": "Reports", "value": 150},
    {"name": "Sales_Deck.pptx", "parent": "Presentations", "value": 85},
    {"name": "Strategy.pptx", "parent": "Presentations", "value": 110},
    {"name": "photo_album.jpg", "parent": "Images", "value": 180},
    {"name": "banner.png", "parent": "Images", "value": 75},
    {"name": "tutorial.mp4", "parent": "Videos", "value": 350},
    {"name": "demo.mp4", "parent": "Videos", "value": 280},
    {"name": "frontend.js", "parent": "WebApp", "value": 65},
    {"name": "backend.py", "parent": "WebApp", "value": 120},
    {"name": "styles.css", "parent": "WebApp", "value": 45},
    {"name": "analysis.ipynb", "parent": "DataScience", "value": 95},
    {"name": "model.pkl", "parent": "DataScience", "value": 180},
]

df = pd.DataFrame(data)

# Build tree structure
name_to_idx = {row["name"]: i for i, row in enumerate(data)}
children = {row["name"]: [] for row in data}
for row in data:
    if row["parent"]:
        children[row["parent"]].append(row["name"])

# Calculate levels (depth) iteratively
levels = {"root": 0}
queue = ["root"]
while queue:
    current = queue.pop(0)
    for child in children[current]:
        levels[child] = levels[current] + 1
        queue.append(child)

for row in data:
    row["level"] = levels[row["name"]]

# Calculate cumulative values bottom-up
max_level = max(levels.values())
for level in range(max_level, -1, -1):
    for row in data:
        if row["level"] == level:
            if children[row["name"]]:
                row["total_value"] = sum(data[name_to_idx[c]]["total_value"] for c in children[row["name"]])
            else:
                row["total_value"] = row["value"]

# Calculate x positions iteratively
positions = {"root": (0, 1)}
queue = ["root"]
while queue:
    current = queue.pop(0)
    x_start, x_end = positions[current]
    child_list = children[current]
    if child_list:
        total = sum(data[name_to_idx[c]]["total_value"] for c in child_list)
        if total > 0:
            current_x = x_start
            for child in child_list:
                child_val = data[name_to_idx[child]]["total_value"]
                child_width = (x_end - x_start) * child_val / total
                positions[child] = (current_x, current_x + child_width)
                current_x += child_width
                queue.append(child)

for row in data:
    row["x_start"], row["x_end"] = positions[row["name"]]

# Prepare data for Altair rectangles
rect_data = []
for row in data:
    if row["total_value"] > 0:
        rect_data.append(
            {
                "name": row["name"],
                "x_start": row["x_start"],
                "x_end": row["x_end"],
                "y_start": row["level"],
                "y_end": row["level"] + 1,
                "level": row["level"],
                "value": row["total_value"],
                "parent": row["parent"] if row["parent"] else "None",
            }
        )

rect_df = pd.DataFrame(rect_data)

# Create icicle chart with mark_rect
chart = (
    alt.Chart(rect_df)
    .mark_rect(stroke="white", strokeWidth=2)
    .encode(
        x=alt.X("x_start:Q", axis=None, scale=alt.Scale(domain=[0, 1])),
        x2=alt.X2("x_end:Q"),
        y=alt.Y(
            "y_start:Q",
            axis=alt.Axis(
                title="Hierarchy Level",
                labelFontSize=18,
                titleFontSize=22,
                values=list(range(max_level + 2)),
                format="d",
            ),
            scale=alt.Scale(domain=[0, max_level + 1]),
        ),
        y2=alt.Y2("y_end:Q"),
        color=alt.Color(
            "level:O",
            scale=alt.Scale(domain=list(range(max_level + 1)), range=IMPRINT),
            legend=alt.Legend(title="Level", labelFontSize=16, titleFontSize=18, orient="right"),
        ),
        tooltip=["name:N", "value:Q", "parent:N", "level:O"],
    )
)

# Add text labels for larger rectangles
text = (
    alt.Chart(rect_df)
    .mark_text(fontSize=14, color=INK, fontWeight="bold", align="center")
    .encode(
        x=alt.X("x_mid:Q", scale=alt.Scale(domain=[0, 1])),
        y=alt.Y("y_mid:Q", scale=alt.Scale(domain=[0, max_level + 1])),
        text=alt.Text("label:N"),
    )
    .transform_calculate(
        x_mid="(datum.x_start + datum.x_end) / 2",
        y_mid="(datum.y_start + datum.y_end) / 2",
        width="datum.x_end - datum.x_start",
        label="datum.width > 0.05 ? datum.name : ''",
    )
)

# Combine chart and text with theme-adaptive configuration
icicle = (
    (chart + text)
    .properties(width=1600, height=900, background=PAGE_BG, title="icicle-basic · altair · anyplot.ai")
    .configure_title(fontSize=28, anchor="middle", color=INK)
    .configure_view(strokeWidth=0, fill=PAGE_BG)
    .configure_axis(
        domainColor=INK_SOFT, tickColor=INK_SOFT, gridColor=INK, gridOpacity=0.10, labelColor=INK_SOFT, titleColor=INK
    )
    .configure_legend(fillColor=ELEVATED_BG, strokeColor=INK_SOFT, labelColor=INK_SOFT, titleColor=INK)
)

# Save as PNG and HTML with theme-suffixed names
icicle.save(f"plot-{THEME}.png", scale_factor=3.0)
icicle.save(f"plot-{THEME}.html")
Runnable source as JSON, for any HTTP client: https://api.anyplot.ai/specs/icicle-basic/altair/code. Any spec id and library id listed in llms-full.txt fit the same URL shape; every URL below is complete and callable.
{
  "spec_id": "icicle-basic",
  "language": "python",
  "library": "altair",
  "page": "https://anyplot.ai/icicle-basic/python/altair",
  "hub": "https://anyplot.ai/icicle-basic",
  "code_json": "https://api.anyplot.ai/specs/icicle-basic/altair/code",
  "spec_json": "https://api.anyplot.ai/specs/icicle-basic",
  "render_light_png": "https://storage.googleapis.com/anyplot-images/plots/icicle-basic/python/altair/plot-light.png",
  "render_dark_png": "https://storage.googleapis.com/anyplot-images/plots/icicle-basic/python/altair/plot-dark.png",
  "interactive_light_html": "https://storage.googleapis.com/anyplot-images/plots/icicle-basic/python/altair/plot-light.html",
  "interactive_dark_html": "https://storage.googleapis.com/anyplot-images/plots/icicle-basic/python/altair/plot-dark.html",
  "quality_score": 92.0,
  "license": "MIT",
  "guide": "https://anyplot.ai/llms.txt"
}
Part of Basic Icicle Chart on anyplot.ai.