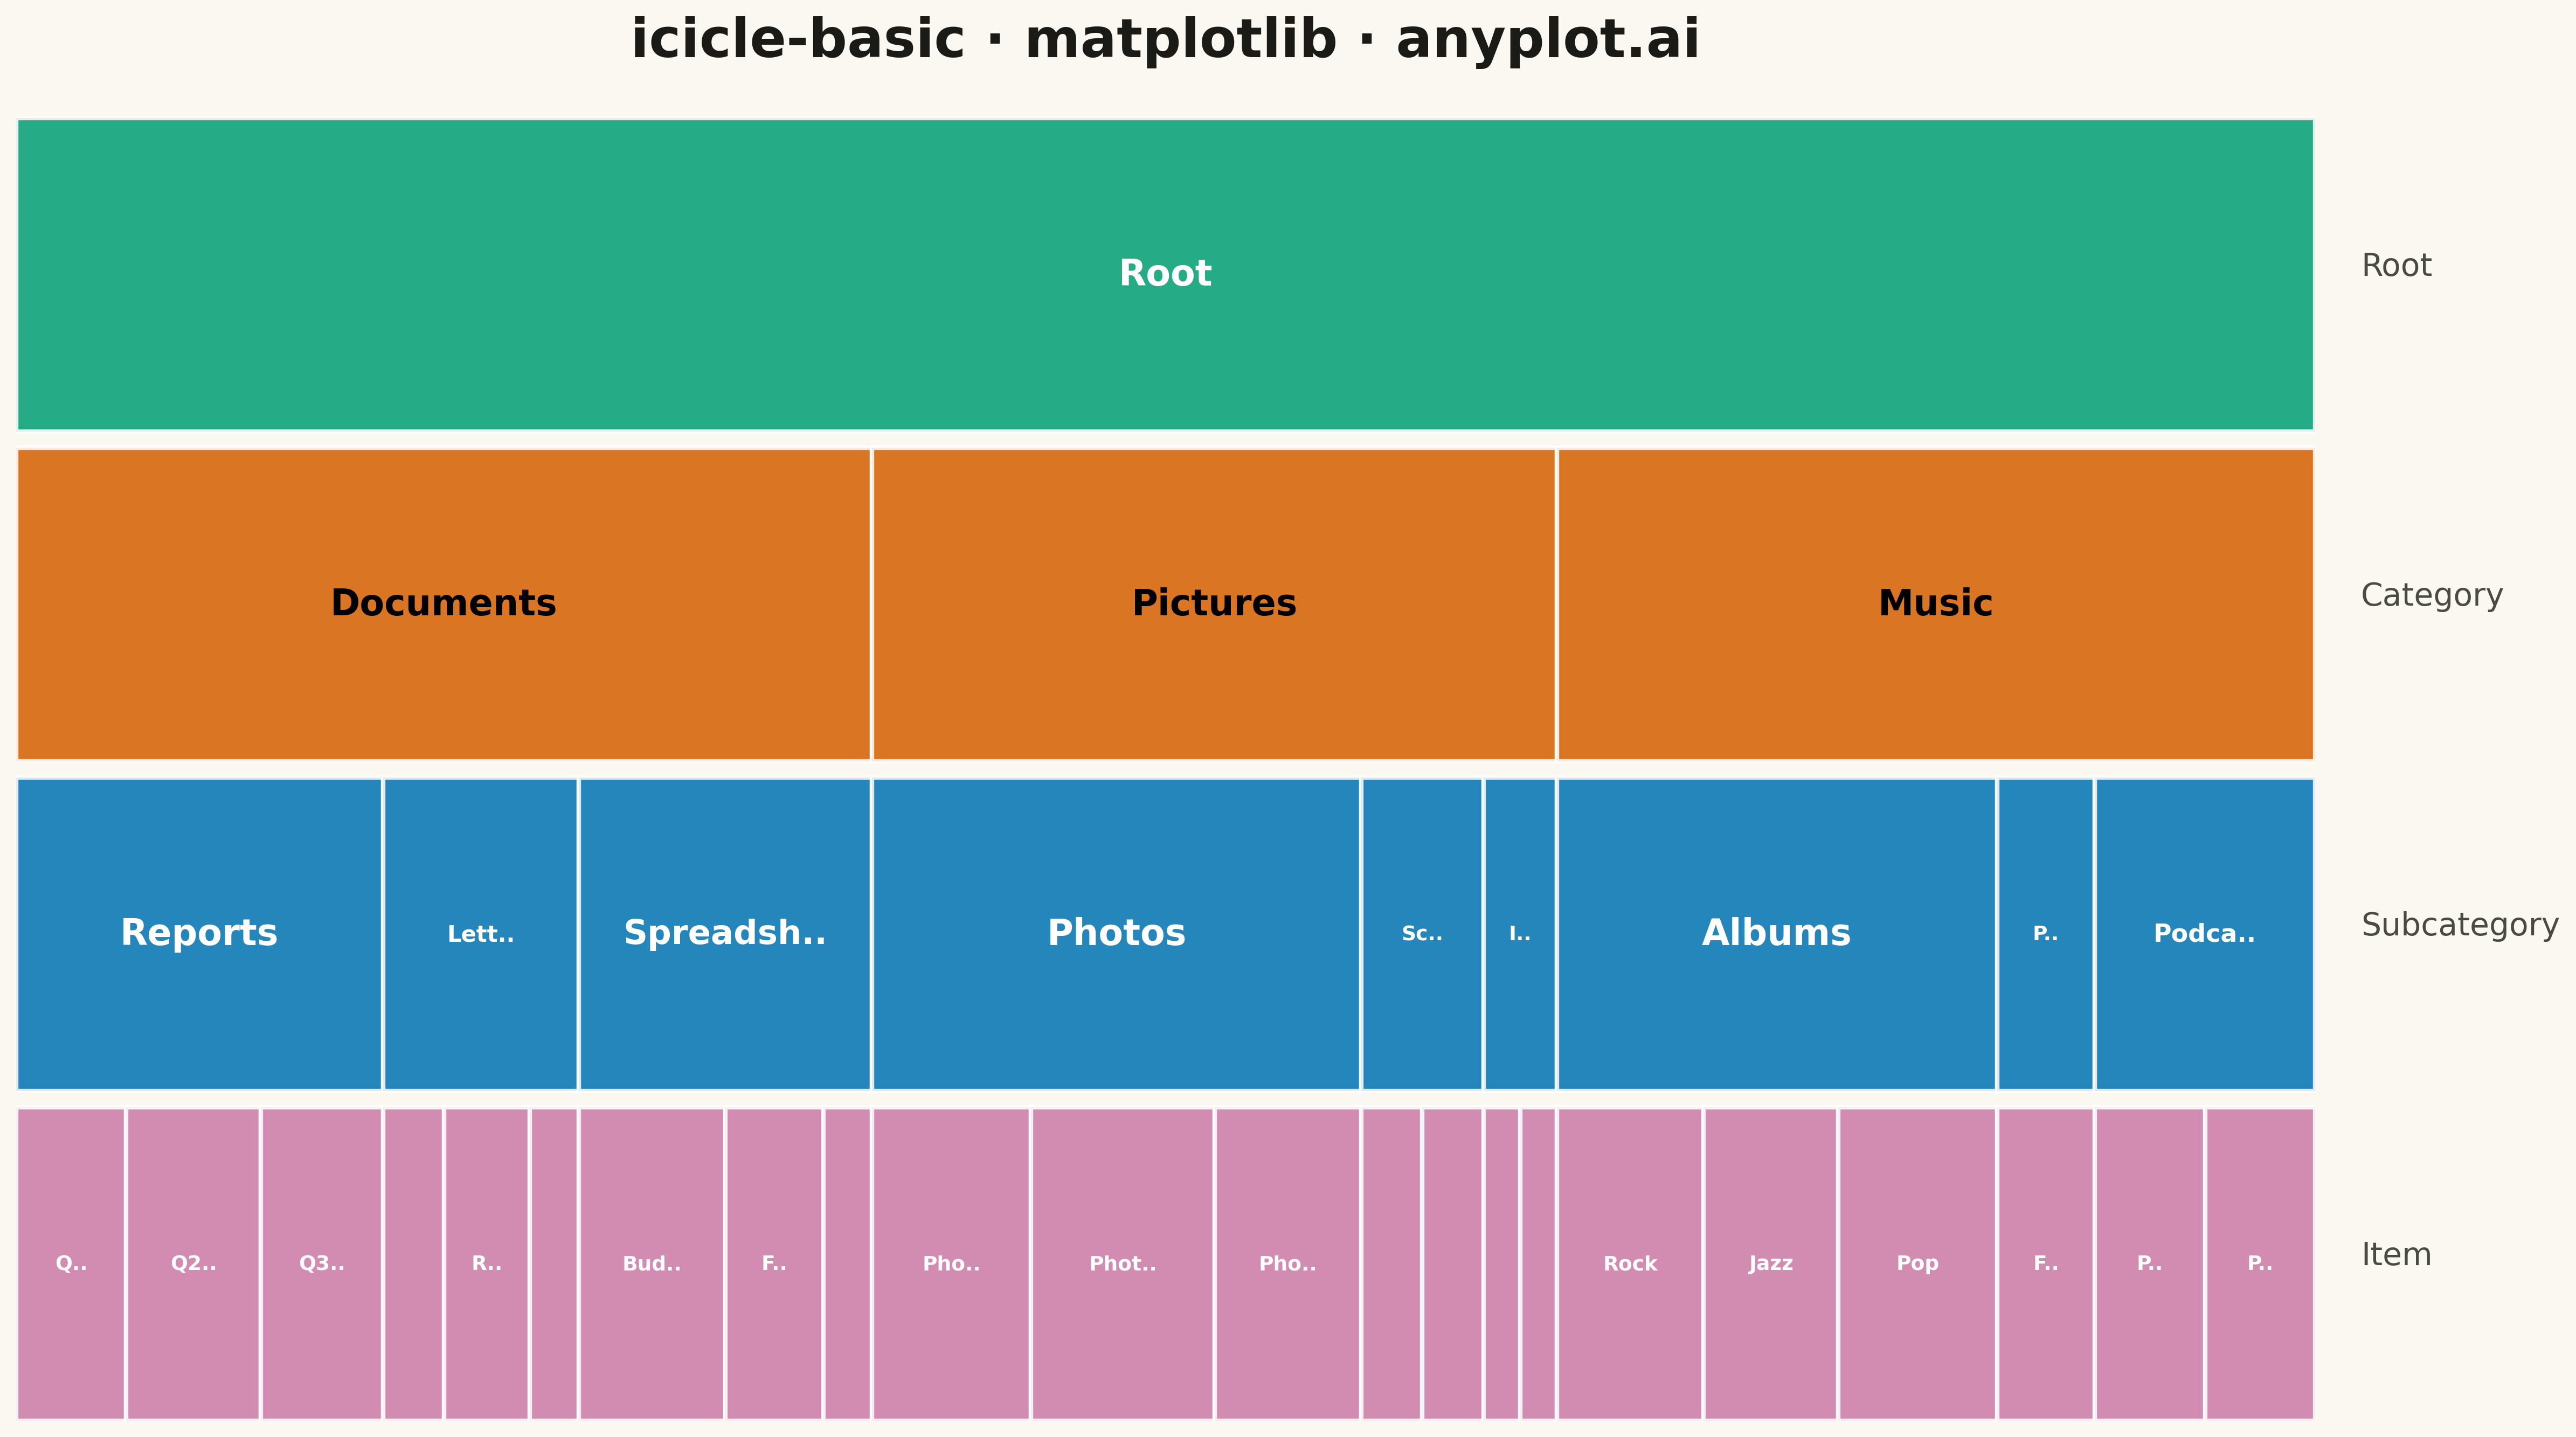
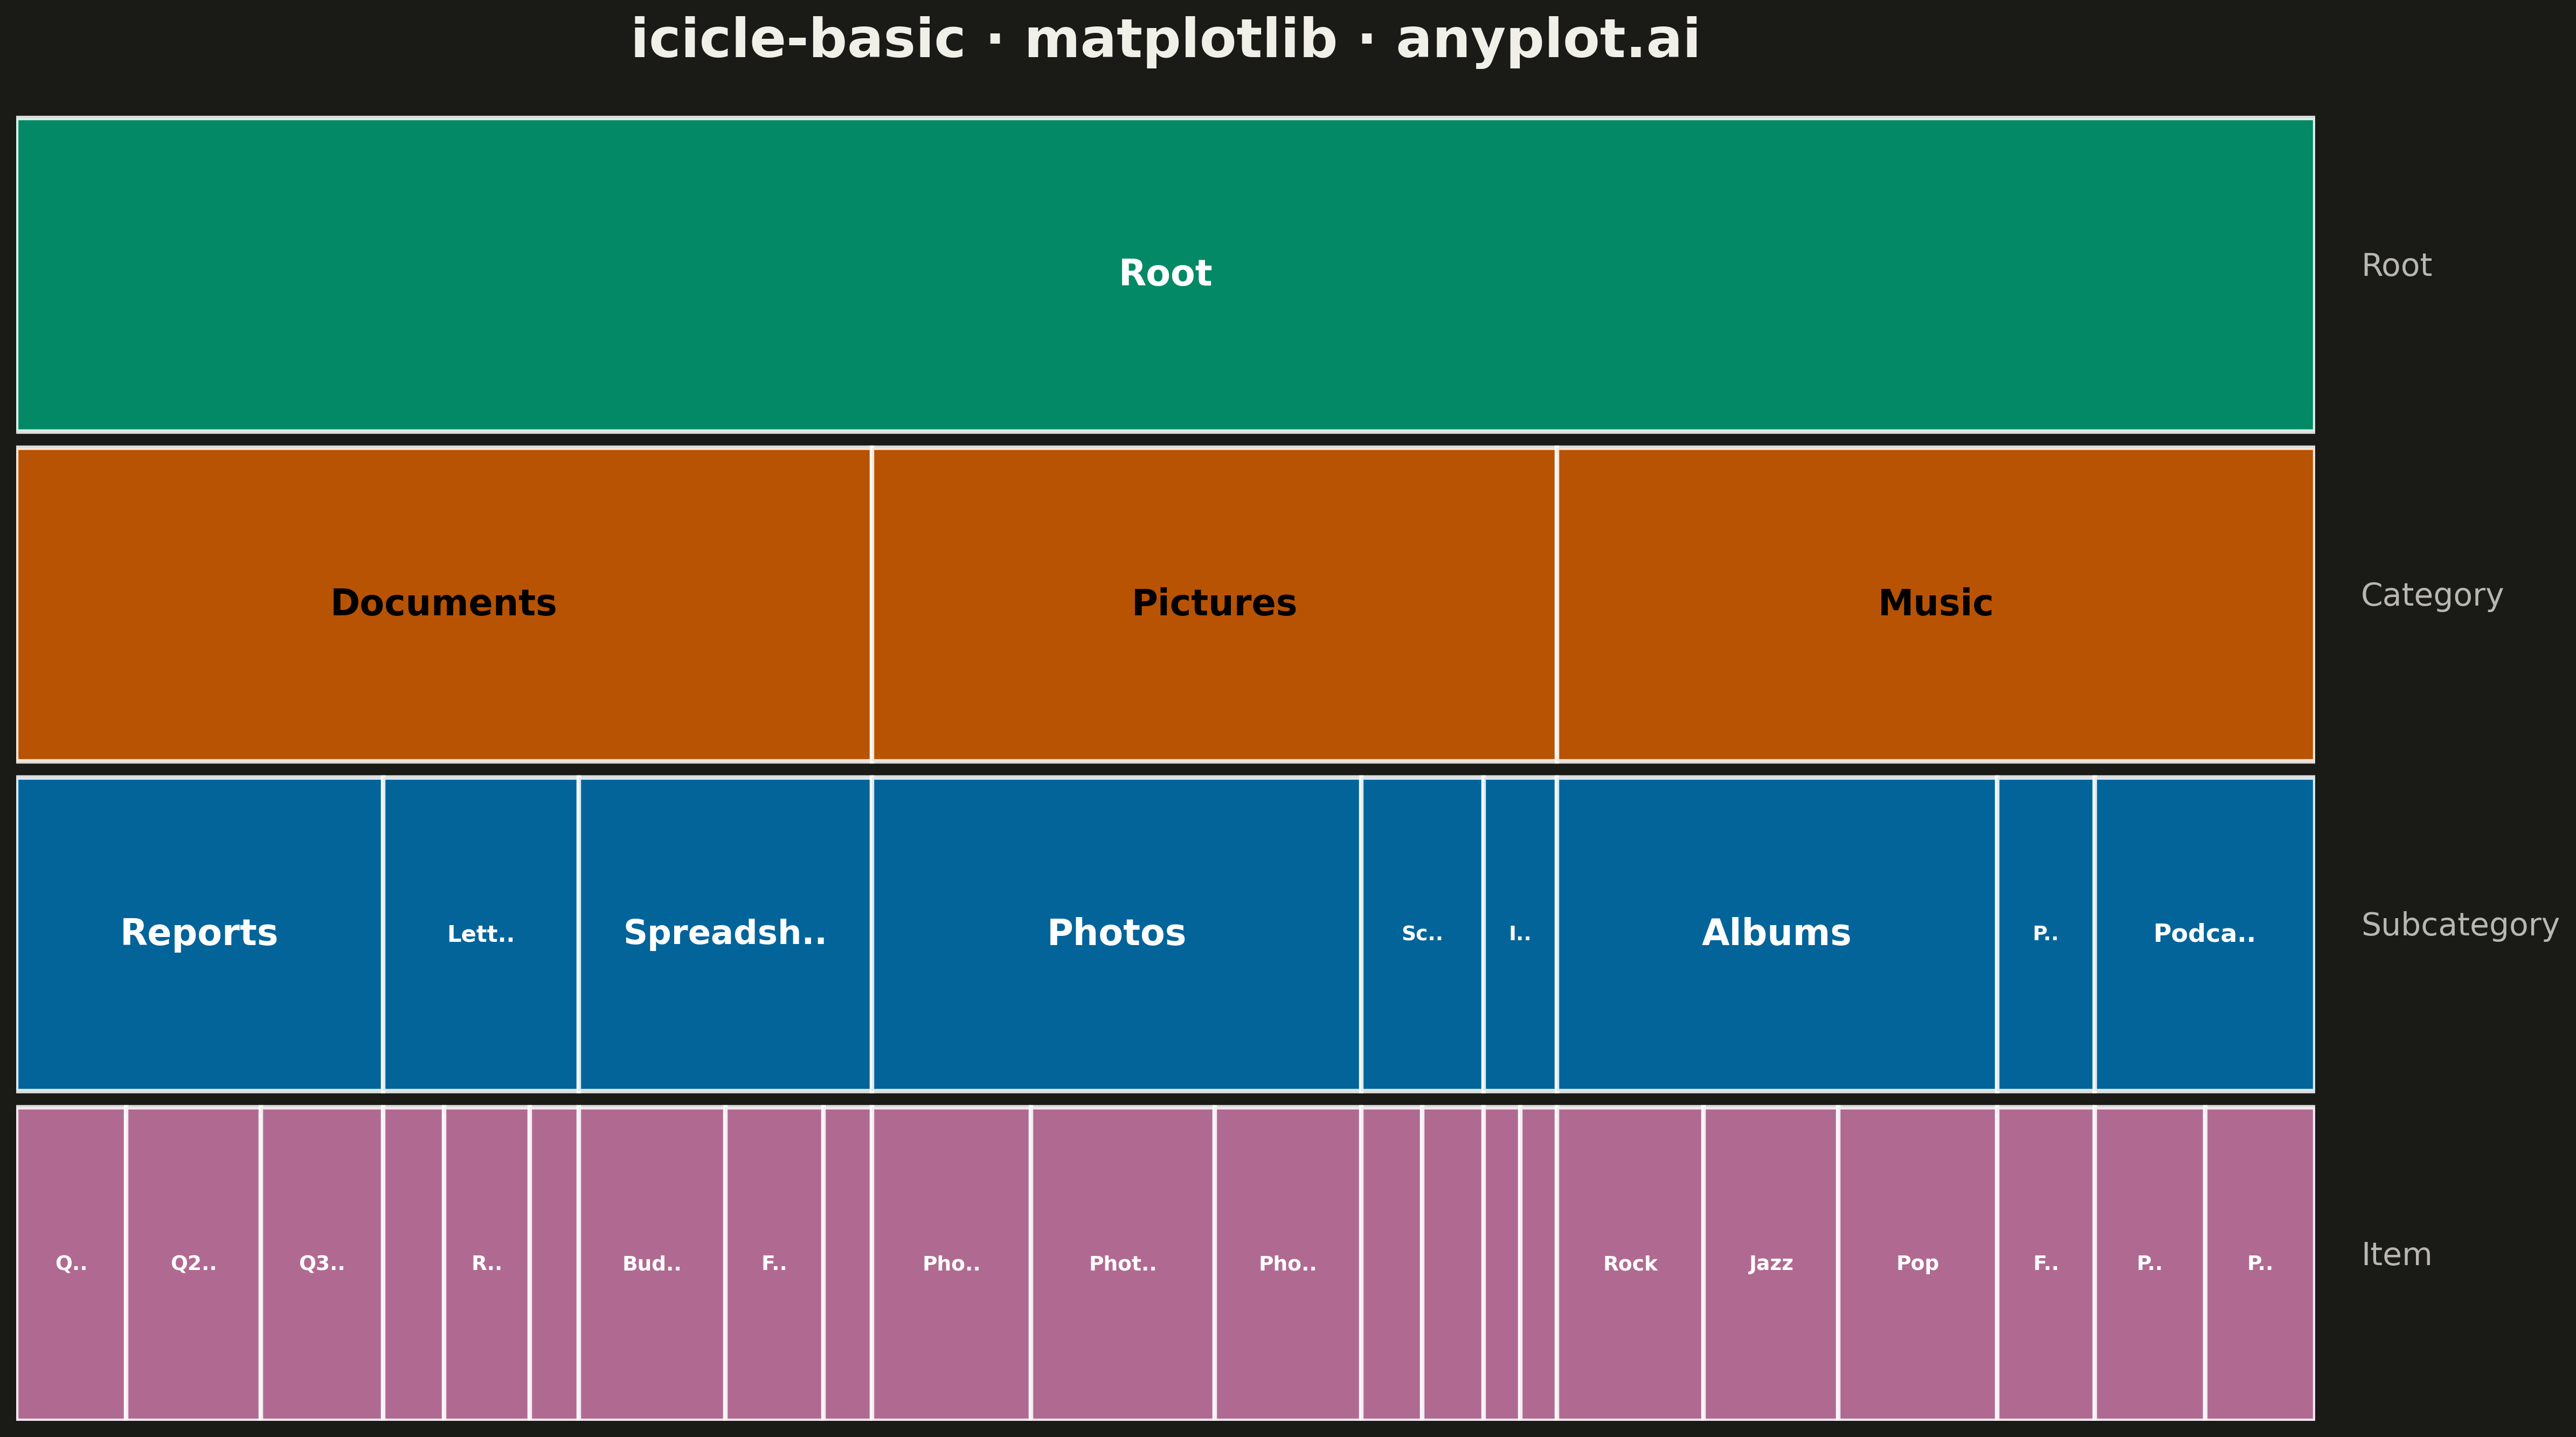
An icicle chart displaying hierarchical data as adjacent rectangles in a layered structure, where each rectangle's size represents its value in the hierarchy. Unlike treemaps that nest rectangles, icicle charts stack them in rows (horizontal) or columns (vertical), making parent-child relationships explicitly visible through spatial adjacency. This layout excels at showing both the hierarchy levels and the proportional values simultaneously.
""" anyplot.ai
icicle-basic: Basic Icicle Chart
Library: matplotlib 3.10.9 | Python 3.13.13
Quality: 80/100 | Updated: 2026-05-13
"""

import matplotlib.patches as patches
import matplotlib.pyplot as plt


# Data: File system structure with folders and files
# Format: (name, parent, value) - leaf nodes have values, internal nodes will be computed
hierarchy_data = [
    ("Root", None, 0),
    ("Documents", "Root", 0),
    ("Pictures", "Root", 0),
    ("Music", "Root", 0),
    ("Reports", "Documents", 0),
    ("Letters", "Documents", 0),
    ("Spreadsheets", "Documents", 0),
    ("Photos", "Pictures", 0),
    ("Screenshots", "Pictures", 0),
    ("Icons", "Pictures", 0),
    ("Albums", "Music", 0),
    ("Playlists", "Music", 0),
    ("Podcasts", "Music", 0),
    ("Q1_Report", "Reports", 45),
    ("Q2_Report", "Reports", 55),
    ("Q3_Report", "Reports", 50),
    ("Cover_Letter", "Letters", 25),
    ("Resume", "Letters", 35),
    ("Thank_You", "Letters", 20),
    ("Budget", "Spreadsheets", 60),
    ("Forecast", "Spreadsheets", 40),
    ("Analysis", "Spreadsheets", 20),
    ("Photo_1", "Photos", 65),
    ("Photo_2", "Photos", 75),
    ("Photo_3", "Photos", 60),
    ("Screen_1", "Screenshots", 25),
    ("Screen_2", "Screenshots", 25),
    ("Icon_1", "Icons", 15),
    ("Icon_2", "Icons", 15),
    ("Rock", "Albums", 60),
    ("Jazz", "Albums", 55),
    ("Pop", "Albums", 65),
    ("Favorites", "Playlists", 40),
    ("Podcast_1", "Podcasts", 45),
    ("Podcast_2", "Podcasts", 45),
]

# Build tree structure inline (no functions per KISS principle)
nodes = {}
children = {}

for name, parent, value in hierarchy_data:
    nodes[name] = {"name": name, "parent": parent, "value": value}
    if parent is not None:
        if parent not in children:
            children[parent] = []
        children[parent].append(name)

# Calculate total values for all nodes (bottom-up traversal)
# First, get nodes in reverse depth order using BFS
node_depths = {"Root": 0}
queue = ["Root"]
depth_order = []
while queue:
    current = queue.pop(0)
    depth_order.append(current)
    if current in children:
        for child in children[current]:
            node_depths[child] = node_depths[current] + 1
            queue.append(child)

# Calculate values bottom-up
node_values = {}
for node_name in reversed(depth_order):
    if node_name not in children:
        node_values[node_name] = nodes[node_name]["value"]
    else:
        node_values[node_name] = sum(node_values[child] for child in children[node_name])

# Calculate positions for icicle chart (top-to-bottom layout)
positions = {}
positions["Root"] = {"x_start": 0, "x_end": 1, "depth": 0, "value": node_values["Root"]}

# Process nodes level by level
for node_name in depth_order:
    if node_name in children:
        pos = positions[node_name]
        current_x = pos["x_start"]
        total_value = node_values[node_name]
        for child in children[node_name]:
            child_value = node_values[child]
            child_width = (child_value / total_value) * (pos["x_end"] - pos["x_start"])
            positions[child] = {
                "x_start": current_x,
                "x_end": current_x + child_width,
                "depth": pos["depth"] + 1,
                "value": child_value,
            }
            current_x += child_width

# Find max depth
max_depth = max(pos["depth"] for pos in positions.values())

# Color palette by depth level (colorblind-safe)
depth_colors = [
    "#306998",  # Python Blue - Level 0
    "#FFD43B",  # Python Yellow - Level 1
    "#4ECDC4",  # Teal - Level 2
    "#FF6B6B",  # Coral - Level 3
    "#95E1D3",  # Light teal - Level 4
]

# Create plot
fig, ax = plt.subplots(figsize=(16, 9))

# Draw rectangles
row_height = 1.0 / (max_depth + 1)

for node_name, pos in positions.items():
    depth = pos["depth"]
    x_start = pos["x_start"]
    x_end = pos["x_end"]
    width = x_end - x_start

    # Y position (top-to-bottom: depth 0 at top)
    y_start = 1.0 - (depth + 1) * row_height

    # Get color based on depth
    color = depth_colors[depth % len(depth_colors)]

    # Draw rectangle
    rect = patches.Rectangle(
        (x_start, y_start),
        width,
        row_height * 0.95,  # Small gap between rows
        linewidth=2,
        edgecolor="white",
        facecolor=color,
        alpha=0.85,
    )
    ax.add_patch(rect)

    # Add label if rectangle is wide enough
    if width > 0.03:
        label = node_name.replace("_", " ")
        max_chars = max(3, int(width * 80))
        if len(label) > max_chars:
            label = label[: max_chars - 2] + ".."

        # Calculate font size based on width
        fontsize = min(16, max(9, int(width * 120)))

        ax.text(
            x_start + width / 2,
            y_start + row_height * 0.95 / 2,
            label,
            ha="center",
            va="center",
            fontsize=fontsize,
            fontweight="bold",
            color="white" if depth != 1 else "black",
        )

# Configure axes
ax.set_xlim(0, 1)
ax.set_ylim(0, 1)
ax.set_aspect("auto")

# Add depth level labels on the right
level_labels = ["Root", "Category", "Subcategory", "Item", "Detail"]
for depth in range(max_depth + 1):
    y_pos = 1.0 - (depth + 0.5) * row_height
    level_label = level_labels[depth] if depth < len(level_labels) else ""
    ax.text(1.02, y_pos, level_label, fontsize=14, va="center", color="#333333")

# Remove axes for cleaner look
ax.axis("off")

# Add title in correct format per spec
ax.set_title("icicle-basic · matplotlib · pyplots.ai", fontsize=24, fontweight="bold", pad=20)

plt.tight_layout()
plt.savefig("plot.png", dpi=300, bbox_inches="tight", facecolor="white")
Runnable source as JSON, for any HTTP client: https://api.anyplot.ai/specs/icicle-basic/matplotlib/code. Any spec id and library id listed in llms-full.txt fit the same URL shape; every URL below is complete and callable.
{
  "spec_id": "icicle-basic",
  "language": "python",
  "library": "matplotlib",
  "page": "https://anyplot.ai/icicle-basic/python/matplotlib",
  "hub": "https://anyplot.ai/icicle-basic",
  "code_json": "https://api.anyplot.ai/specs/icicle-basic/matplotlib/code",
  "spec_json": "https://api.anyplot.ai/specs/icicle-basic",
  "render_light_png": "https://storage.googleapis.com/anyplot-images/plots/icicle-basic/python/matplotlib/plot-light.png",
  "render_dark_png": "https://storage.googleapis.com/anyplot-images/plots/icicle-basic/python/matplotlib/plot-dark.png",
  "quality_score": 80.0,
  "license": "MIT",
  "guide": "https://anyplot.ai/llms.txt"
}
Part of Basic Icicle Chart on anyplot.ai.