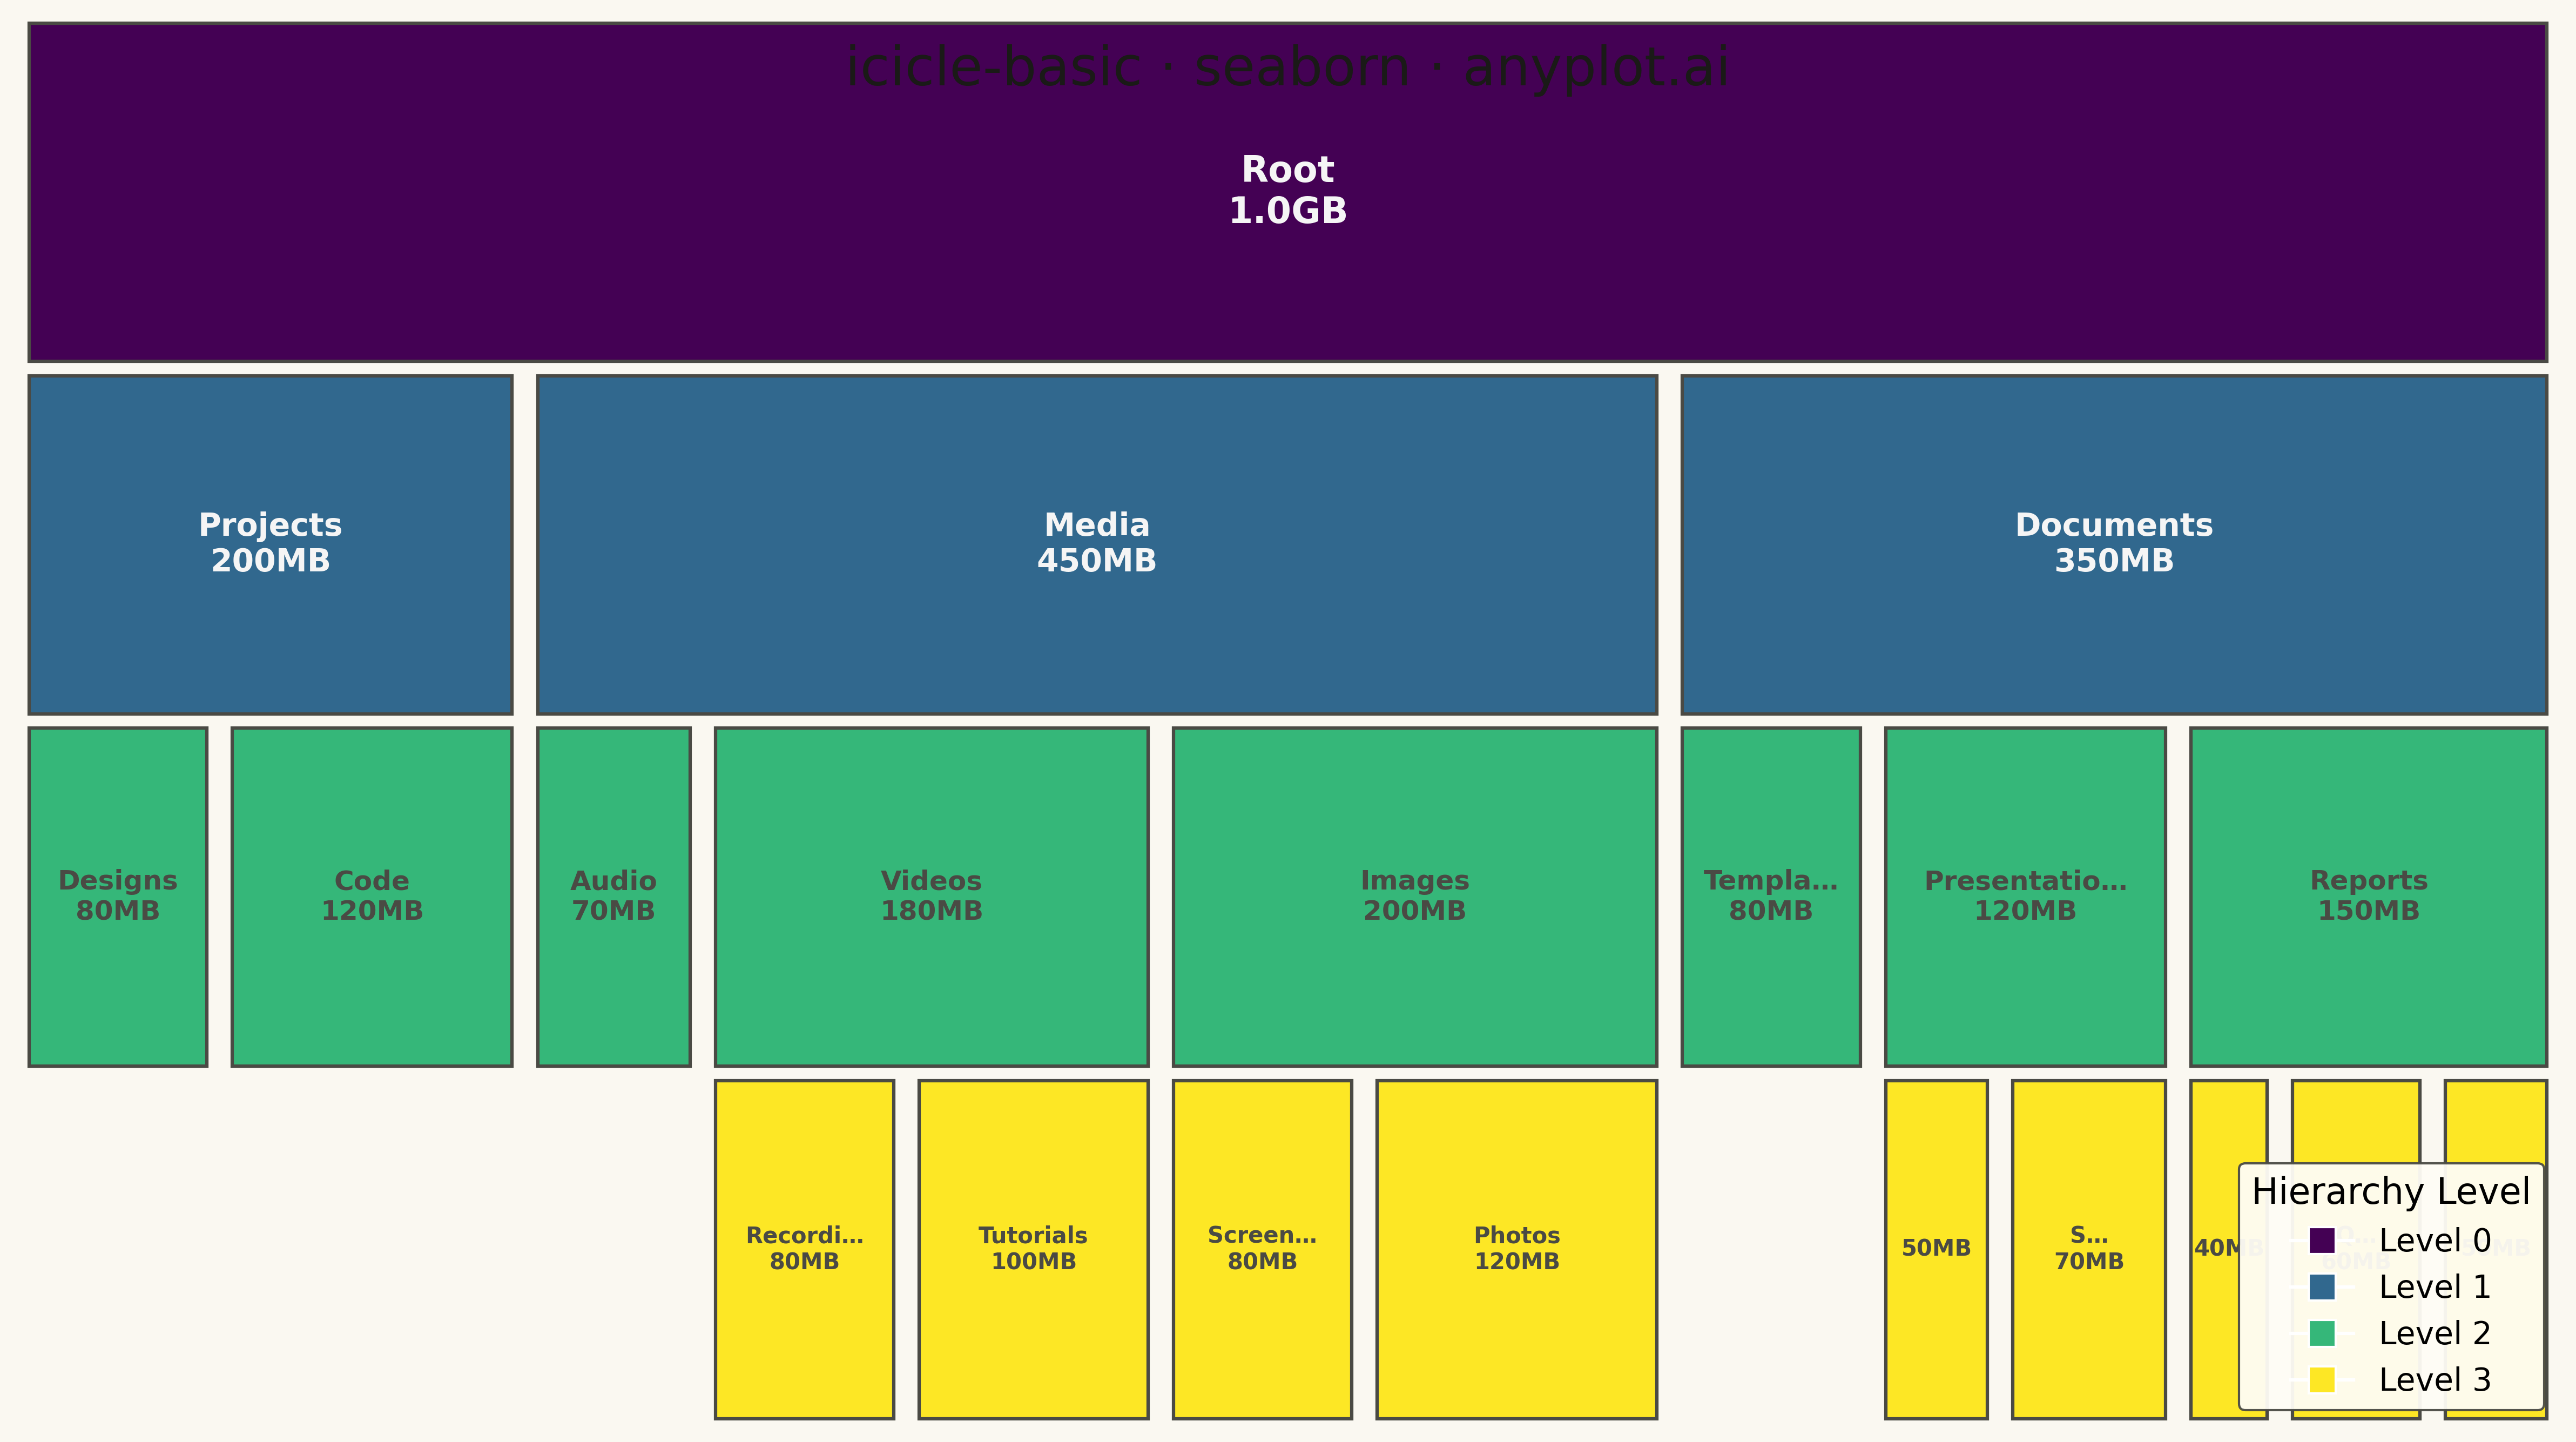
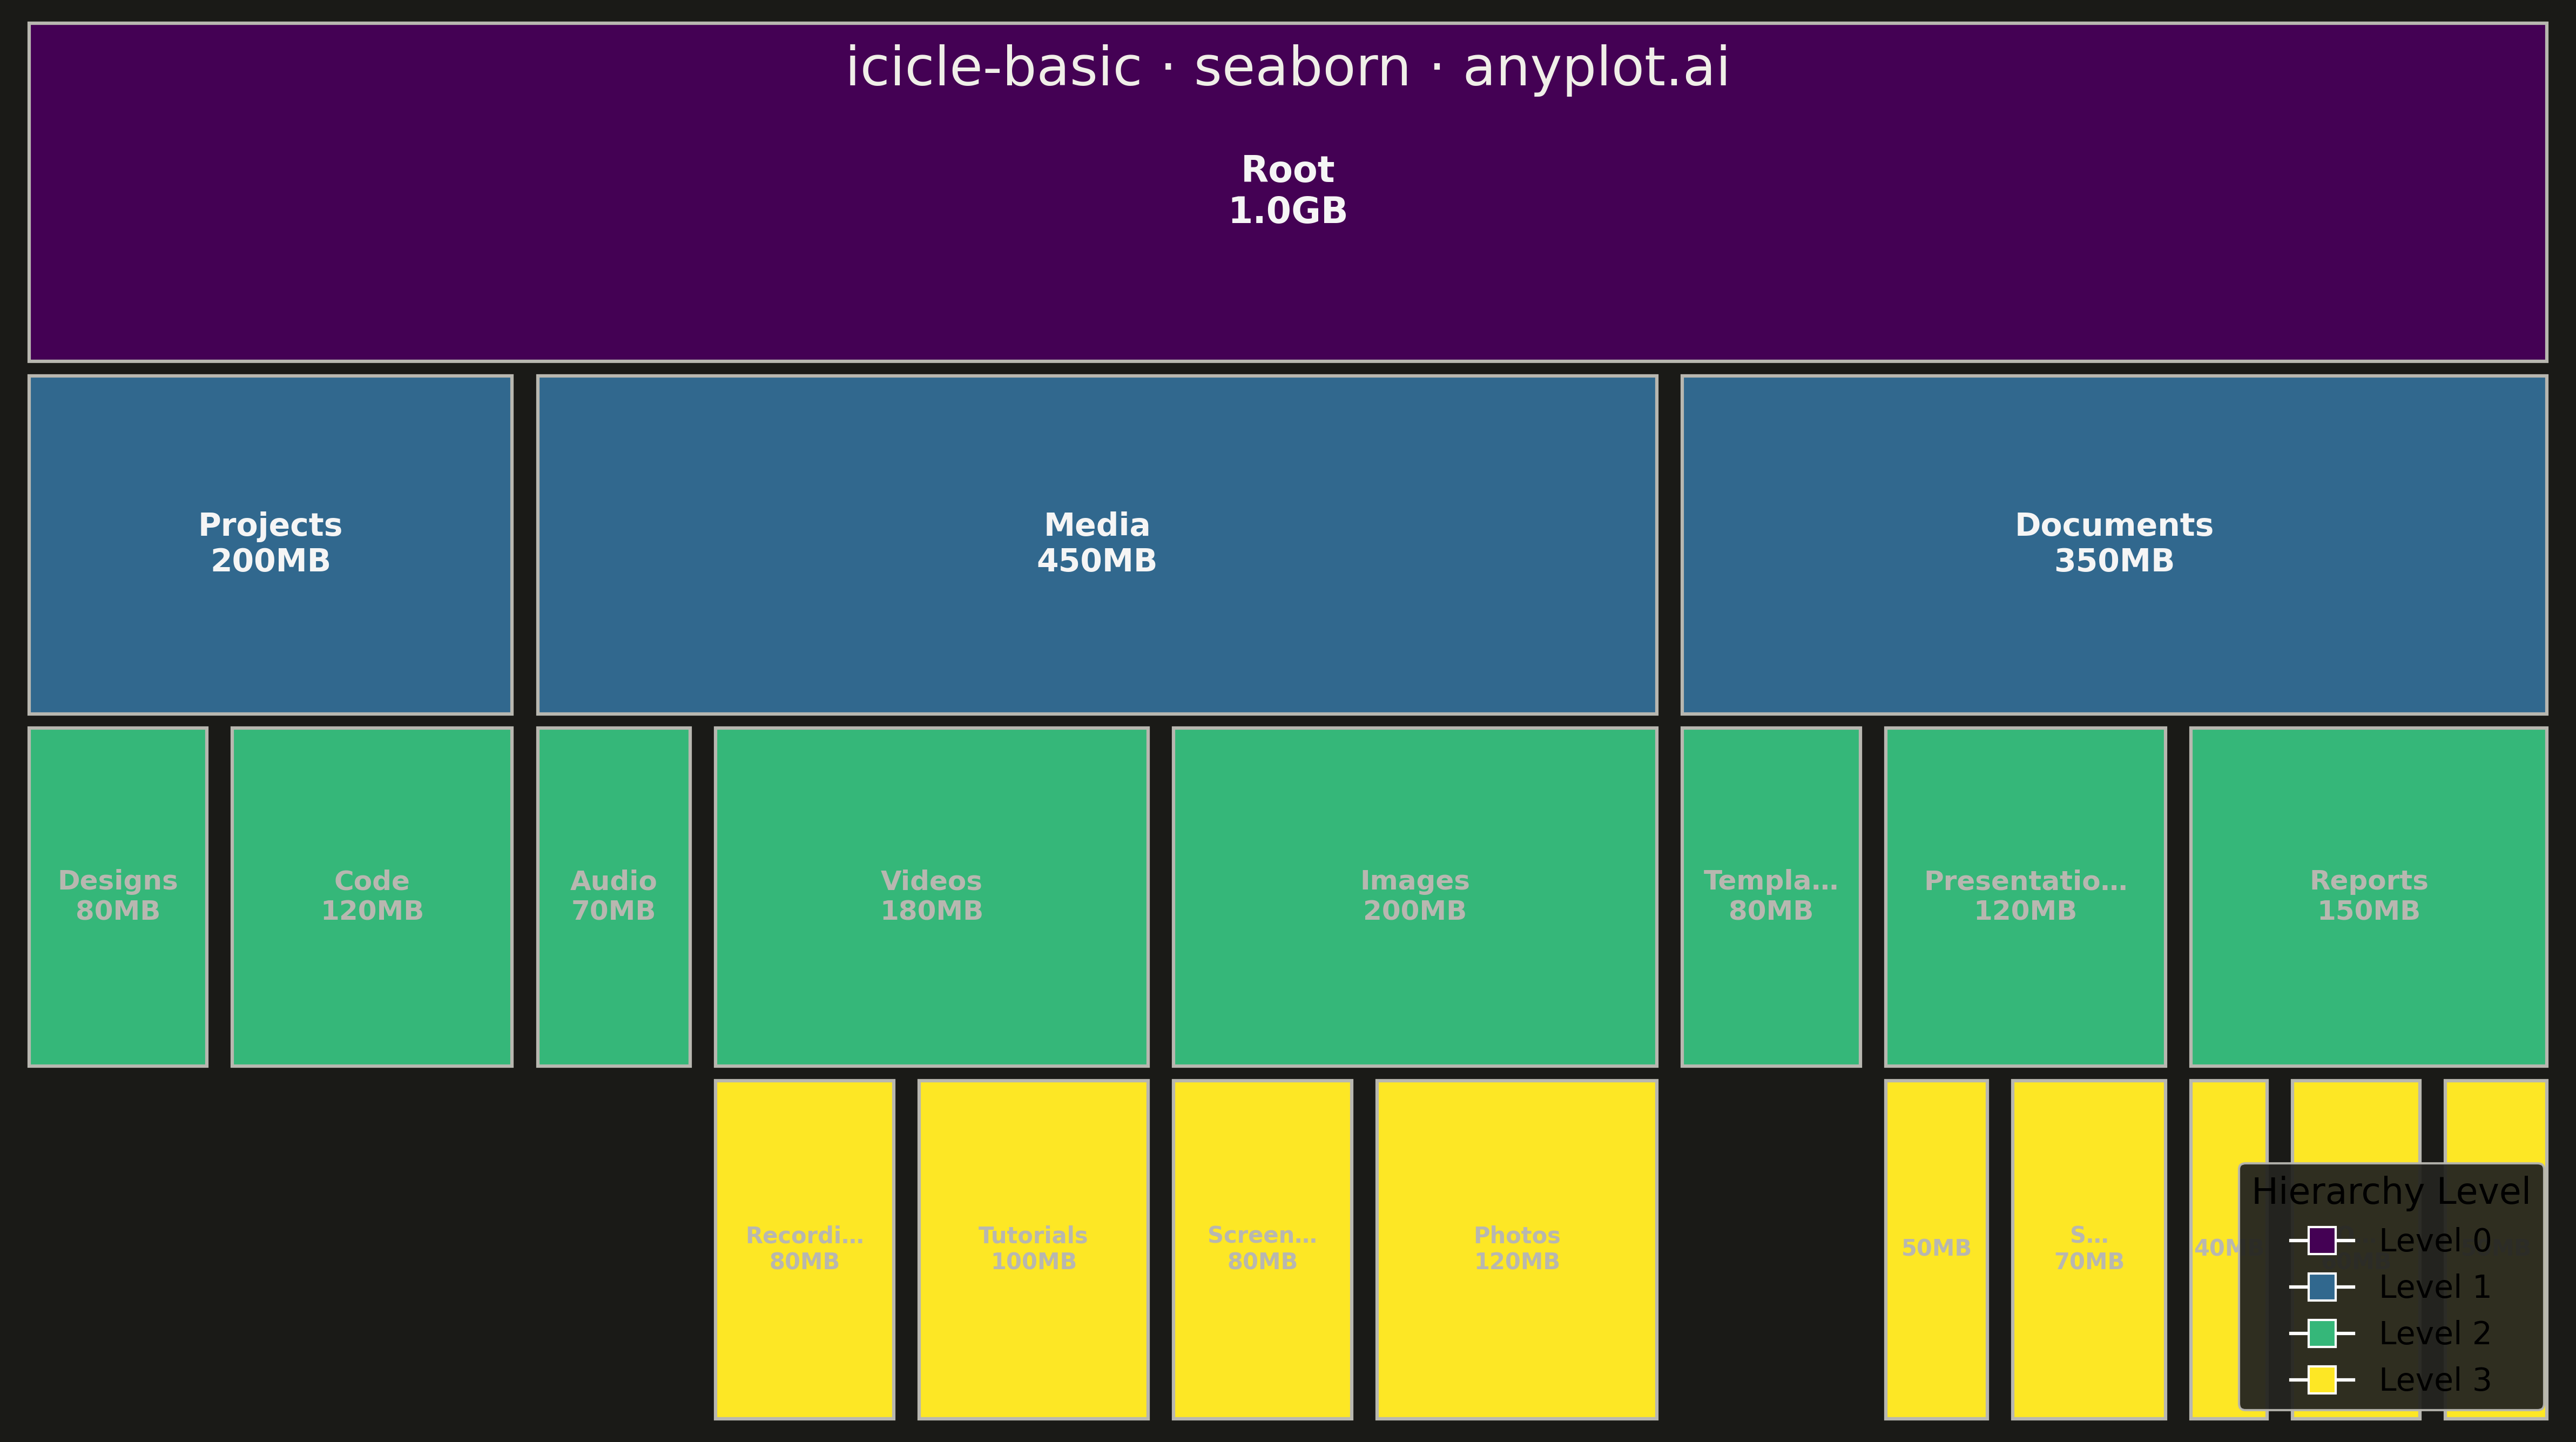
An icicle chart displaying hierarchical data as adjacent rectangles in a layered structure, where each rectangle's size represents its value in the hierarchy. Unlike treemaps that nest rectangles, icicle charts stack them in rows (horizontal) or columns (vertical), making parent-child relationships explicitly visible through spatial adjacency. This layout excels at showing both the hierarchy levels and the proportional values simultaneously.
""" anyplot.ai
icicle-basic: Basic Icicle Chart
Library: seaborn 0.13.2 | Python 3.13.13
Quality: 84/100 | Updated: 2026-05-13
"""

import os

import matplotlib.pyplot as plt
import pandas as pd
from matplotlib.patches import Rectangle


THEME = os.getenv("ANYPLOT_THEME", "light")
PAGE_BG = "#FAF8F1" if THEME == "light" else "#1A1A17"
ELEVATED_BG = "#FFFDF6" if THEME == "light" else "#242420"
INK = "#1A1A17" if THEME == "light" else "#F0EFE8"
INK_SOFT = "#4A4A44" if THEME == "light" else "#B8B7B0"

# Hierarchical data: File system structure
hierarchy_data = [
    ("Root", None, 1000),
    ("Documents", "Root", 350),
    ("Media", "Root", 450),
    ("Projects", "Root", 200),
    ("Reports", "Documents", 150),
    ("Presentations", "Documents", 120),
    ("Templates", "Documents", 80),
    ("Images", "Media", 200),
    ("Videos", "Media", 180),
    ("Audio", "Media", 70),
    ("Q1_Report.pdf", "Reports", 50),
    ("Q2_Report.pdf", "Reports", 60),
    ("Annual.pdf", "Reports", 40),
    ("Sales.pptx", "Presentations", 70),
    ("Training.pptx", "Presentations", 50),
    ("Photos", "Images", 120),
    ("Screenshots", "Images", 80),
    ("Tutorials", "Videos", 100),
    ("Recordings", "Videos", 80),
    ("Code", "Projects", 120),
    ("Designs", "Projects", 80),
]

# Build node dictionary
nodes = {}
for name, parent, value in hierarchy_data:
    nodes[name] = {"name": name, "parent": parent, "value": value, "children": []}

for name, parent, _value in hierarchy_data:
    if parent and parent in nodes:
        nodes[parent]["children"].append(name)

# Calculate levels
levels = {}
for name in nodes:
    level = 0
    current = name
    while nodes[current]["parent"] is not None:
        level += 1
        current = nodes[current]["parent"]
    levels[name] = level

max_level = max(levels.values())

# Calculate totals (sum of children or own value if leaf)
totals = {}
sorted_nodes = sorted(nodes.keys(), key=lambda x: levels[x], reverse=True)
for name in sorted_nodes:
    children = nodes[name]["children"]
    if not children:
        totals[name] = nodes[name]["value"]
    else:
        totals[name] = sum(totals[child] for child in children)

# Calculate icicle chart positions
rectangles = []
stack = [("Root", 0.0, 1.0, 0)]

while stack:
    name, x_start, x_end, level = stack.pop()
    width = x_end - x_start
    height = 1.0 / (max_level + 1)
    y = 1.0 - (level + 1) * height

    rectangles.append(
        {"name": name, "x": x_start, "y": y, "width": width, "height": height, "level": level, "value": totals[name]}
    )

    children = nodes[name]["children"]
    if children:
        total_child_value = sum(totals[c] for c in children)
        current_x = x_start
        for child in reversed(children):
            child_fraction = totals[child] / total_child_value
            child_width = width * child_fraction
            stack.append((child, current_x, current_x + child_width, level + 1))
            current_x += child_width

rect_df = pd.DataFrame(rectangles)
n_levels = max_level + 1

# Use viridis colormap for hierarchy levels (theme-independent, works on both light and dark)
cmap = plt.colormaps["viridis"]
level_colors = {i: cmap(i / (n_levels - 1)) for i in range(n_levels)}

# Create figure and axes
fig, ax = plt.subplots(figsize=(16, 9), facecolor=PAGE_BG)
ax.set_facecolor(PAGE_BG)

# Draw rectangles
gap = 0.005
for _, rect in rect_df.iterrows():
    x = rect["x"] + gap
    y = rect["y"] + gap
    w = max(rect["width"] - 2 * gap, 0.001)
    h = max(rect["height"] - 2 * gap, 0.001)
    level = int(rect["level"])
    color = level_colors[level]

    patch = Rectangle((x, y), w, h, facecolor=color, edgecolor=INK_SOFT, linewidth=1.5)
    ax.add_patch(patch)

    # Add text labels with names and values
    if rect["width"] < 0.02:
        continue

    cx = rect["x"] + rect["width"] / 2
    cy = rect["y"] + rect["height"] / 2

    # Determine text color for contrast
    rgb = color[:3]
    luminance = 0.299 * rgb[0] + 0.587 * rgb[1] + 0.114 * rgb[2]
    text_color = INK_SOFT if luminance > 0.5 else "#F5F5F5"

    fontsize = 16 if level == 0 else (14 if level == 1 else (12 if level == 2 else 10))

    # Format value
    value = int(rect["value"])
    if value >= 1000:
        value_str = f"{value / 1000:.1f}GB"
    else:
        value_str = f"{value}MB"

    # Smart label truncation
    name = rect["name"]
    available_width = rect["width"]
    available_chars = max(5, int(available_width * 100))

    if len(name) <= available_chars:
        display_text = f"{name}\n{value_str}"
    else:
        if "." in name:
            parts = name.rsplit(".", 1)
            ext = "." + parts[1]
            base_chars = available_chars - len(ext) - 1
            if base_chars > 0:
                display_text = f"{parts[0][:base_chars]}…\n{value_str}"
            else:
                display_text = value_str
        else:
            display_text = f"{name[: available_chars - 1]}…\n{value_str}"

    ax.text(
        cx,
        cy,
        display_text,
        ha="center",
        va="center",
        fontsize=fontsize,
        fontweight="bold",
        color=text_color,
        linespacing=1.2,
    )

# Configure axes
ax.set_xlim(0, 1)
ax.set_ylim(0, 1)
ax.set_aspect("auto")
ax.axis("off")

# Title
ax.text(
    0.5,
    0.98,
    "icicle-basic · seaborn · anyplot.ai",
    ha="center",
    va="top",
    fontsize=24,
    fontweight="medium",
    color=INK,
    transform=ax.transAxes,
)

# Legend for hierarchy levels
legend_labels = ["Level 0", "Level 1", "Level 2", "Level 3"][:n_levels]
legend_patches = [
    plt.Line2D([0], [0], marker="s", color="w", markerfacecolor=level_colors[i], markersize=12, label=legend_labels[i])
    for i in range(n_levels)
]
ax.legend(
    handles=legend_patches,
    loc="lower right",
    fontsize=14,
    framealpha=0.95,
    facecolor=ELEVATED_BG,
    edgecolor=INK_SOFT,
    title="Hierarchy Level",
    title_fontsize=16,
)

plt.tight_layout()
plt.savefig(f"plot-{THEME}.png", dpi=300, bbox_inches="tight", facecolor=PAGE_BG)
Runnable source as JSON, for any HTTP client: https://api.anyplot.ai/specs/icicle-basic/seaborn/code. Any spec id and library id listed in llms-full.txt fit the same URL shape; every URL below is complete and callable.
{
  "spec_id": "icicle-basic",
  "language": "python",
  "library": "seaborn",
  "page": "https://anyplot.ai/icicle-basic/python/seaborn",
  "hub": "https://anyplot.ai/icicle-basic",
  "code_json": "https://api.anyplot.ai/specs/icicle-basic/seaborn/code",
  "spec_json": "https://api.anyplot.ai/specs/icicle-basic",
  "render_light_png": "https://storage.googleapis.com/anyplot-images/plots/icicle-basic/python/seaborn/plot-light.png",
  "render_dark_png": "https://storage.googleapis.com/anyplot-images/plots/icicle-basic/python/seaborn/plot-dark.png",
  "quality_score": 84.0,
  "license": "MIT",
  "guide": "https://anyplot.ai/llms.txt"
}
Part of Basic Icicle Chart on anyplot.ai.