The same plot in 14 other libraries — JavaScript: Chart.js, Apache ECharts, Highcharts, MUI X Charts; Python: Altair, Bokeh, lets-plot, Matplotlib, Plotly, plotnine, Pygal, Seaborn; R: ggplot2; Julia: Makie.jl. Compare all 15 side by side: Basic Icicle Chart in Python, R, Julia and JavaScript.
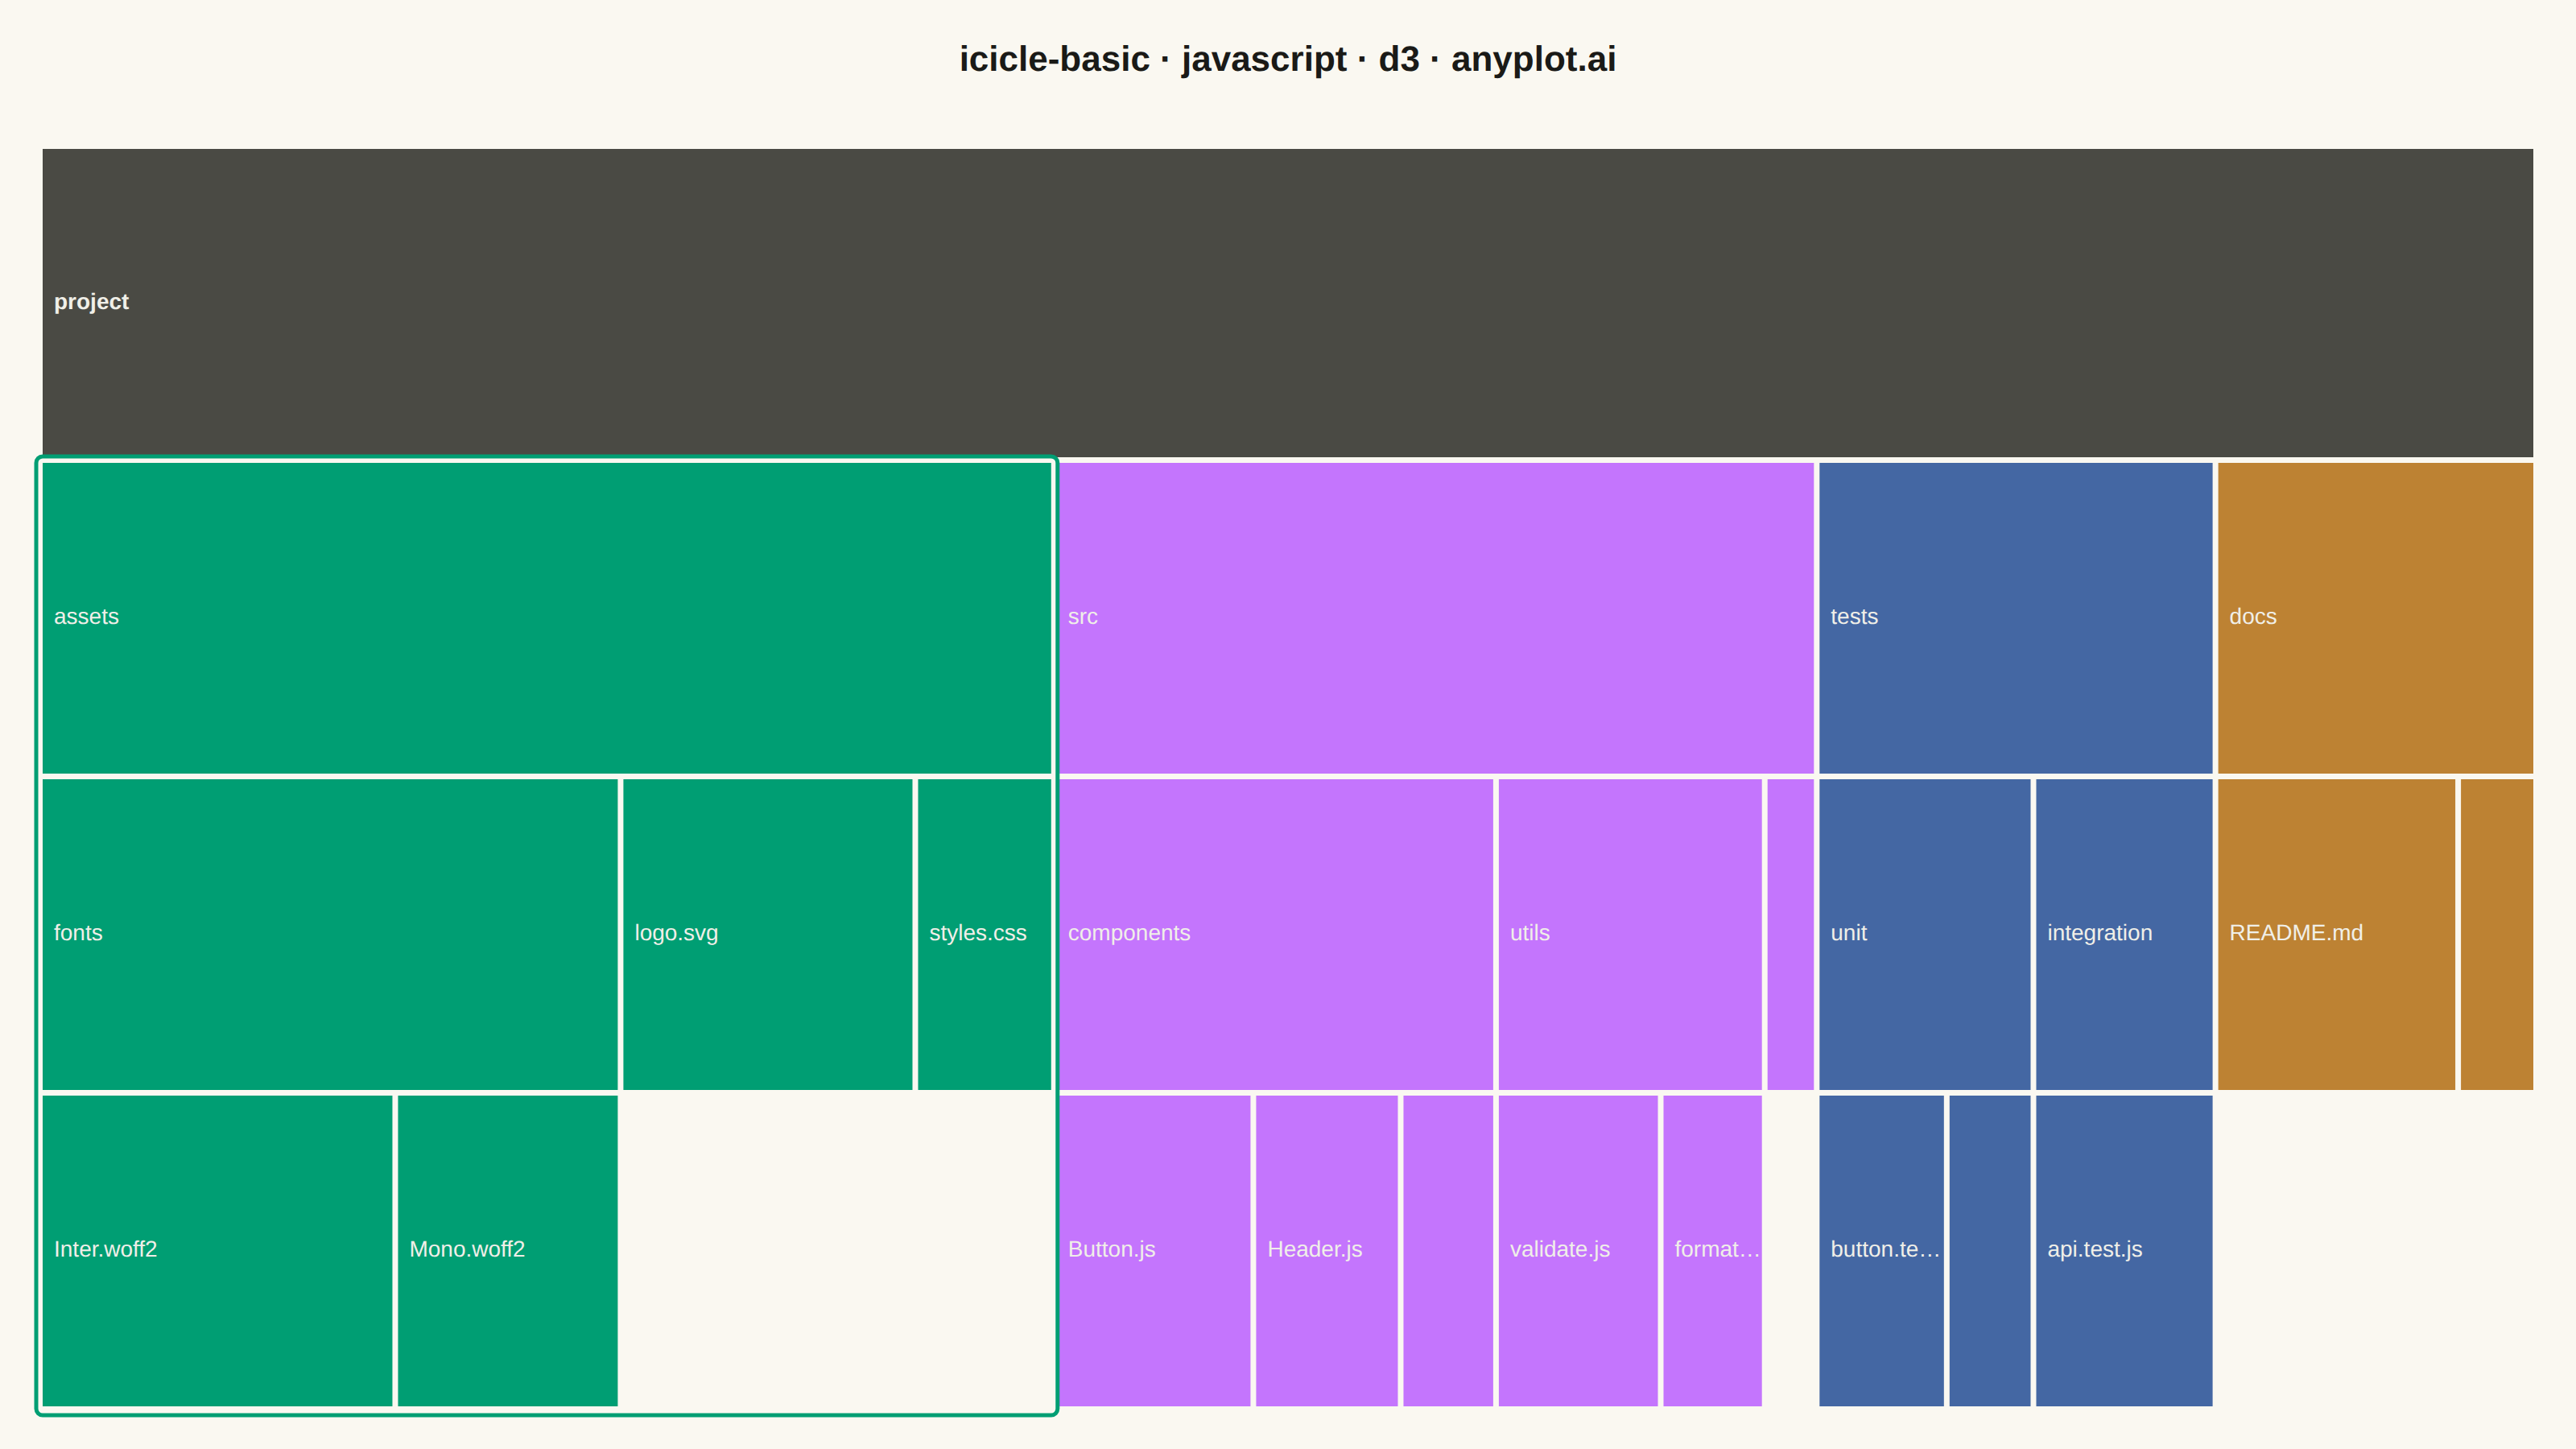
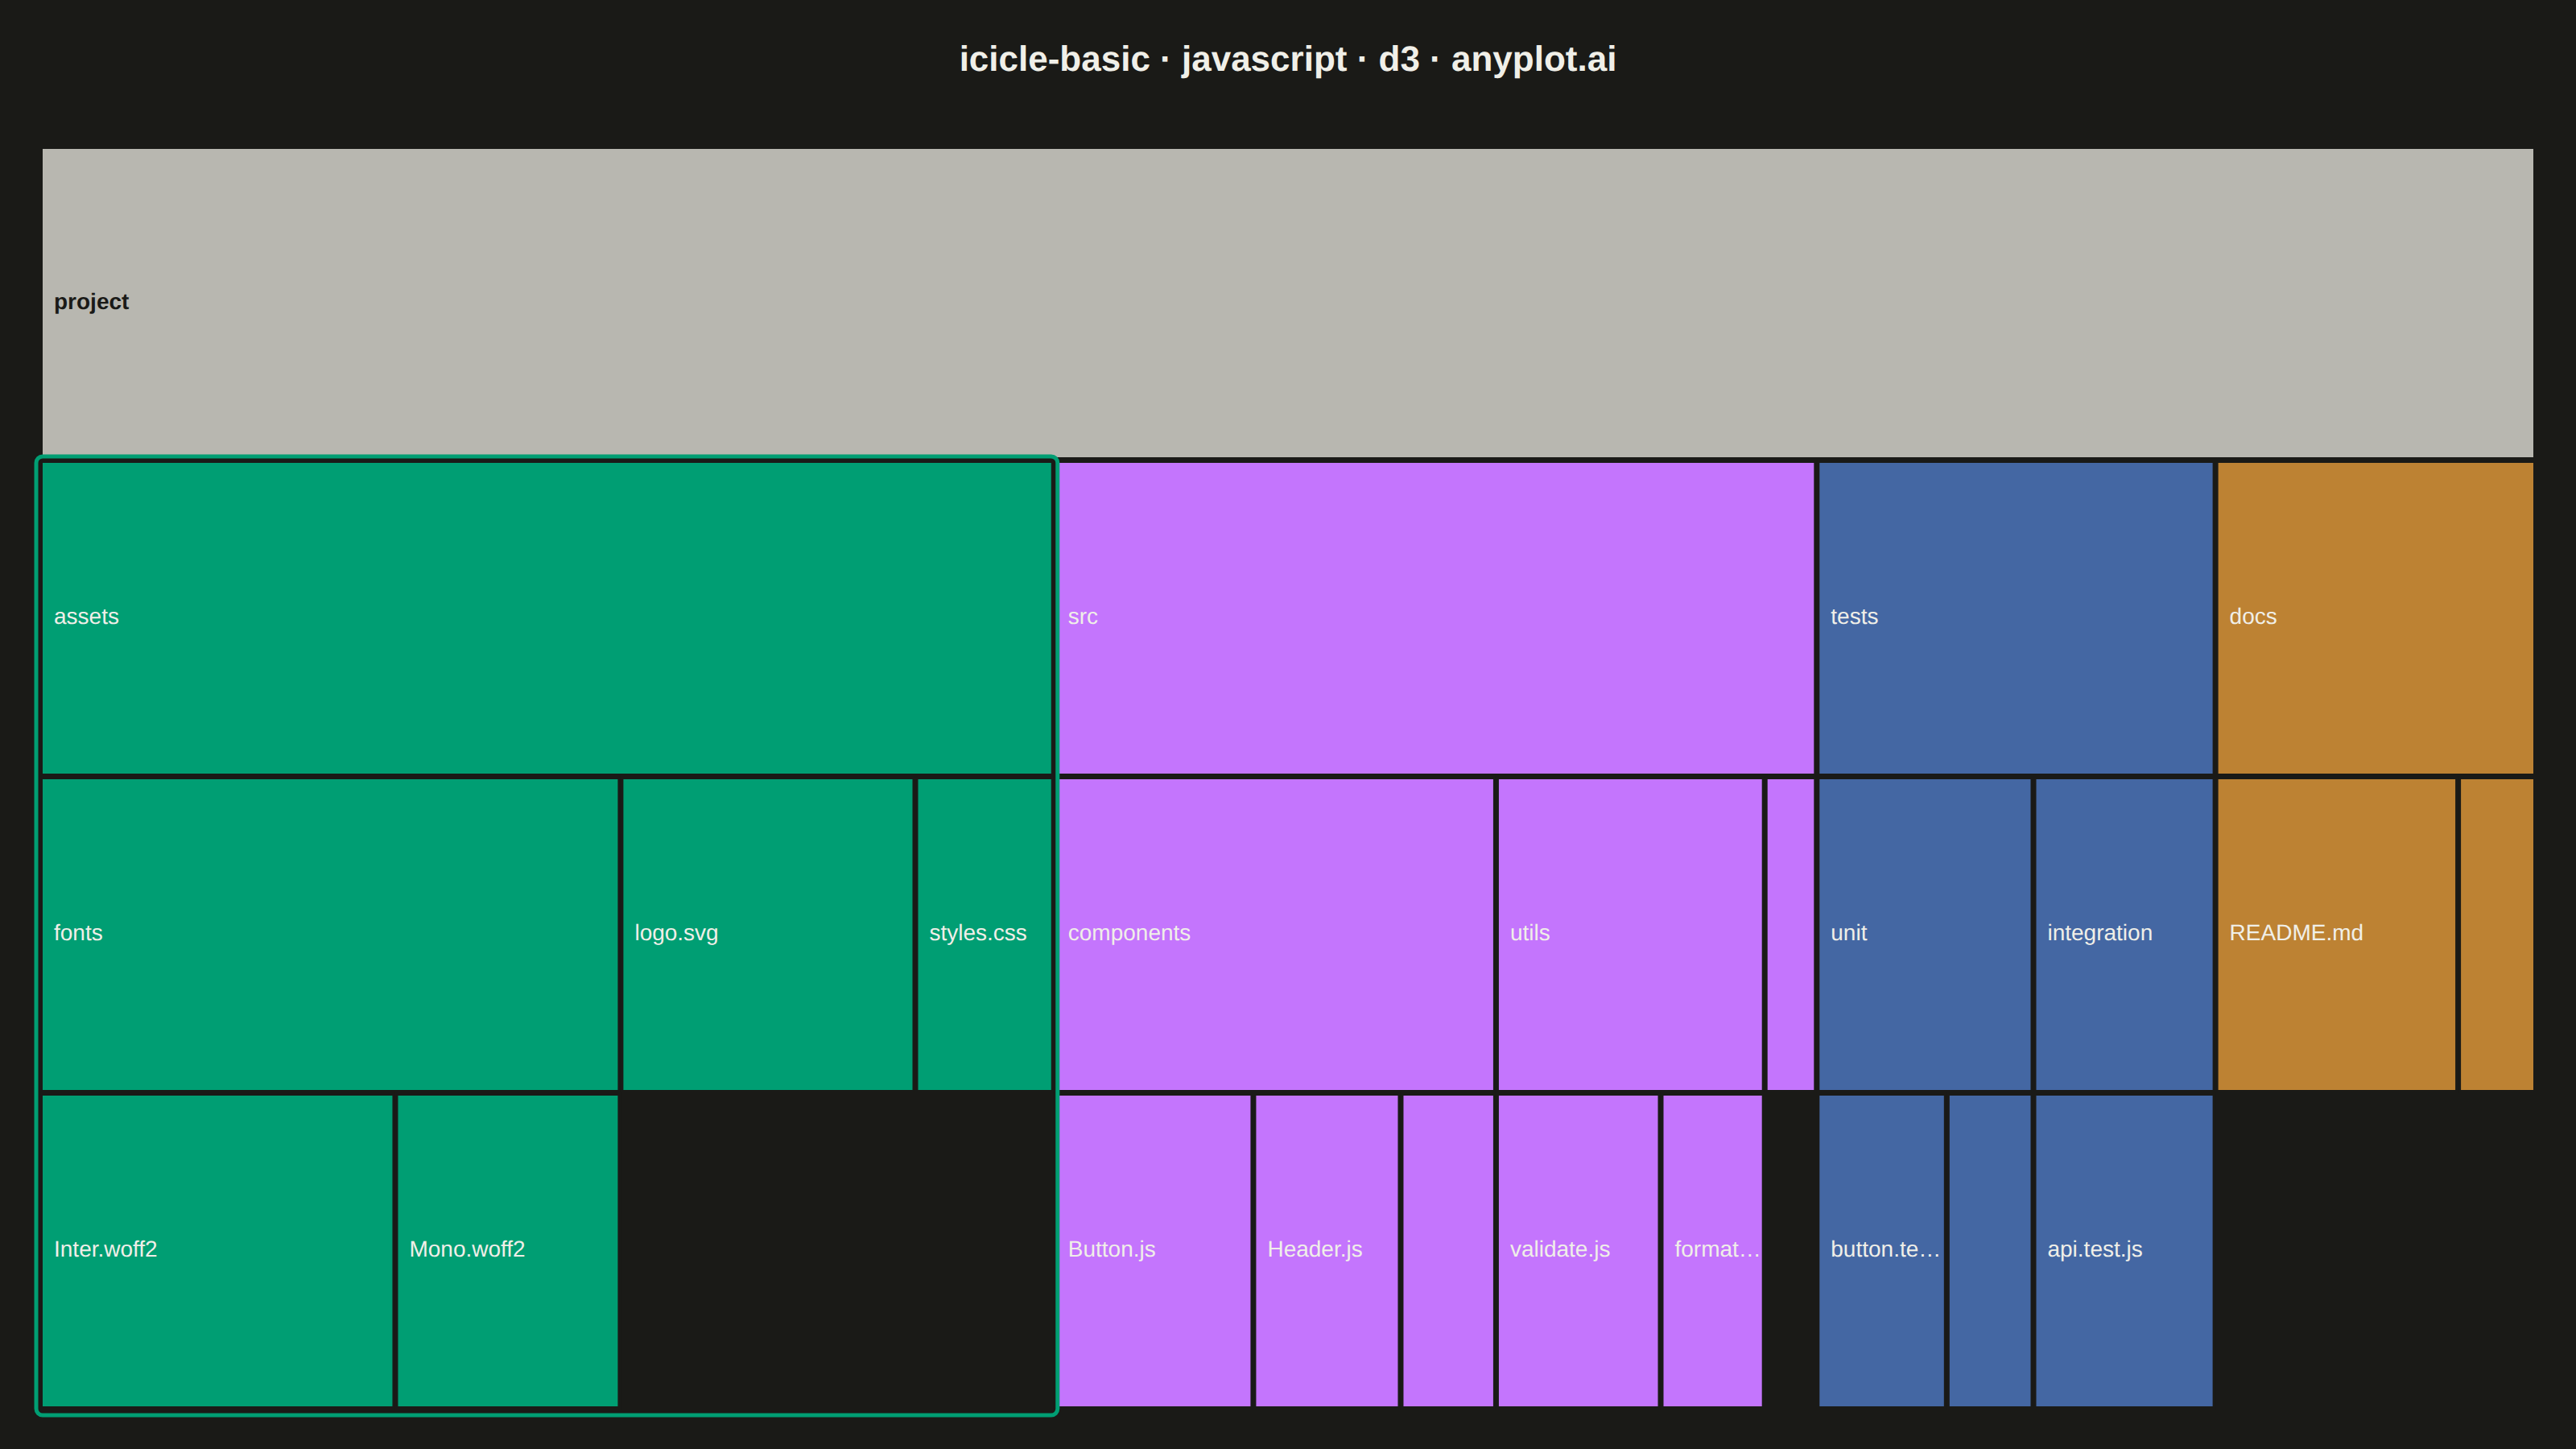
An icicle chart displaying hierarchical data as adjacent rectangles in a layered structure, where each rectangle's size represents its value in the hierarchy. Unlike treemaps that nest rectangles, icicle charts stack them in rows (horizontal) or columns (vertical), making parent-child relationships explicitly visible through spatial adjacency. This layout excels at showing both the hierarchy levels and the proportional values simultaneously.
// anyplot.ai
// icicle-basic: Basic Icicle Chart
// Library: d3 7.9.0 | JavaScript 22.23.2
// Quality: 92/100 | Created: 2026-09-05

const t = window.ANYPLOT_TOKENS;
const { width, height } = window.ANYPLOT_SIZE;
const margin = { top: 90, right: 24, bottom: 24, left: 24 };
const iw = width - margin.left - margin.right;
const ih = height - margin.top - margin.bottom;

// --- Data: a small project file tree (name/parent/value), in-memory --------
// value = approximate file size in KB, so leaf magnitudes read as a plausible
// real-world size distribution rather than abstract units.
const data = [
  { name: "project", parent: null, value: null },
  { name: "src", parent: "project", value: null },
  { name: "components", parent: "src", value: null },
  { name: "Button.js", parent: "components", value: 23 },
  { name: "Header.js", parent: "components", value: 17 },
  { name: "Footer.js", parent: "components", value: 11 },
  { name: "utils", parent: "src", value: null },
  { name: "format.js", parent: "utils", value: 12 },
  { name: "validate.js", parent: "utils", value: 19 },
  { name: "index.js", parent: "src", value: 6 },
  { name: "docs", parent: "project", value: null },
  { name: "README.md", parent: "docs", value: 28 },
  { name: "CHANGELOG.md", parent: "docs", value: 9 },
  { name: "tests", parent: "project", value: null },
  { name: "unit", parent: "tests", value: null },
  { name: "button.test.js", parent: "unit", value: 15 },
  { name: "utils.test.js", parent: "unit", value: 10 },
  { name: "integration", parent: "tests", value: null },
  { name: "api.test.js", parent: "integration", value: 21 },
  { name: "assets", parent: "project", value: null },
  { name: "logo.svg", parent: "assets", value: 34 },
  { name: "styles.css", parent: "assets", value: 16 },
  { name: "fonts", parent: "assets", value: null },
  { name: "Inter.woff2", parent: "fonts", value: 41 },
  { name: "Mono.woff2", parent: "fonts", value: 26 },
];

// --- Hierarchy + icicle layout ----------------------------------------------
// x-extent encodes value (breadth), y-extent encodes depth (root at top,
// children stacked below) — the classic top-to-bottom icicle orientation.
const root = d3
  .stratify()
  .id((d) => d.name)
  .parentId((d) => d.parent)(data)
  .sum((d) => d.value || 0)
  .sort((a, b) => b.value - a.value);

d3.partition().size([iw, ih]).padding(1.5)(root);

const nodes = root.descendants();

// --- Color: brand green + Imprint order for each top-level category --------
const categoryScale = d3
  .scaleOrdinal()
  .domain(root.children.map((d) => d.data.name))
  .range(t.palette);

const categoryOf = (node) => {
  let ancestor = node;
  while (ancestor.depth > 1) ancestor = ancestor.parent;
  return ancestor.data.name;
};

// Root uses a muted neutral (not raw t.ink) so it doesn't flip between a
// stark black block (light) and a stark white block (dark) like the rest
// of the chrome — a softer, less dominant theme transition.
const fillOf = (node) => (node.depth === 0 ? t.inkSoft : categoryScale(categoryOf(node)));

// Largest top-level branch (root.children is pre-sorted descending by value).
const largestCategory = root.children[0];

// --- Label contrast: pick dark/light ink from the cell's own fill luminance
const LABEL_DARK = "#1A1A17";
const LABEL_LIGHT = "#F0EFE8";
const relLuminance = (hex) => {
  const c = d3.color(hex).rgb();
  const chan = (v) => {
    v /= 255;
    return v <= 0.03928 ? v / 12.92 : Math.pow((v + 0.055) / 1.055, 2.4);
  };
  return 0.2126 * chan(c.r) + 0.7152 * chan(c.g) + 0.0722 * chan(c.b);
};
const labelColorOf = (node) => (relLuminance(fillOf(node)) > 0.42 ? LABEL_DARK : LABEL_LIGHT);

const truncate = (name, cellWidth) => {
  const maxChars = Math.floor((cellWidth - 12) / 6.4);
  return name.length > maxChars ? `${name.slice(0, Math.max(0, maxChars - 1))}…` : name;
};

// --- SVG mount ---------------------------------------------------------------
const svg = d3.select("#container").append("svg").attr("width", width).attr("height", height);
const g = svg.append("g").attr("transform", `translate(${margin.left},${margin.top})`);

// --- Cells --------------------------------------------------------------------
g.selectAll("rect")
  .data(nodes)
  .join("rect")
  .attr("x", (d) => d.x0)
  .attr("y", (d) => d.y0)
  .attr("width", (d) => Math.max(0, d.x1 - d.x0))
  .attr("height", (d) => Math.max(0, d.y1 - d.y0))
  .attr("fill", (d) => fillOf(d))
  .attr("stroke", t.pageBg)
  .attr("stroke-width", 2);

// --- Highlight ring: draw the eye to the single largest top-level branch ------
g.append("rect")
  .attr("x", largestCategory.x0 - 3)
  .attr("y", largestCategory.y0 - 3)
  .attr("width", largestCategory.x1 - largestCategory.x0 + 6)
  .attr("height", ih - largestCategory.y0 + 6)
  .attr("rx", 4)
  .attr("fill", "none")
  .attr("stroke", categoryScale(largestCategory.data.name))
  .attr("stroke-width", 2.5);

// --- Labels: only where a cell has room ---------------------------------------
g.selectAll("text")
  .data(nodes.filter((d) => d.x1 - d.x0 > 60 && d.y1 - d.y0 > 22))
  .join("text")
  .attr("x", (d) => d.x0 + 8)
  .attr("y", (d) => (d.y0 + d.y1) / 2)
  .attr("dominant-baseline", "middle")
  .style("font-size", "14px")
  .style("font-weight", (d) => (d.depth === 0 ? "600" : "400"))
  .attr("fill", (d) => labelColorOf(d))
  .text((d) => truncate(d.data.name, d.x1 - d.x0));

// --- Title ----------------------------------------------------------------
svg
  .append("text")
  .attr("x", width / 2)
  .attr("y", 44)
  .attr("text-anchor", "middle")
  .attr("fill", t.ink)
  .style("font-size", "22px")
  .style("font-weight", "600")
  .text("icicle-basic · javascript · d3 · anyplot.ai");
Runnable source as JSON, for any HTTP client: https://api.anyplot.ai/specs/icicle-basic/d3/code. Any spec id and library id listed in llms-full.txt fit the same URL shape; every URL below is complete and callable.
{
  "spec_id": "icicle-basic",
  "language": "javascript",
  "library": "d3",
  "page": "https://anyplot.ai/icicle-basic/javascript/d3",
  "hub": "https://anyplot.ai/icicle-basic",
  "code_json": "https://api.anyplot.ai/specs/icicle-basic/d3/code",
  "spec_json": "https://api.anyplot.ai/specs/icicle-basic",
  "render_light_png": "https://storage.googleapis.com/anyplot-images/plots/icicle-basic/javascript/d3/plot-light.png",
  "render_dark_png": "https://storage.googleapis.com/anyplot-images/plots/icicle-basic/javascript/d3/plot-dark.png",
  "interactive_light_html": "https://storage.googleapis.com/anyplot-images/plots/icicle-basic/javascript/d3/plot-light.html",
  "interactive_dark_html": "https://storage.googleapis.com/anyplot-images/plots/icicle-basic/javascript/d3/plot-dark.html",
  "quality_score": 92.0,
  "license": "MIT",
  "guide": "https://anyplot.ai/llms.txt"
}
Part of Basic Icicle Chart on anyplot.ai.