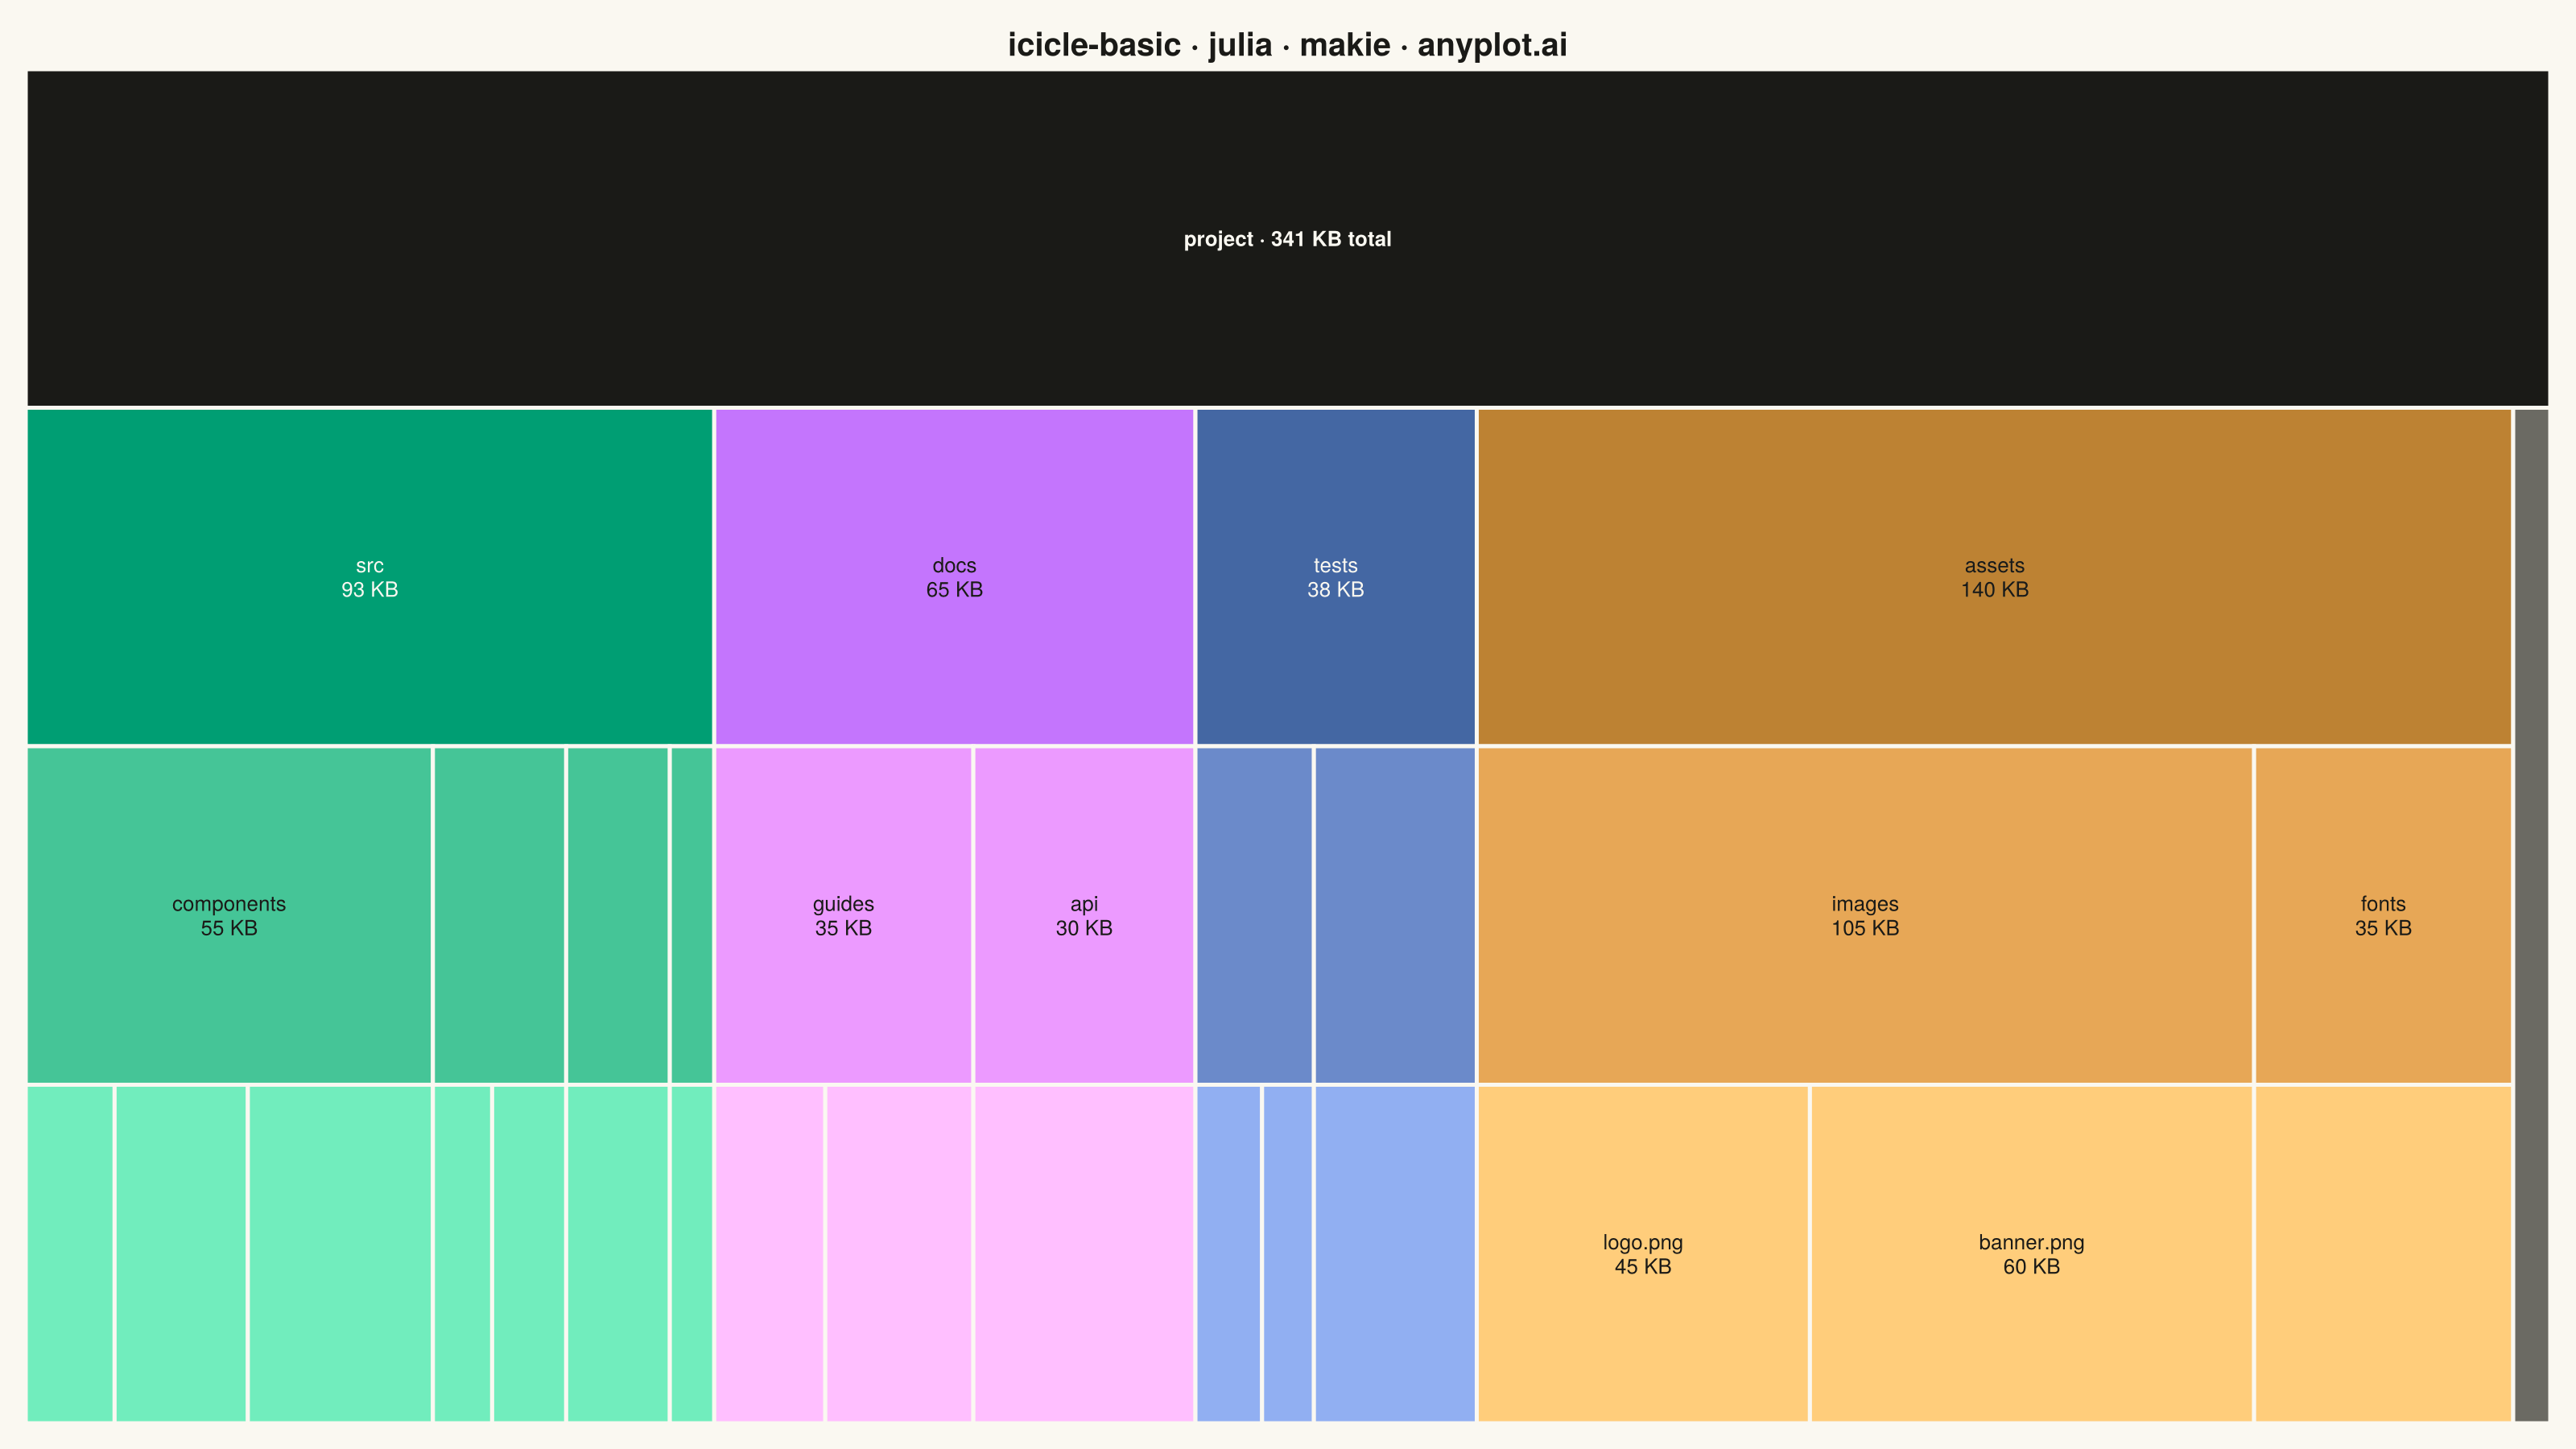
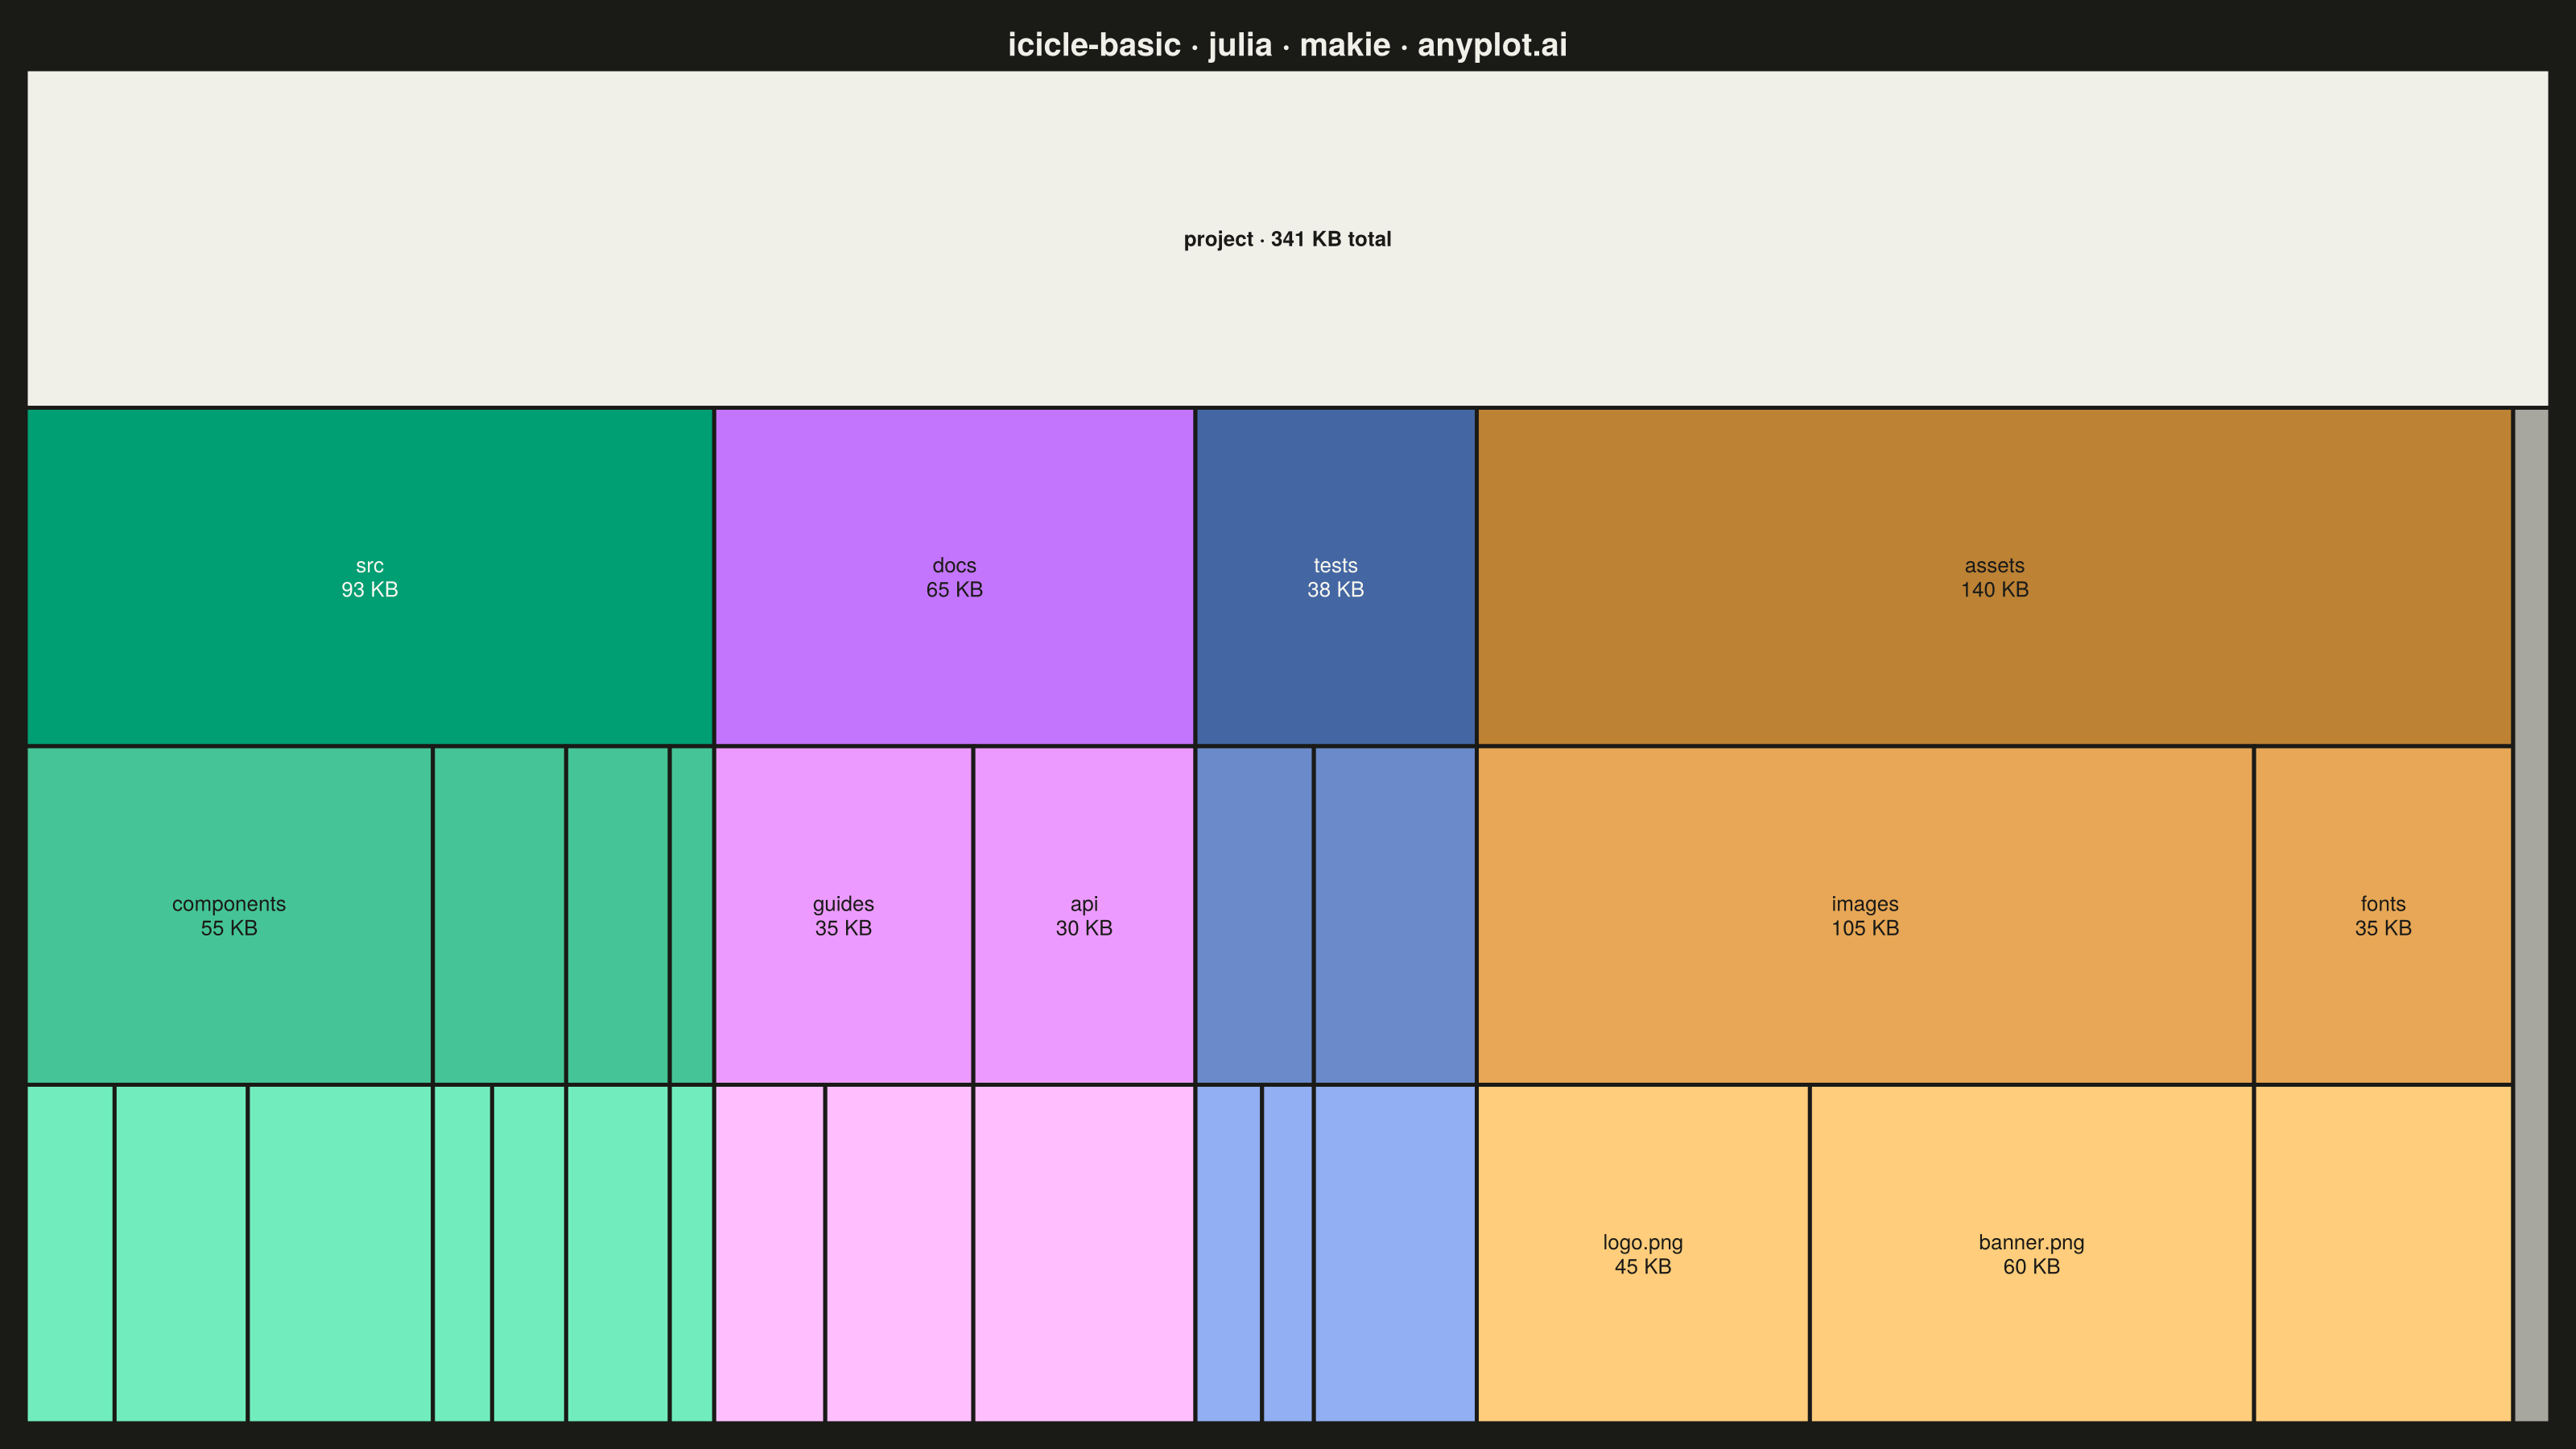
The same plot in 14 other libraries — Python: Altair, Bokeh, lets-plot, Matplotlib, Plotly, plotnine, Pygal, Seaborn; R: ggplot2; JavaScript: Chart.js, D3.js, Apache ECharts, Highcharts, MUI X Charts. Compare all 15 side by side: Basic Icicle Chart in Python, R, Julia and JavaScript.
An icicle chart displaying hierarchical data as adjacent rectangles in a layered structure, where each rectangle's size represents its value in the hierarchy. Unlike treemaps that nest rectangles, icicle charts stack them in rows (horizontal) or columns (vertical), making parent-child relationships explicitly visible through spatial adjacency. This layout excels at showing both the hierarchy levels and the proportional values simultaneously.
# anyplot.ai
# icicle-basic: Basic Icicle Chart
# Library: makie 0.21.9 | Julia 1.11.9
# Quality: 86/100 | Created: 2026-09-05

using CairoMakie
using Colors

# Theme tokens -----------------------------------------------------------------
const THEME    = get(ENV, "ANYPLOT_THEME", "light")
const PAGE_BG  = THEME == "light" ? colorant"#FAF8F1" : colorant"#1A1A17"
const INK      = THEME == "light" ? colorant"#1A1A17" : colorant"#F0EFE8"

# Root band and the "other" leaf strip are data-bearing fills (they encode a
# value, not chrome), so -- unlike the usual theme-adaptive neutral/muted
# anchors -- they stay a single fixed hex in both renders.
const FIXED_NEUTRAL = colorant"#726F64"
const FIXED_MUTED   = colorant"#B0AA98"

const IMPRINT_PALETTE = [
    colorant"#009E73", colorant"#C475FD", colorant"#4467A3", colorant"#BD8233",
]

# Icicle layout helpers -- recursive tree partition (data-layout only; the
# plot itself stays top-level, top-down below, mirroring the treemap recipe).
function subtree_value(name, children, raw_value)
    kids = get(children, name, String[])
    isempty(kids) ? raw_value[name] : sum(subtree_value(k, children, raw_value) for k in kids)
end

function leaf_levels!(acc, name, level, children)
    kids = get(children, name, String[])
    if isempty(kids)
        push!(acc, level)
    else
        for k in kids
            leaf_levels!(acc, k, level + 1, children)
        end
    end
end

# Leaves with no children stretch down to the bottom row (no children to
# fill the space below them) -- the classic icicle-chart visual convention.
# `branch` is threaded down from the root's direct children so each rect
# already knows which top-level folder it belongs to (no separate parent
# lookup needed later for coloring).
function layout_icicle!(rects, name, x0, x1, level, max_depth, children, raw_value, branch)
    kids = get(children, name, String[])
    row_span = isempty(kids) ? (max_depth - level + 1) : 1
    push!(rects, (name = name, x0 = x0, x1 = x1, level = level, row_span = row_span, branch = branch))
    if !isempty(kids)
        total = subtree_value(name, children, raw_value)
        cx = x0
        for k in kids
            w = subtree_value(k, children, raw_value) / total * (x1 - x0)
            child_branch = level == 0 ? k : branch
            layout_icicle!(rects, k, cx, cx + w, level + 1, max_depth, children, raw_value, child_branch)
            cx += w
        end
    end
end

# Depth-within-branch tint via perceptually uniform LCHab lightness lift
# toward a fixed ceiling (never the theme background), so a given depth
# renders the identical color in both light and dark PNGs -- only the
# surrounding chrome is allowed to flip.
function tint_lightness(base::RGB, frac::Float64)
    lch      = convert(LCHab, base)
    target_l = min(lch.l + 28.0, 90.0)
    l        = lch.l + frac * (target_l - lch.l)
    convert(RGB, LCHab(l, lch.c, lch.h))
end

# Data ---------------------------------------------------------------------
# Source-tree file sizes (KB) for a small web app repository. Folder sizes
# are the sum of their contents, computed below rather than hard-coded.
tree = [
    ("project", "", 0.0),
    ("src", "project", 0.0),
    ("components", "src", 0.0),
    ("Button.jsx", "components", 12.0),
    ("Modal.jsx", "components", 18.0),
    ("Table.jsx", "components", 25.0),
    ("utils", "src", 0.0),
    ("format.js", "utils", 8.0),
    ("validate.js", "utils", 10.0),
    ("hooks", "src", 0.0),
    ("useAuth.js", "hooks", 14.0),
    ("styles", "src", 0.0),
    ("theme.css", "styles", 6.0),
    ("docs", "project", 0.0),
    ("guides", "docs", 0.0),
    ("setup.md", "guides", 15.0),
    ("deploy.md", "guides", 20.0),
    ("api", "docs", 0.0),
    ("reference.md", "api", 30.0),
    ("tests", "project", 0.0),
    ("unit", "tests", 0.0),
    ("button.test.js", "unit", 9.0),
    ("utils.test.js", "unit", 7.0),
    ("integration", "tests", 0.0),
    ("flow.test.js", "integration", 22.0),
    ("assets", "project", 0.0),
    ("images", "assets", 0.0),
    ("logo.png", "images", 45.0),
    ("banner.png", "images", 60.0),
    ("fonts", "assets", 0.0),
    ("inter.woff2", "fonts", 35.0),
    ("config.json", "project", 5.0),
]

children  = Dict{String,Vector{String}}()
raw_value = Dict{String,Float64}()
for (name, parent, value) in tree
    raw_value[name] = value
    if !isempty(parent)
        push!(get!(children, parent, String[]), name)
    end
end

root = "project"
leaf_lvls = Int[]
leaf_levels!(leaf_lvls, root, 0, children)
max_depth = maximum(leaf_lvls)
total_kb  = subtree_value(root, children, raw_value)

rects = NamedTuple[]
layout_icicle!(rects, root, 0.0, total_kb, 0, max_depth, children, raw_value, "")

# Branch color: the four top-level folders each own a hue; the lone
# root-level file (no folder of its own) reads as "other" via the muted
# anchor. Deeper nodes within a branch lighten toward a shared ceiling so
# depth reads as a lightness ramp without spending extra hues.
branch_color = Dict(
    "src"         => IMPRINT_PALETTE[1],
    "docs"        => IMPRINT_PALETTE[2],
    "tests"       => IMPRINT_PALETTE[3],
    "assets"      => IMPRINT_PALETTE[4],
    "config.json" => FIXED_MUTED,
)

rect_colors = Vector{RGB}(undef, length(rects))
for (i, r) in enumerate(rects)
    if r.name == root
        rect_colors[i] = FIXED_NEUTRAL
    else
        base = branch_color[r.branch]
        frac = max_depth > 1 ? (r.level - 1) / (max_depth - 1) : 0.0
        rect_colors[i] = tint_lightness(base, frac)
    end
end

# Title scaled to fit if it ever runs past the mandated-title baseline.
title_text    = "icicle-basic · julia · makie · anyplot.ai"
title_default = 20
title_size = length(title_text) > 67 ?
    max(round(Int, title_default * 67 / length(title_text)), 14) :
    title_default

# Plot -----------------------------------------------------------------------
fig = Figure(resolution = (1600, 900), backgroundcolor = PAGE_BG)

ax = Axis(
    fig[1, 1];
    title           = title_text,
    titlesize       = title_size,
    titlecolor      = INK,
    backgroundcolor = PAGE_BG,
)
hidedecorations!(ax)
hidespines!(ax)

rows = max_depth + 1  # total row bands, root at the top, deepest leaves at the bottom
for (i, r) in enumerate(rects)
    y0 = rows - (r.level + r.row_span)
    y1 = rows - r.level
    poly!(ax, Rect2f(r.x0, y0, r.x1 - r.x0, y1 - y0);
        color       = rect_colors[i],
        strokecolor = PAGE_BG,
        strokewidth = 2.5,
    )
end

# Labels: name + size, only where the tile is wide enough to hold the text
# without overflowing (spec: hide labels on small nodes). The root band
# spans the full width and always fits.
for (i, r) in enumerate(rects)
    w      = r.x1 - r.x0
    val    = subtree_value(r.name, children, raw_value)
    label  = r.name == root ?
        "$(r.name) · $(round(Int, val)) KB total" :
        "$(r.name)\n$(round(Int, val)) KB"
    maxlen = maximum(length, split(label, '\n'))
    if w >= max(0.032 * total_kb, 0.0055 * total_kb * maxlen)
        y0 = rows - (r.level + r.row_span)
        y1 = rows - r.level
        c  = rect_colors[i]
        text!(ax, r.x0 + w / 2, (y0 + y1) / 2;
            text          = label,
            align         = (:center, :center),
            justification = :center,
            color         = 0.2126 * red(c) + 0.7152 * green(c) + 0.0722 * blue(c) > 0.5 ?
                colorant"#1A1A17" : colorant"#FAF8F1",
            fontsize      = 13,
            font          = r.name == root ? :bold : :regular,
        )
    end
end

xlims!(ax, 0, total_kb)
ylims!(ax, 0, rows)

save("plot-$(THEME).png", fig; px_per_unit = 2)
Runnable source as JSON, for any HTTP client: https://api.anyplot.ai/specs/icicle-basic/makie/code. Any spec id and library id listed in llms-full.txt fit the same URL shape; every URL below is complete and callable.
{
  "spec_id": "icicle-basic",
  "language": "julia",
  "library": "makie",
  "page": "https://anyplot.ai/icicle-basic/julia/makie",
  "hub": "https://anyplot.ai/icicle-basic",
  "code_json": "https://api.anyplot.ai/specs/icicle-basic/makie/code",
  "spec_json": "https://api.anyplot.ai/specs/icicle-basic",
  "render_light_png": "https://storage.googleapis.com/anyplot-images/plots/icicle-basic/julia/makie/plot-light.png",
  "render_dark_png": "https://storage.googleapis.com/anyplot-images/plots/icicle-basic/julia/makie/plot-dark.png",
  "quality_score": 86.0,
  "license": "MIT",
  "guide": "https://anyplot.ai/llms.txt"
}
Part of Basic Icicle Chart on anyplot.ai.