The same plot in 14 other libraries — JavaScript: Chart.js, D3.js, Highcharts, MUI X Charts; Python: Altair, Bokeh, lets-plot, Matplotlib, Plotly, plotnine, Pygal, Seaborn; R: ggplot2; Julia: Makie.jl. Compare all 15 side by side: Basic Icicle Chart in Python, R, Julia and JavaScript.
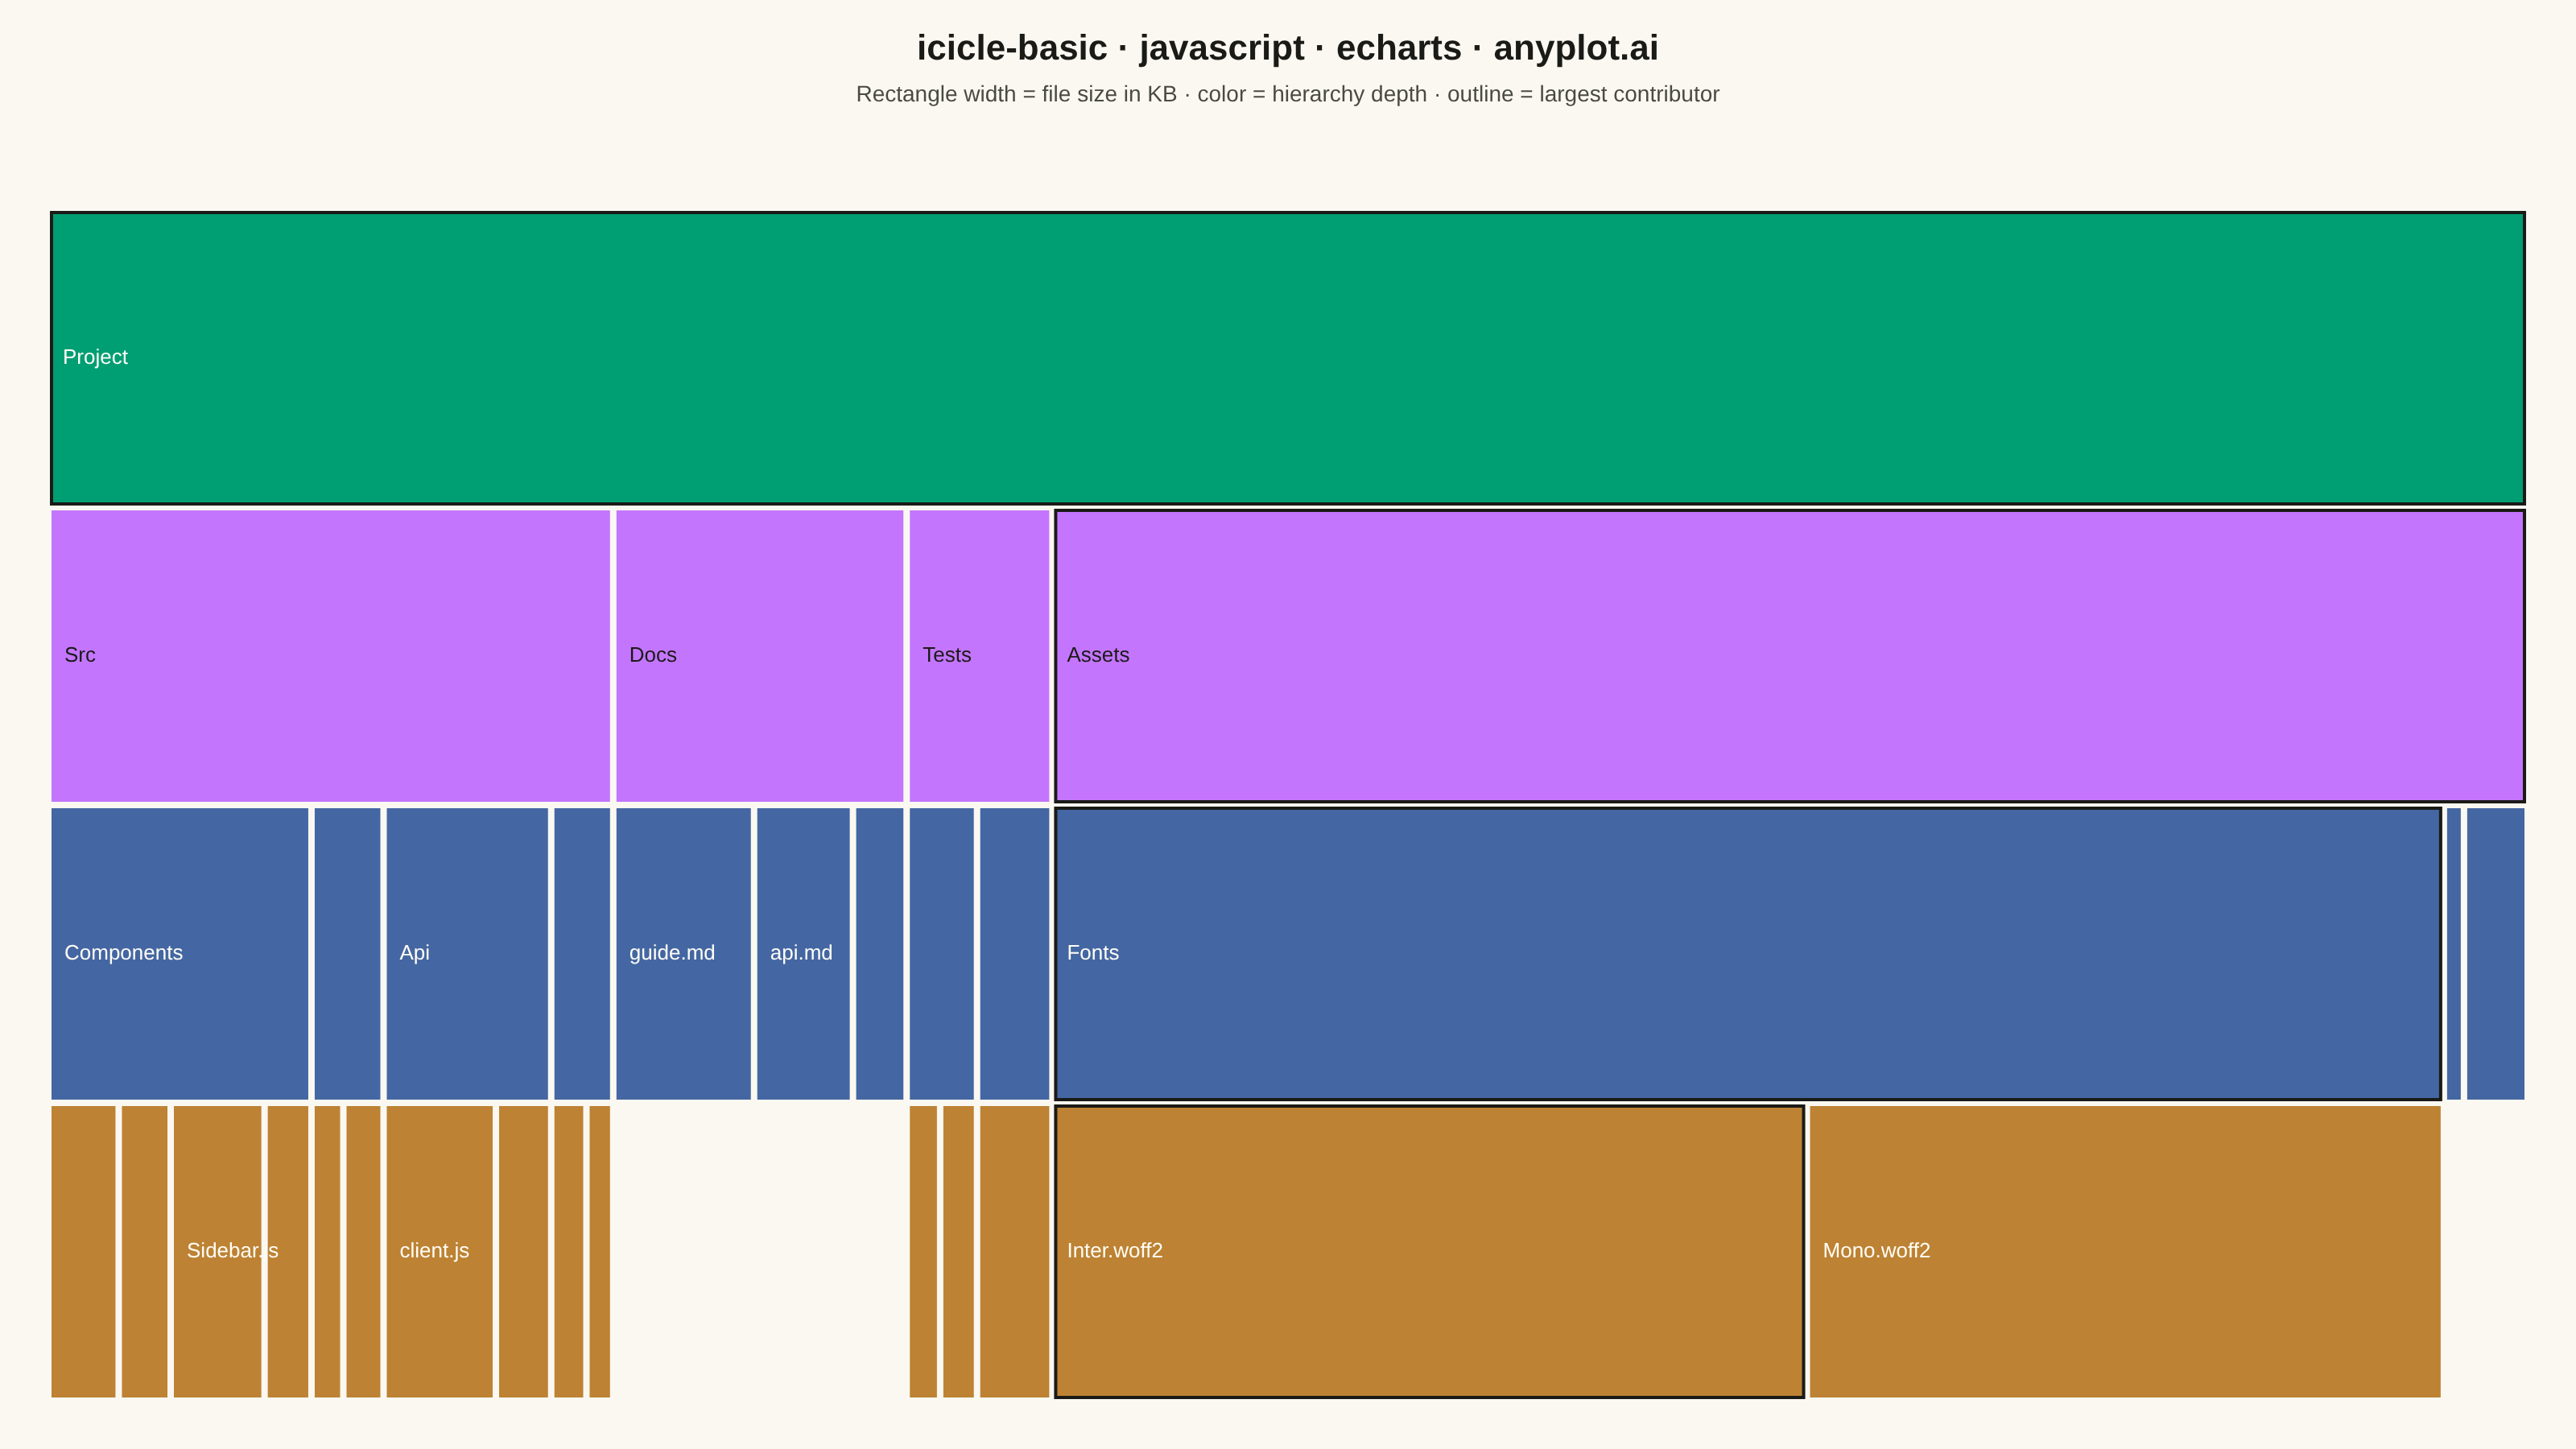
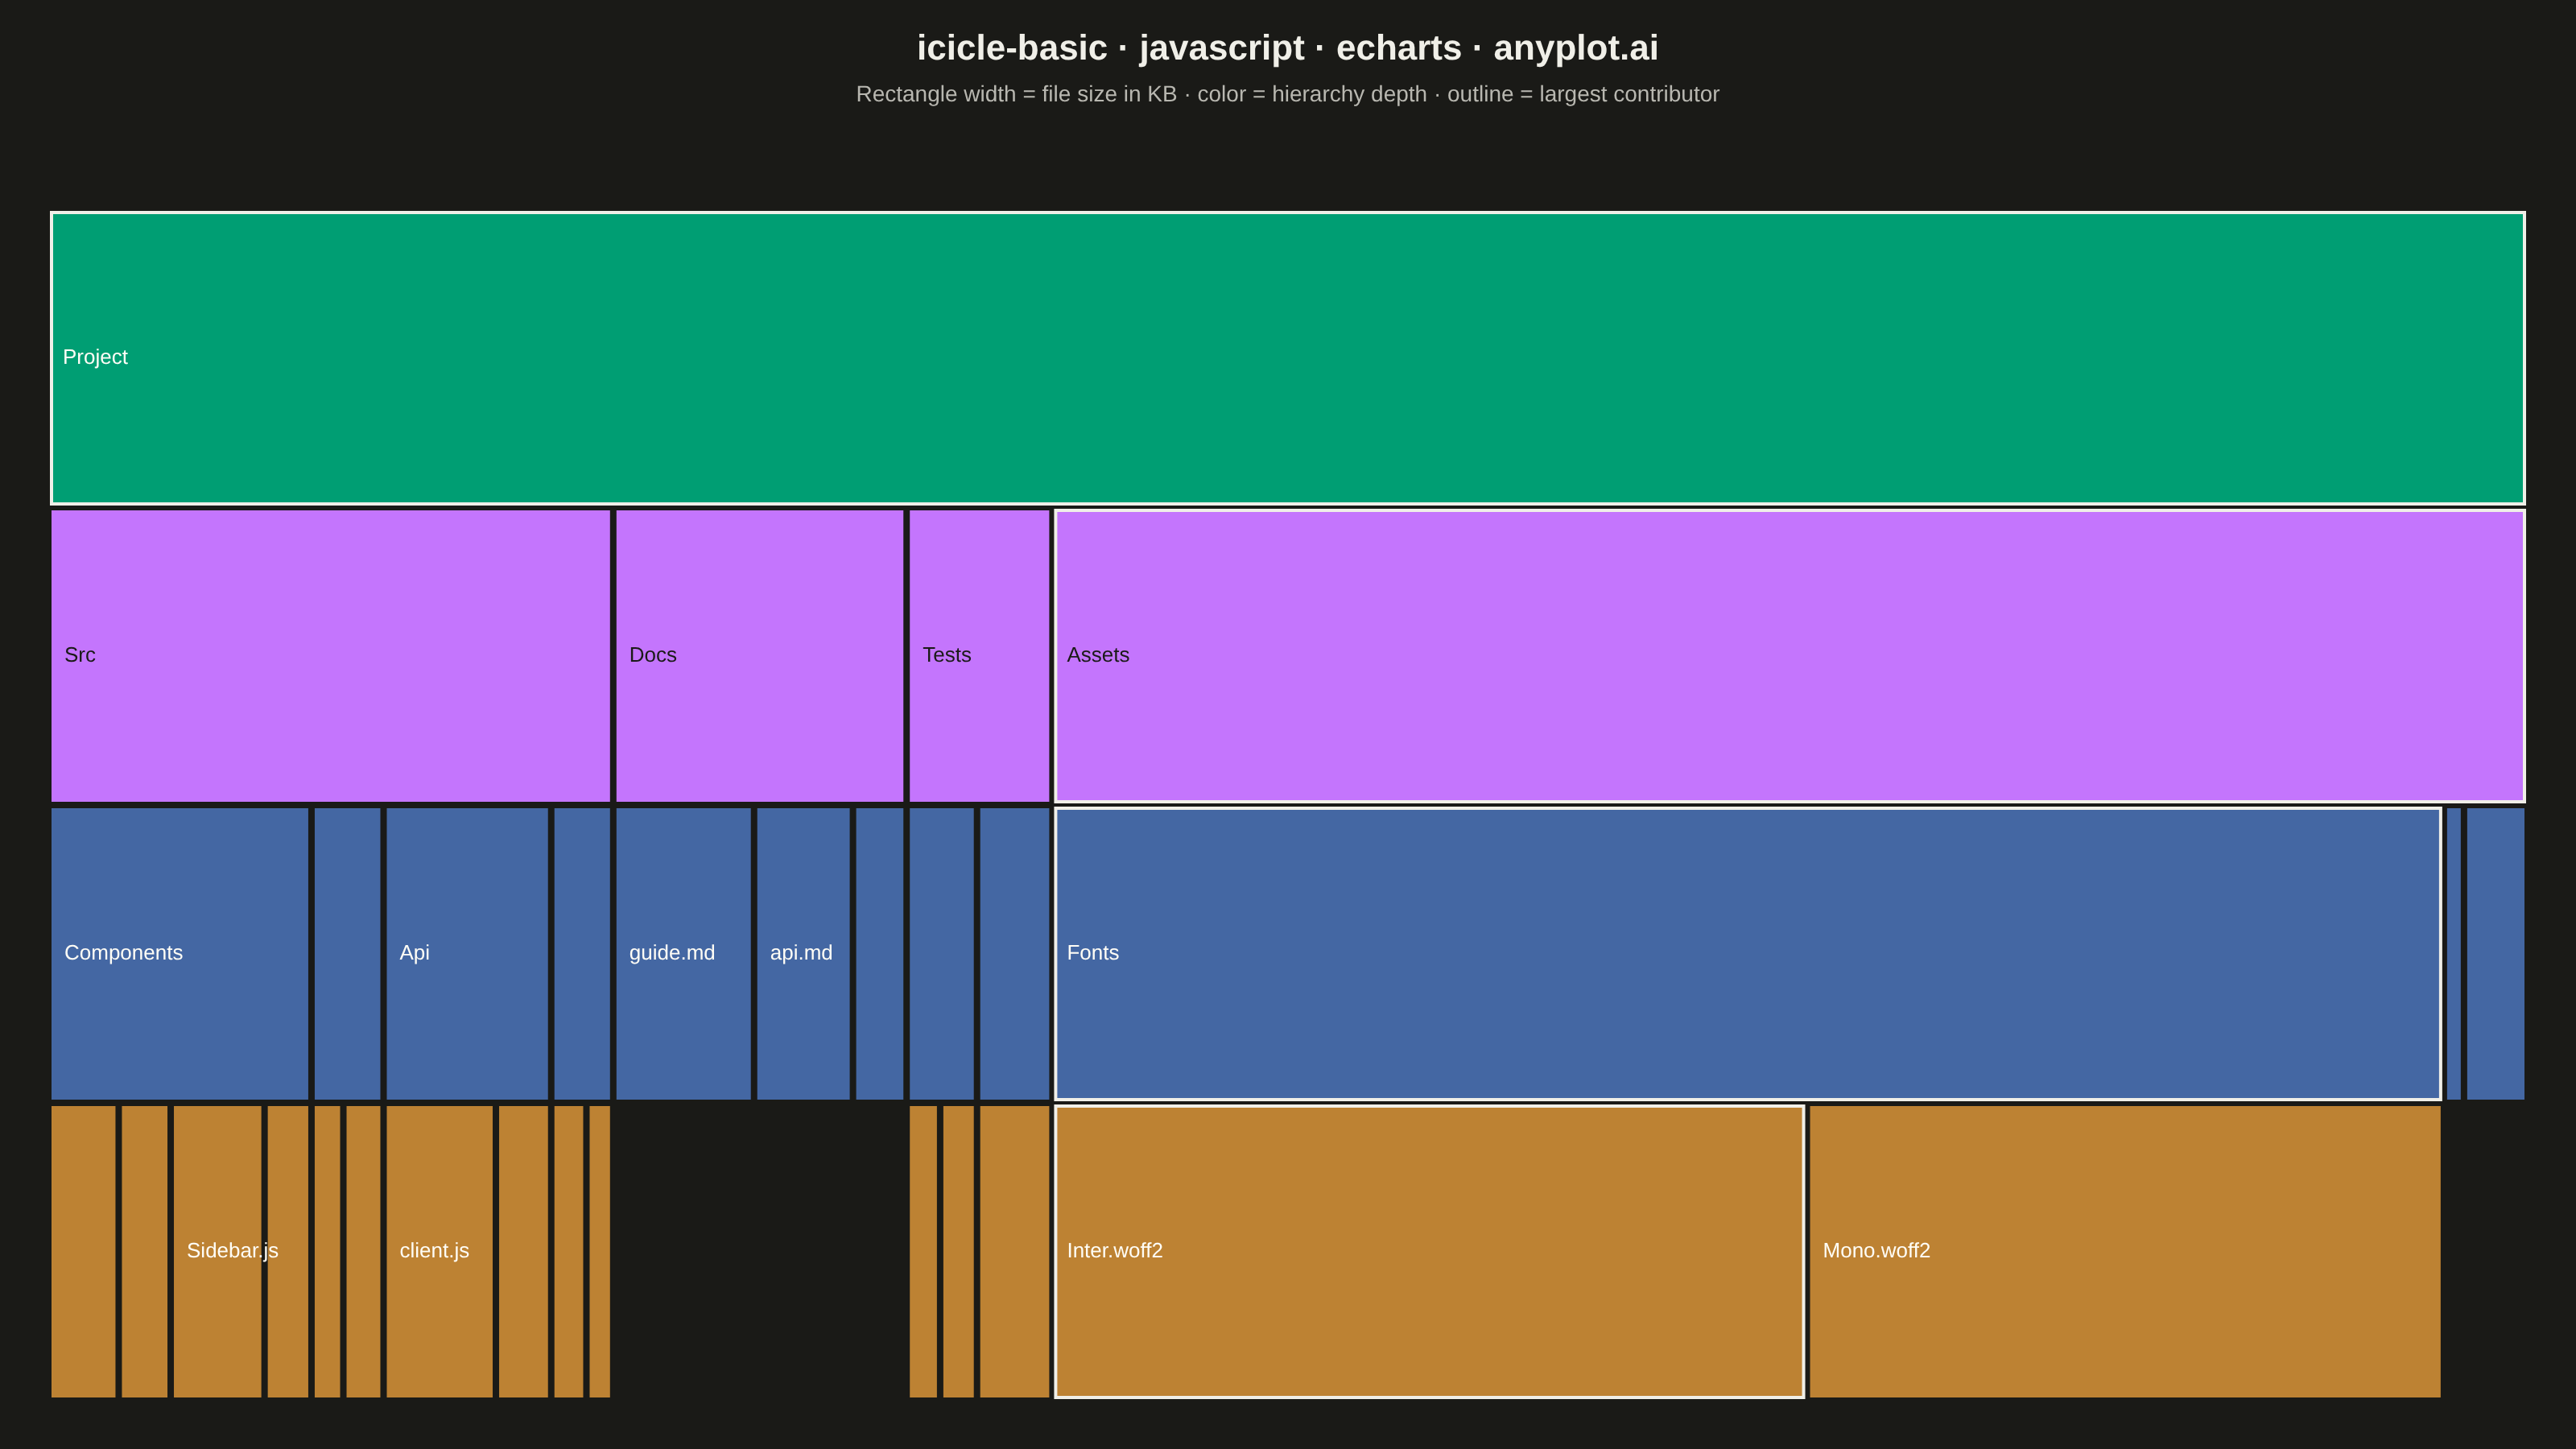
An icicle chart displaying hierarchical data as adjacent rectangles in a layered structure, where each rectangle's size represents its value in the hierarchy. Unlike treemaps that nest rectangles, icicle charts stack them in rows (horizontal) or columns (vertical), making parent-child relationships explicitly visible through spatial adjacency. This layout excels at showing both the hierarchy levels and the proportional values simultaneously.
// anyplot.ai
// icicle-basic: Basic Icicle Chart
// Library: echarts 6.1.0 | JavaScript 22.23.2
// Quality: 90/100 | Created: 2026-09-05

const t = window.ANYPLOT_TOKENS;

// --- Data (in-memory, deterministic): a small project file tree -----------
// Folders carry no explicit value; their value is the sum of their children.
const rawNodes = [
  { name: "Project", parent: null },
  { name: "Src", parent: "Project" },
  { name: "Docs", parent: "Project" },
  { name: "Tests", parent: "Project" },
  { name: "Assets", parent: "Project" },
  { name: "Components", parent: "Src" },
  { name: "Utils", parent: "Src" },
  { name: "Api", parent: "Src" },
  { name: "Styles", parent: "Src" },
  { name: "Unit", parent: "Tests" },
  { name: "Integration", parent: "Tests" },
  { name: "Fonts", parent: "Assets" },
  { name: "Header.js", parent: "Components", value: 4.2 },
  { name: "Footer.js", parent: "Components", value: 3.1 },
  { name: "Sidebar.js", parent: "Components", value: 5.6 },
  { name: "Modal.js", parent: "Components", value: 2.8 },
  { name: "format.js", parent: "Utils", value: 1.9 },
  { name: "validate.js", parent: "Utils", value: 2.4 },
  { name: "client.js", parent: "Api", value: 6.7 },
  { name: "endpoints.js", parent: "Api", value: 3.3 },
  { name: "theme.css", parent: "Styles", value: 2.1 },
  { name: "layout.css", parent: "Styles", value: 1.6 },
  { name: "guide.md", parent: "Docs", value: 8.4 },
  { name: "api.md", parent: "Docs", value: 5.9 },
  { name: "changelog.md", parent: "Docs", value: 3.2 },
  { name: "format.test.js", parent: "Unit", value: 2.0 },
  { name: "validate.test.js", parent: "Unit", value: 2.2 },
  { name: "api.test.js", parent: "Integration", value: 4.5 },
  { name: "logo.svg", parent: "Assets", value: 1.2 },
  { name: "icons.svg", parent: "Assets", value: 3.8 },
  { name: "Inter.woff2", parent: "Fonts", value: 45.0 },
  { name: "Mono.woff2", parent: "Fonts", value: 38.0 },
];

// --- Build tree + aggregate values bottom-up -------------------------------
const nodeMap = new Map();
rawNodes.forEach((n) => nodeMap.set(n.name, { ...n, children: [] }));
nodeMap.forEach((n) => {
  if (n.parent) nodeMap.get(n.parent).children.push(n);
});
const root = nodeMap.get("Project");

const aggregate = (node) => {
  if (node.children.length === 0) return node.value;
  node.value = node.children.reduce((sum, child) => sum + aggregate(child), 0);
  return node.value;
};
aggregate(root);

// --- Focal point: the single largest leaf and its ancestor chain ----------
// (Inter.woff2 -> Fonts -> Assets -> Project) get a thin outline so the
// dominant contributor to the hierarchy is visually called out.
let largestLeaf = null;
nodeMap.forEach((n) => {
  if (n.children.length === 0 && (!largestLeaf || n.value > largestLeaf.value)) {
    largestLeaf = n;
  }
});
const highlightNames = new Set();
for (let n = largestLeaf; n; n = n.parent ? nodeMap.get(n.parent) : null) {
  highlightNames.add(n.name);
}

// --- Partition layout: x = cumulative value, y = depth (rows) -------------
const rows = [];
let maxDepth = 0;
const layout = (node, depth, x0, x1) => {
  maxDepth = Math.max(maxDepth, depth);
  rows.push([x0, x1, depth, node.value, node.name, highlightNames.has(node.name) ? 1 : 0]);
  let x = x0;
  node.children.forEach((child) => {
    const width = (child.value / node.value) * (x1 - x0);
    layout(child, depth + 1, x, x + width);
    x += width;
  });
};
layout(root, 0, 0, root.value);

// --- Color by hierarchy level (Imprint palette) ----------------------------
const LEVEL_COLORS = [t.palette[0], t.palette[1], t.palette[2], t.palette[3]];
const textColorFor = (hex) => {
  const r = parseInt(hex.slice(1, 3), 16);
  const g = parseInt(hex.slice(3, 5), 16);
  const b = parseInt(hex.slice(5, 7), 16);
  const brightness = (r * 299 + g * 587 + b * 114) / 1000;
  return brightness > 140 ? "#1A1A17" : "#FFFDF6";
};

const GAP = 4;

const renderItem = (params, api) => {
  const x0 = api.value(0);
  const x1 = api.value(1);
  const depth = api.value(2);
  const name = api.value(4);
  const highlight = api.value(5) === 1;

  const corner = api.coord([x0, depth]);
  const size = api.size([x1 - x0, 1]);
  const width = Math.max(Math.abs(size[0]) - GAP, 0);
  const height = Math.max(Math.abs(size[1]) - GAP, 0);
  const fill = LEVEL_COLORS[depth % LEVEL_COLORS.length];
  const showLabel = width > 48 && height > 18;

  return {
    type: "rect",
    shape: { x: corner[0] + GAP / 2, y: corner[1] + GAP / 2, width, height },
    style: {
      fill,
      stroke: highlight ? t.ink : undefined,
      lineWidth: highlight ? 2 : 0,
      text: showLabel ? name : undefined,
      textFill: textColorFor(fill),
      textPosition: "insideLeft",
      textDistance: 8,
      textVerticalAlign: "middle",
      fontSize: 13,
      fontWeight: 500,
      width: Math.max(width - 14, 0),
      height,
      overflow: "truncate",
      ellipsis: "…",
    },
  };
};

// --- Init --------------------------------------------------------------
const chart = echarts.init(document.getElementById("container"));

// --- Option --------------------------------------------------------------
chart.setOption({
  animation: false,
  backgroundColor: "transparent",
  title: {
    text: "icicle-basic · javascript · echarts · anyplot.ai",
    subtext: "Rectangle width = file size in KB · color = hierarchy depth · outline = largest contributor",
    left: "center",
    textStyle: { color: t.ink, fontSize: 22 },
    subtextStyle: { color: t.inkSoft, fontSize: 14 },
  },
  tooltip: {
    formatter: (params) =>
      `<strong>${params.value[4]}</strong><br/>${params.value[3].toFixed(1)} KB`,
  },
  grid: { left: 30, right: 30, top: 130, bottom: 30 },
  xAxis: { type: "value", min: 0, max: root.value, show: false },
  yAxis: { type: "value", min: 0, max: maxDepth + 1, inverse: true, show: false },
  series: [
    {
      type: "custom",
      coordinateSystem: "cartesian2d",
      renderItem,
      encode: { x: [0, 1], y: 2 },
      data: rows,
    },
  ],
});
Runnable source as JSON, for any HTTP client: https://api.anyplot.ai/specs/icicle-basic/echarts/code. Any spec id and library id listed in llms-full.txt fit the same URL shape; every URL below is complete and callable.
{
  "spec_id": "icicle-basic",
  "language": "javascript",
  "library": "echarts",
  "page": "https://anyplot.ai/icicle-basic/javascript/echarts",
  "hub": "https://anyplot.ai/icicle-basic",
  "code_json": "https://api.anyplot.ai/specs/icicle-basic/echarts/code",
  "spec_json": "https://api.anyplot.ai/specs/icicle-basic",
  "render_light_png": "https://storage.googleapis.com/anyplot-images/plots/icicle-basic/javascript/echarts/plot-light.png",
  "render_dark_png": "https://storage.googleapis.com/anyplot-images/plots/icicle-basic/javascript/echarts/plot-dark.png",
  "interactive_light_html": "https://storage.googleapis.com/anyplot-images/plots/icicle-basic/javascript/echarts/plot-light.html",
  "interactive_dark_html": "https://storage.googleapis.com/anyplot-images/plots/icicle-basic/javascript/echarts/plot-dark.html",
  "quality_score": 90.0,
  "license": "MIT",
  "guide": "https://anyplot.ai/llms.txt"
}
Part of Basic Icicle Chart on anyplot.ai.